Online AI line chart maker
Track and present your data with Edraw.AI’s line graph maker. Upload your data, choose a template, or use AI to generate customizable, and accurate charts in seconds.
Keep your data in line with our AI line chart maker!
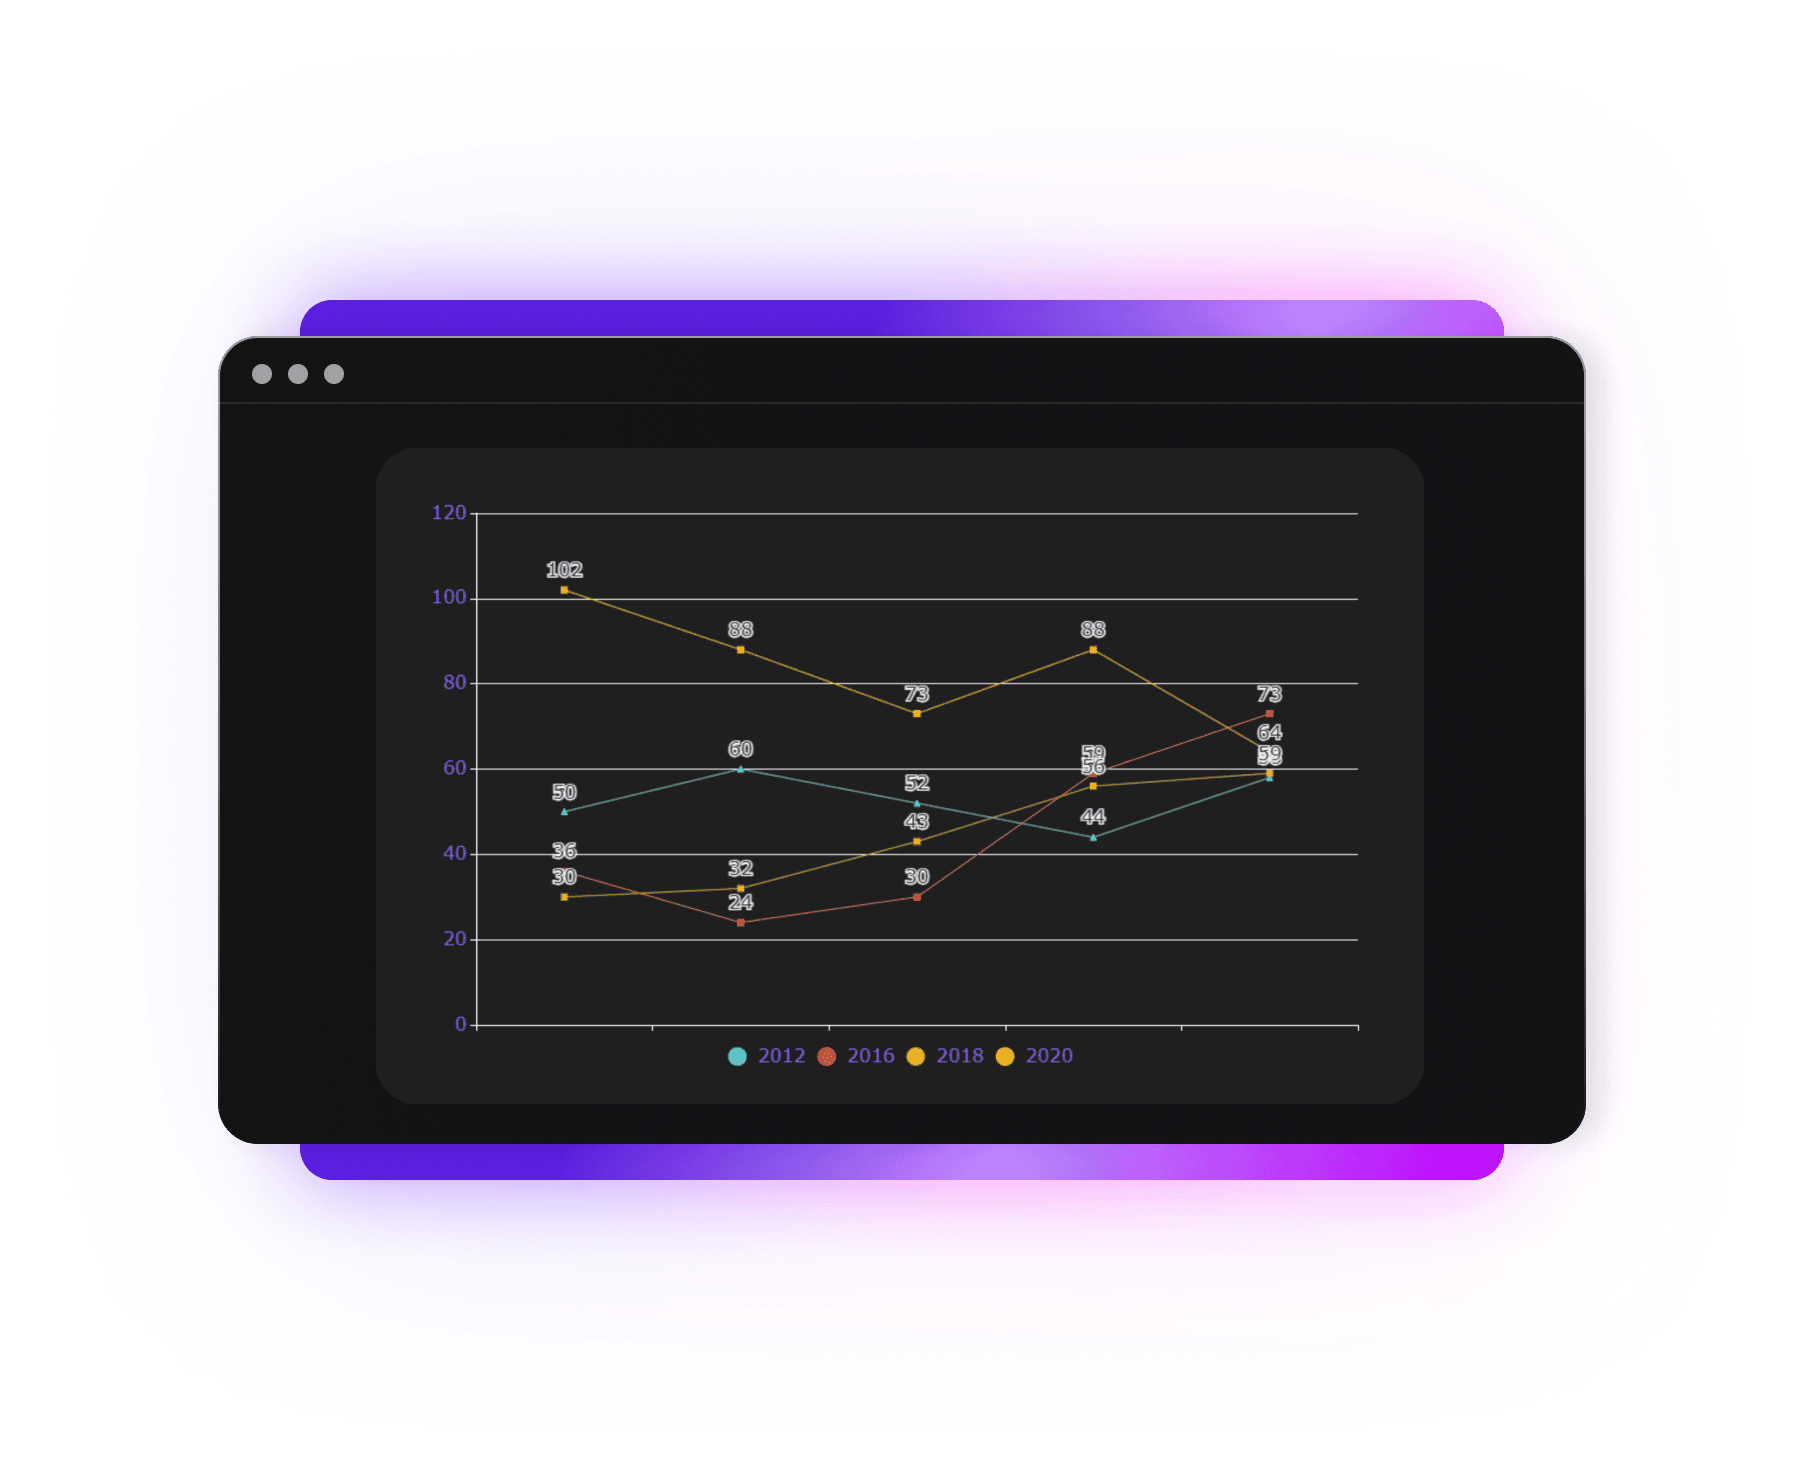
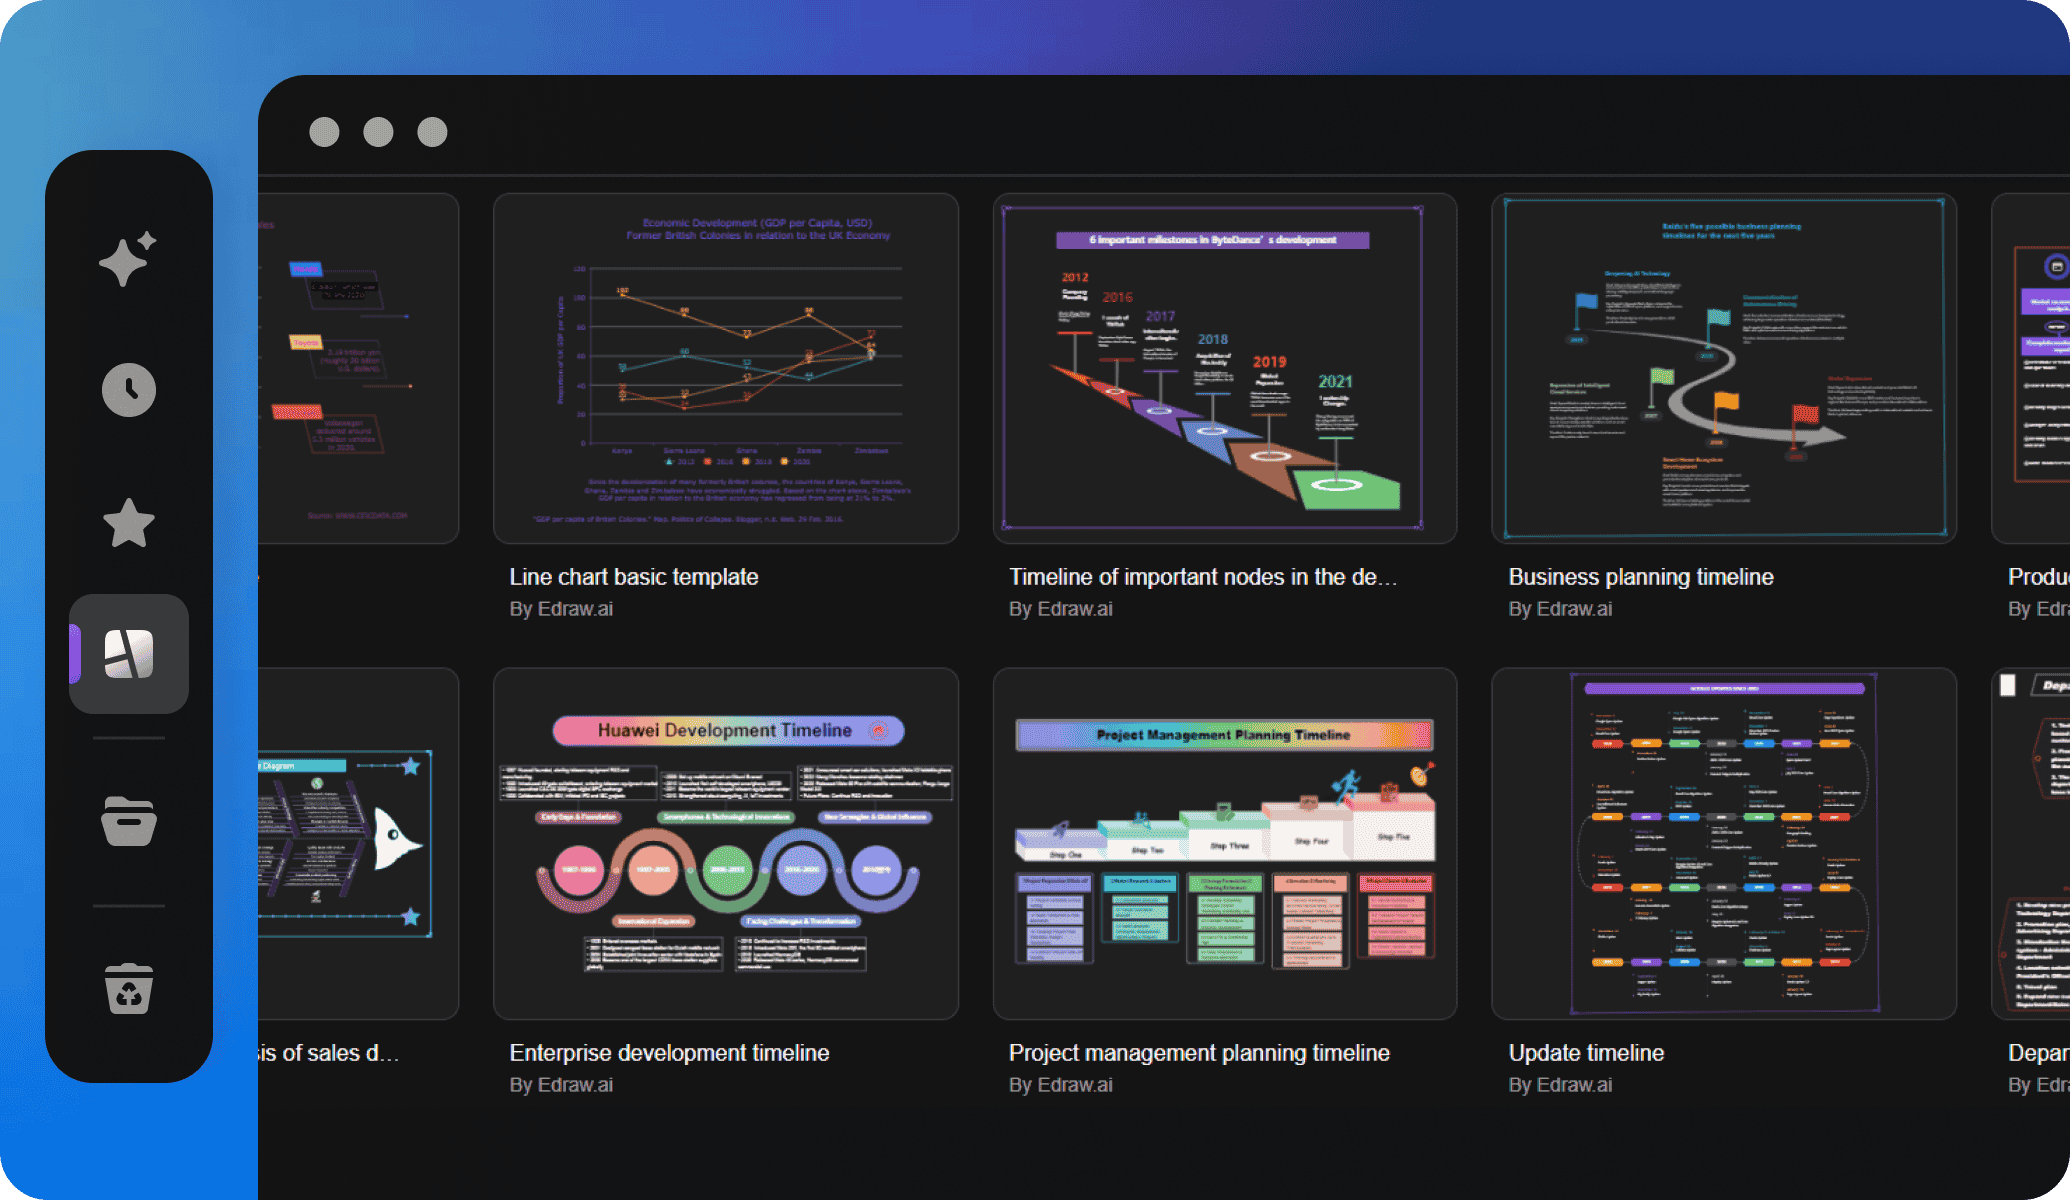
Ready-to-edit templates for all
Creating a line chart takes time, but Edraw.AI speeds it up. With pre-designed templates, all you need is your data to create a line chart. Pick a template, import data, customize the graphics, and you’ll have a professional line chart ready in minutes.
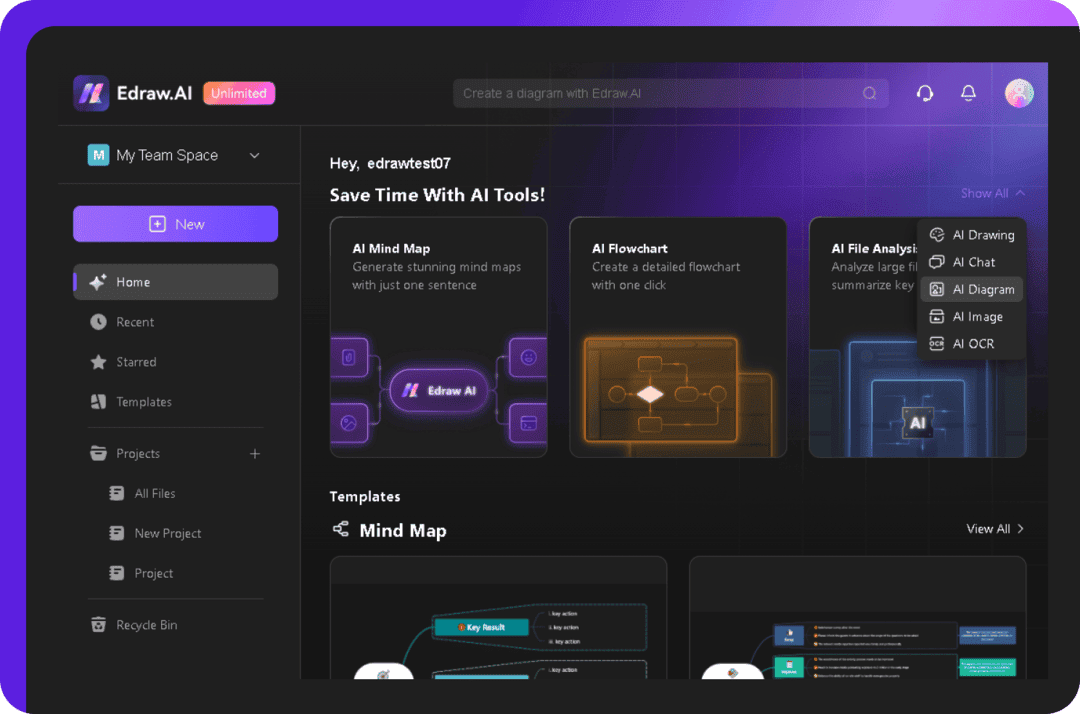
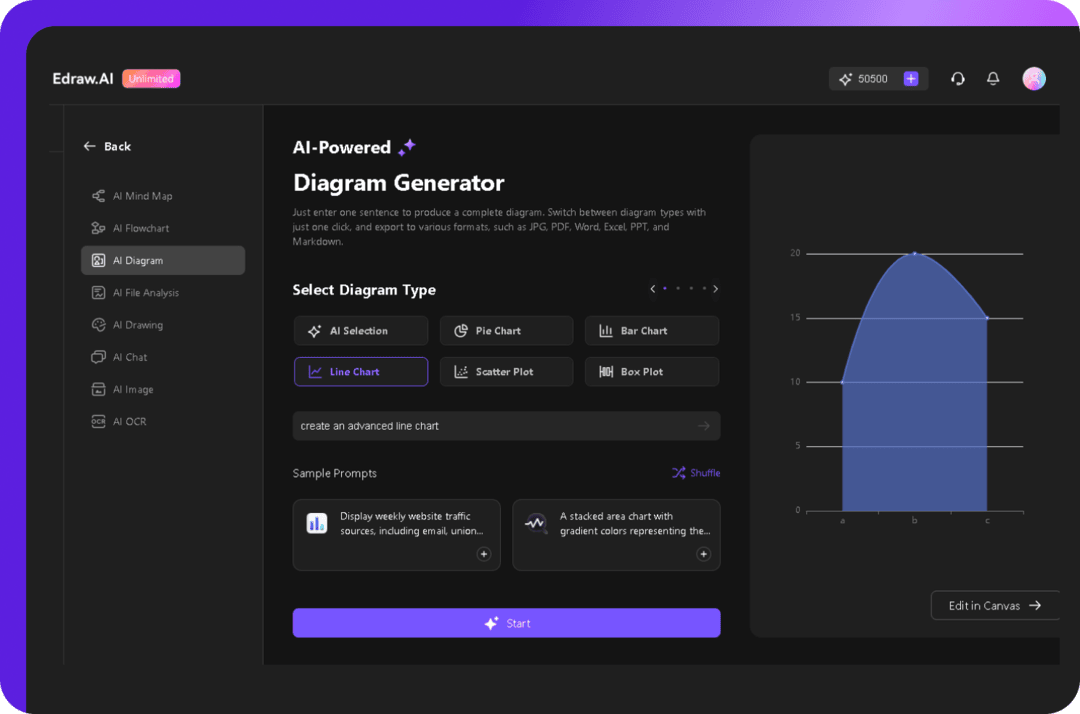
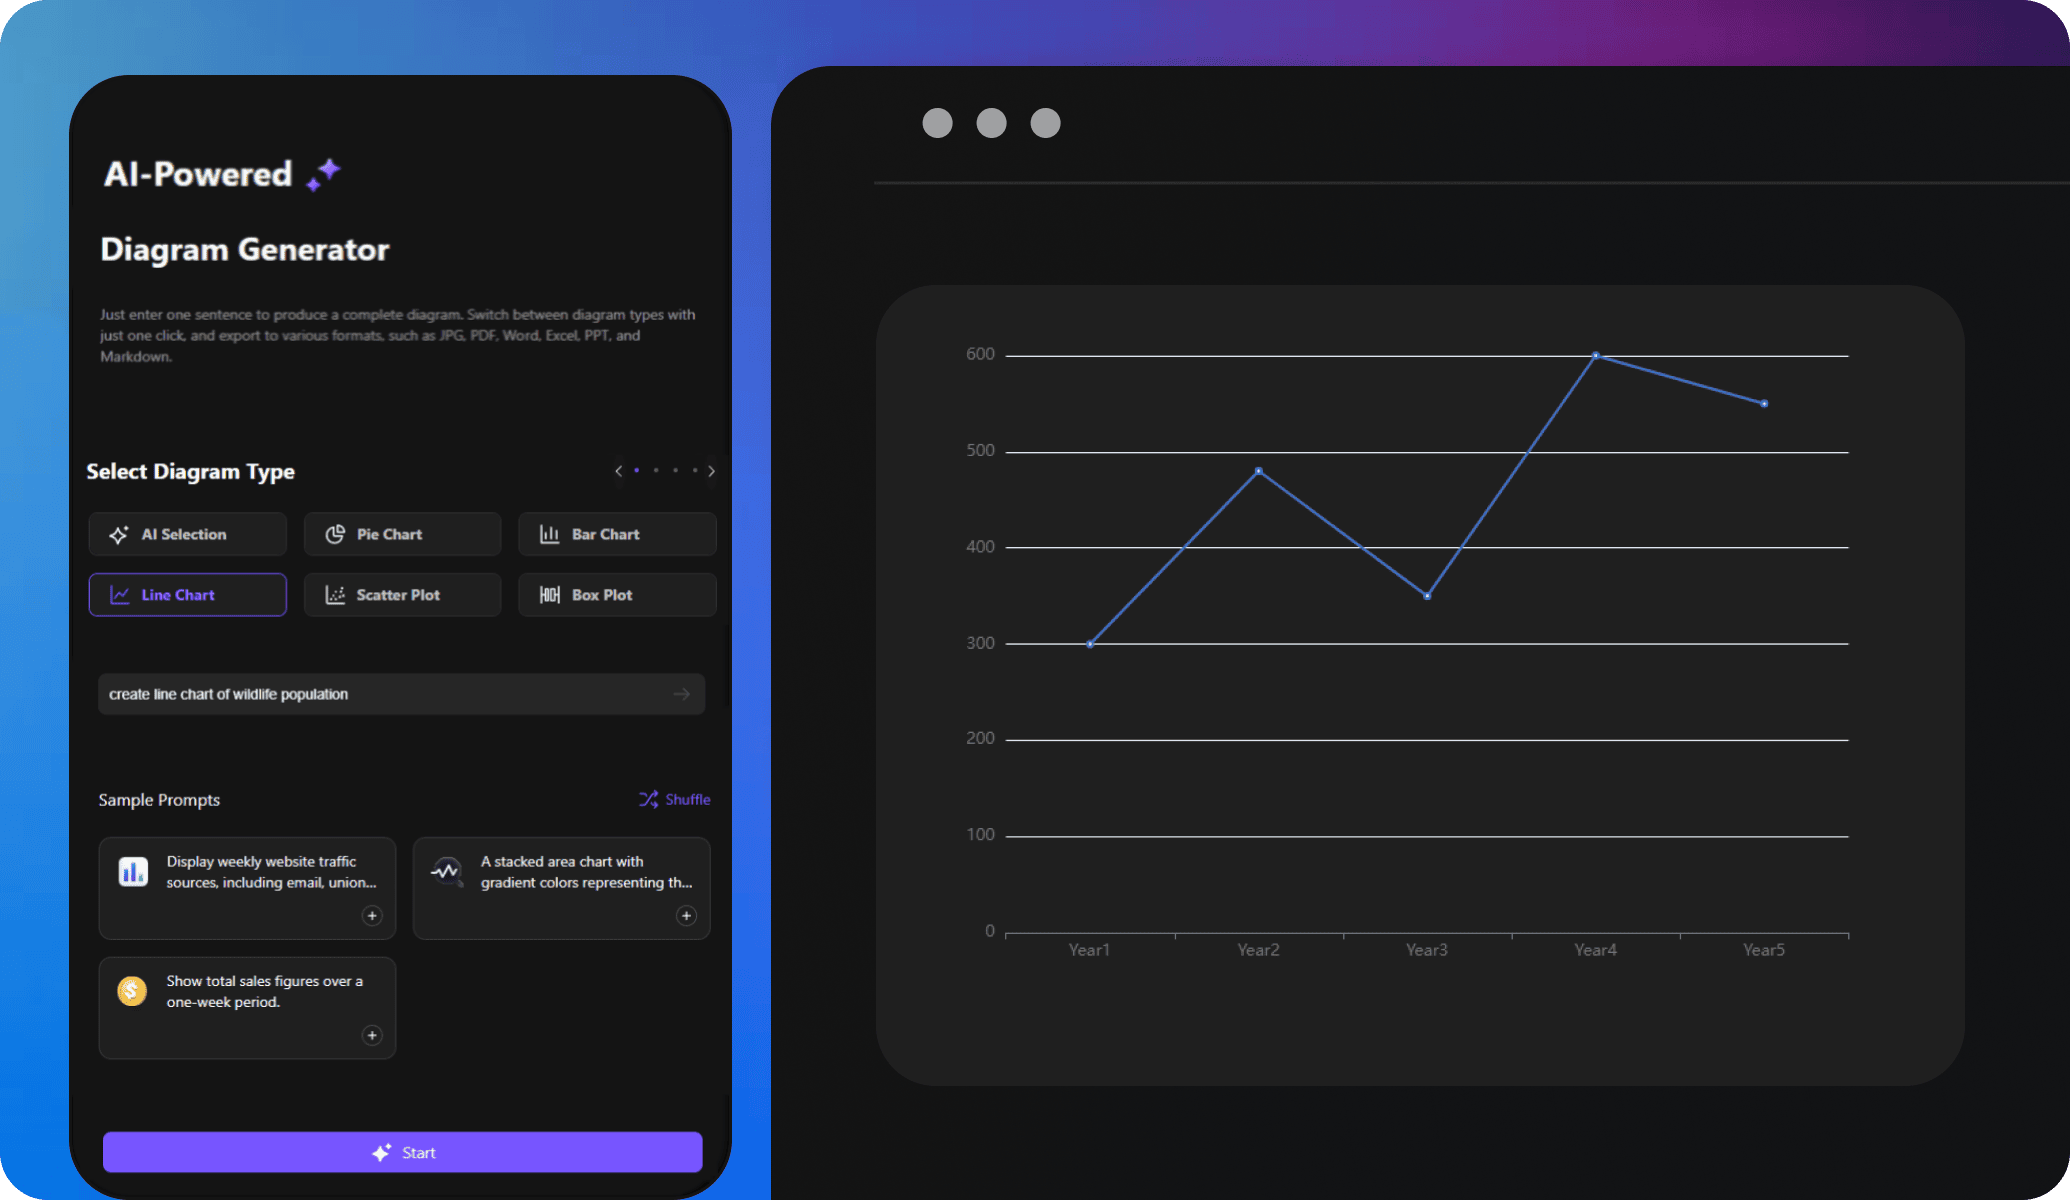
AI diagram generation with a click
Manual chart creation can slow you down. With Edraw.AI, just upload your data or enter a prompt, and it creates a professional chart in seconds. And the best part is that you can customize your line chart to make it interact with the audience.
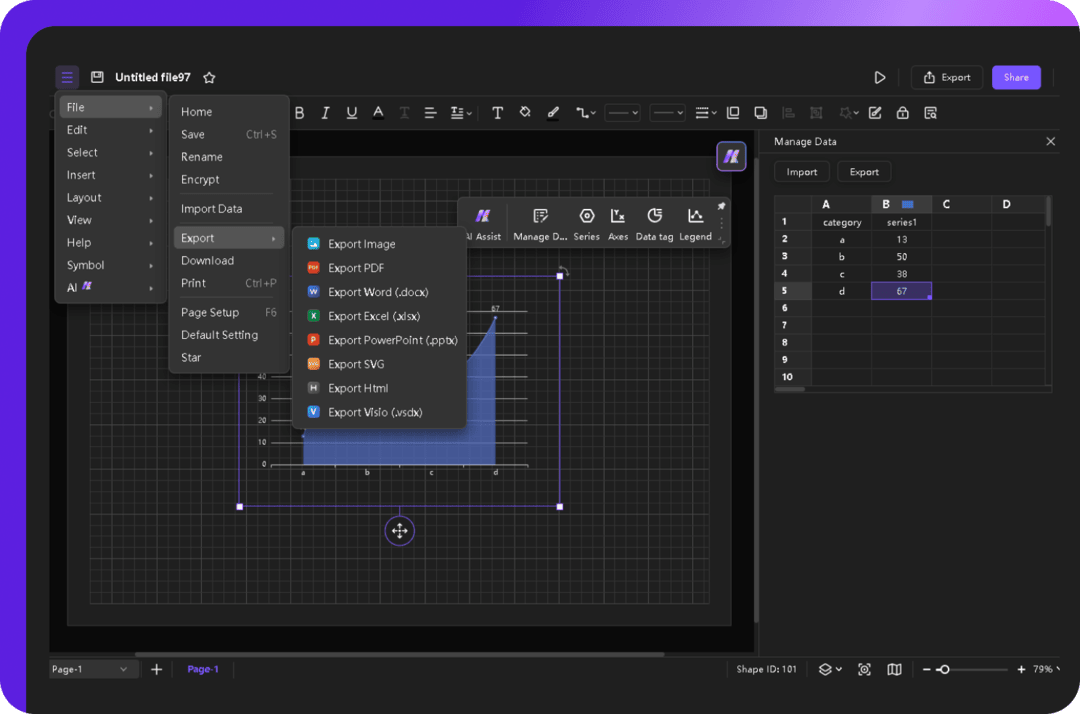
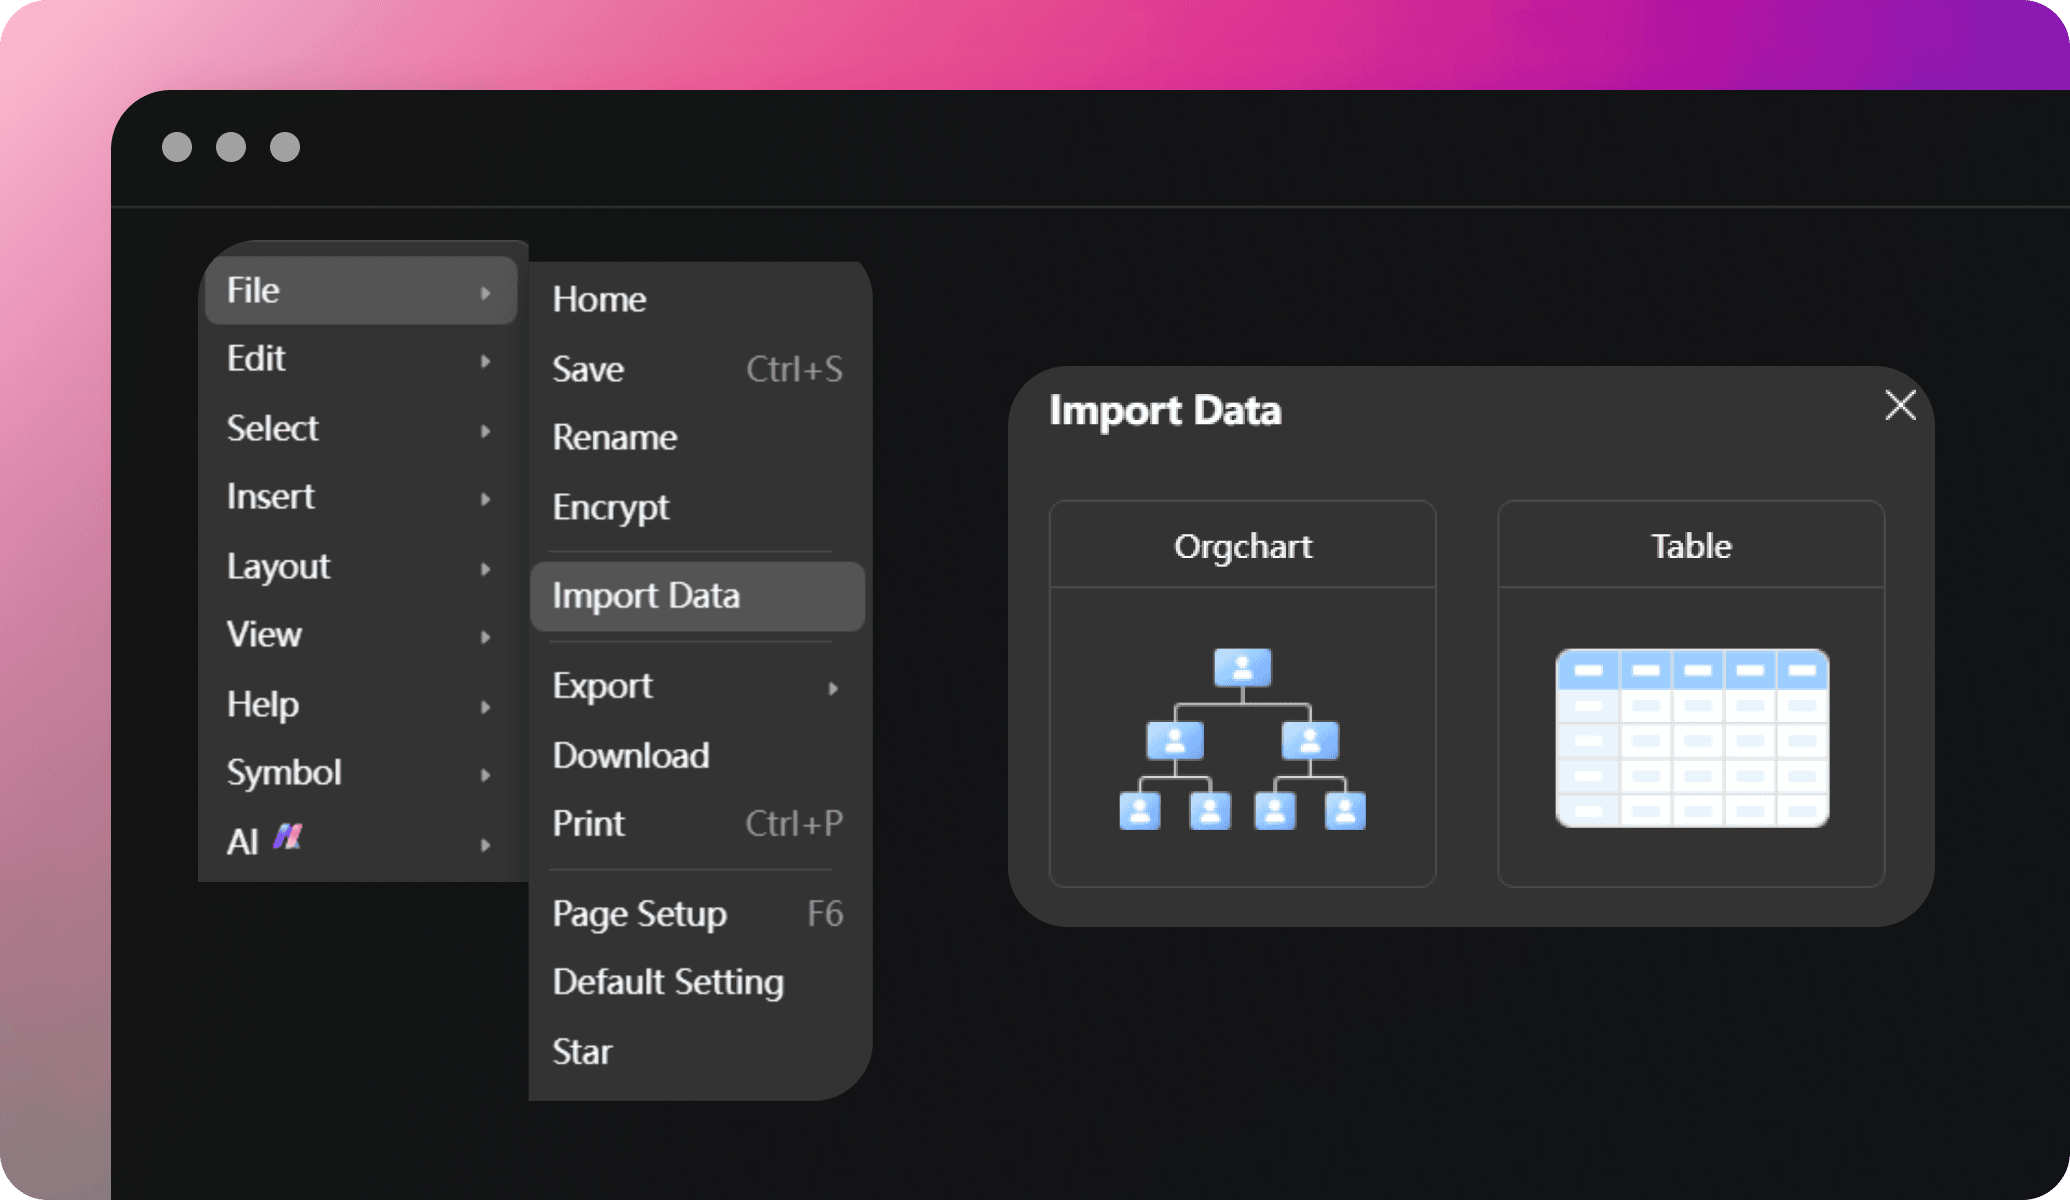
Import data to create a line chart
Edraw.AI makes manual data entry a thing of the past. Upload your Excel files, and the tool quickly organizes them into an eye-catching line chart. Customize your chart’s look and analyze your data: all in just a few simple steps.
Ideal tool for collaboration

Efficiency Boost
With multi-device support and access on the cloud, team members can access and edit files anytime, reducing repetitive tasks and significantly improving efficiency.

All-in-one Solution
Edraw.AI supports over 210 drawing types, from mind maps to flowcharts. This extensive range allows teams to create diverse visual content within a single platform.

Enhanced Communication
Visual diagrams simplify complex ideas, improving communication within teams and with external partners, making discussions and decision-making more efficient and clear.

Seamless Collaboration
It allows team members to co-edit and share diagrams in real-time, ensuring smooth workflow without the need for constant tool switching or delays.
How to make a line chart with Edraw.AI?