Online AI pie chart maker; import, visualize, and present!
Easy-to-edit pie charts
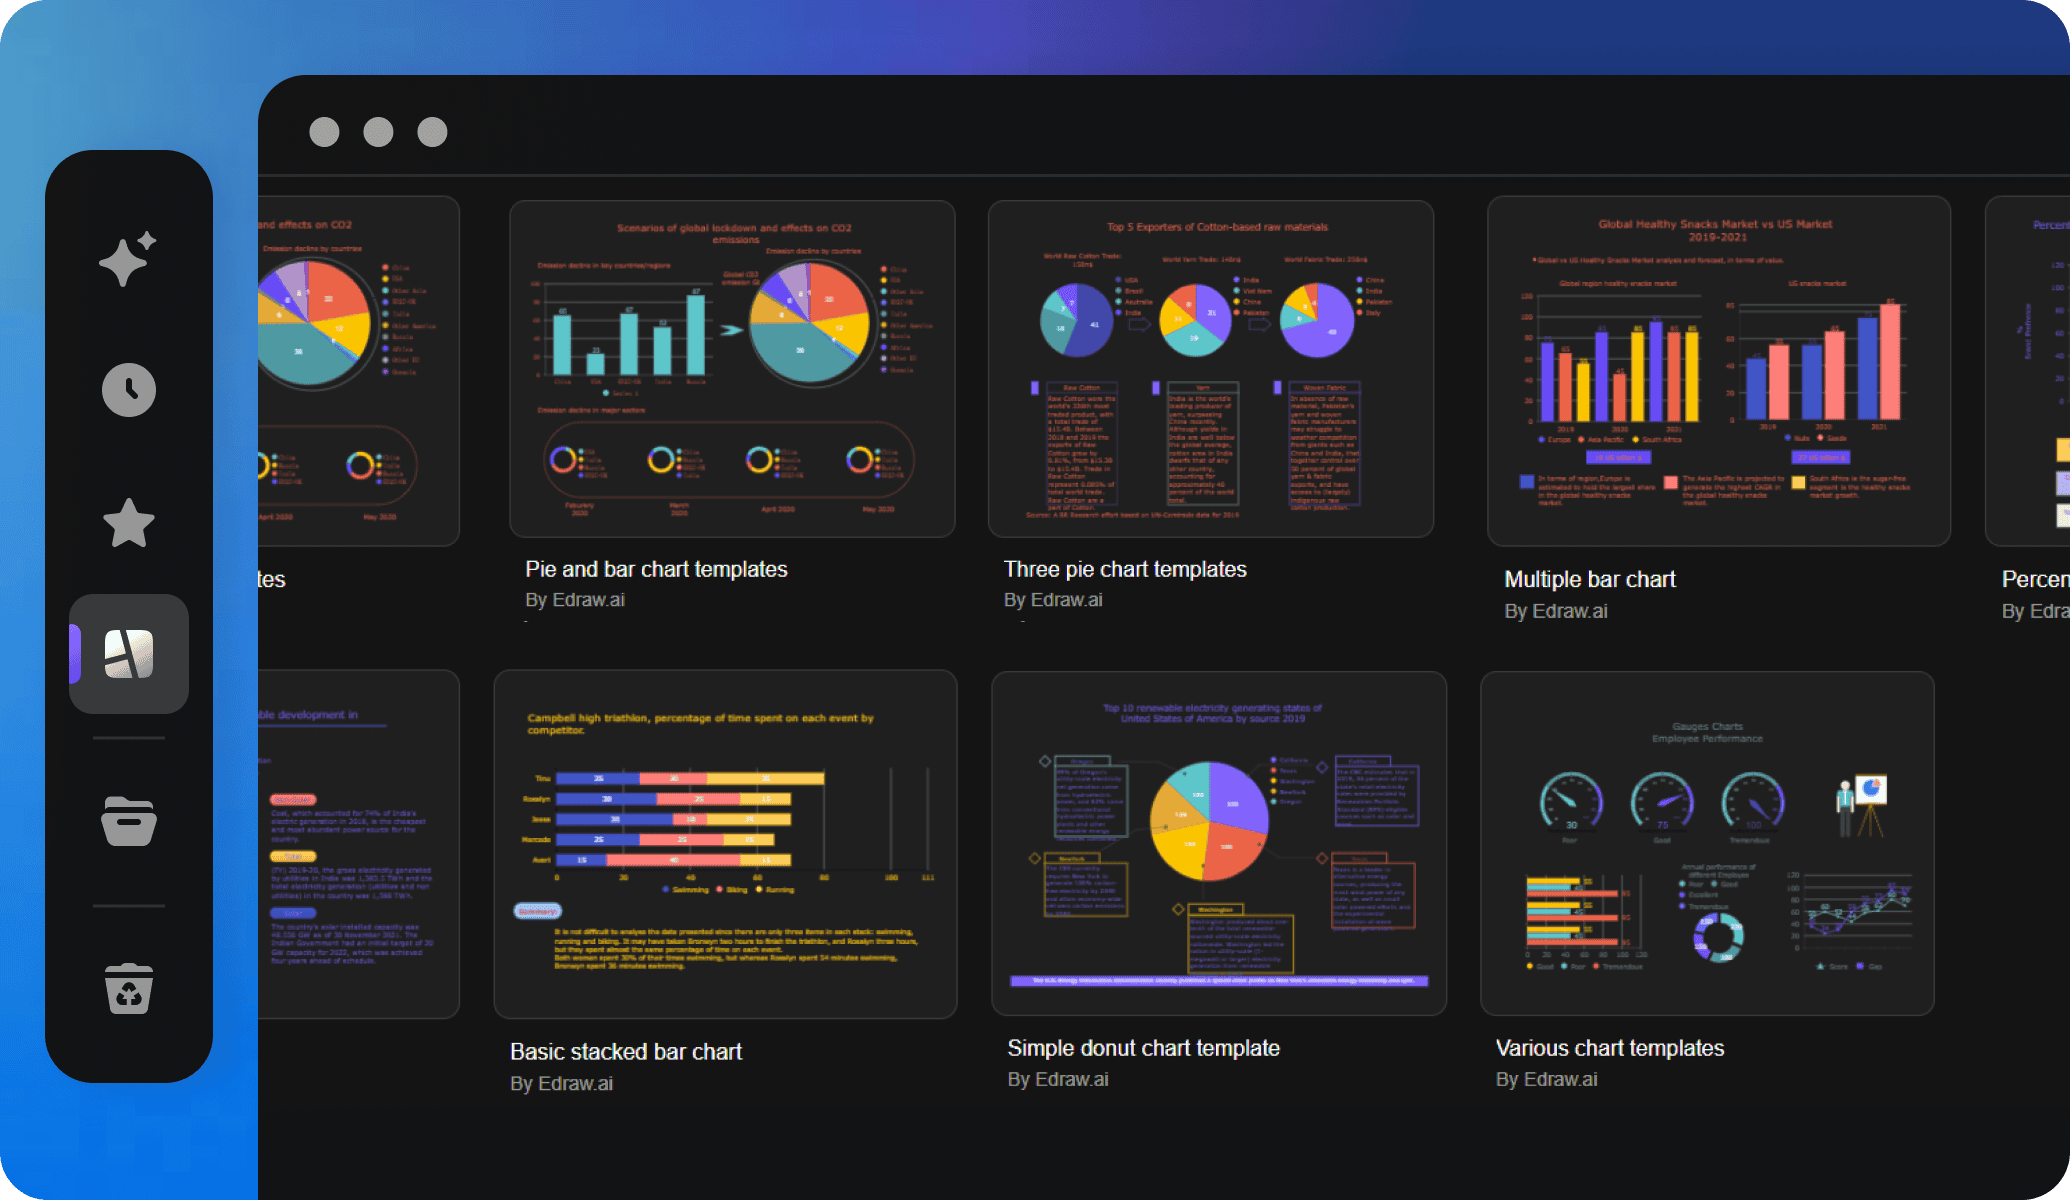
Our online pie chart maker has ready-made templates designed to help you visualize big datasets. From simple divisions to complex distributions, choose the perfect template and customize it to create a chart that communicates your statistics clearly.
AI-powered pie chart creation
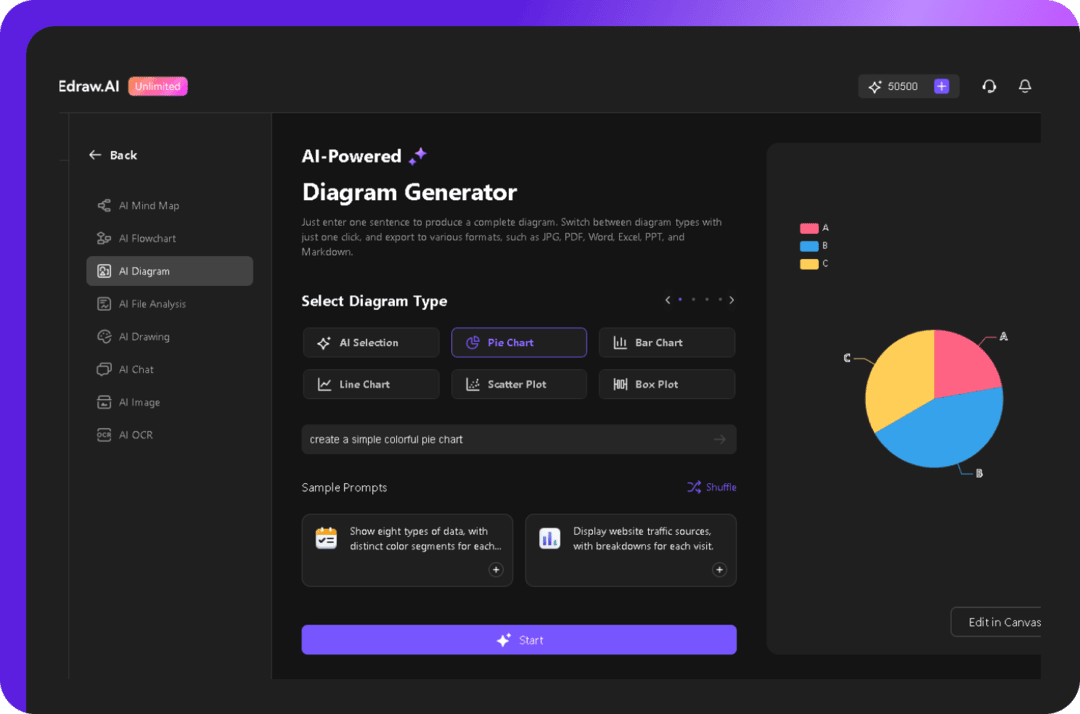
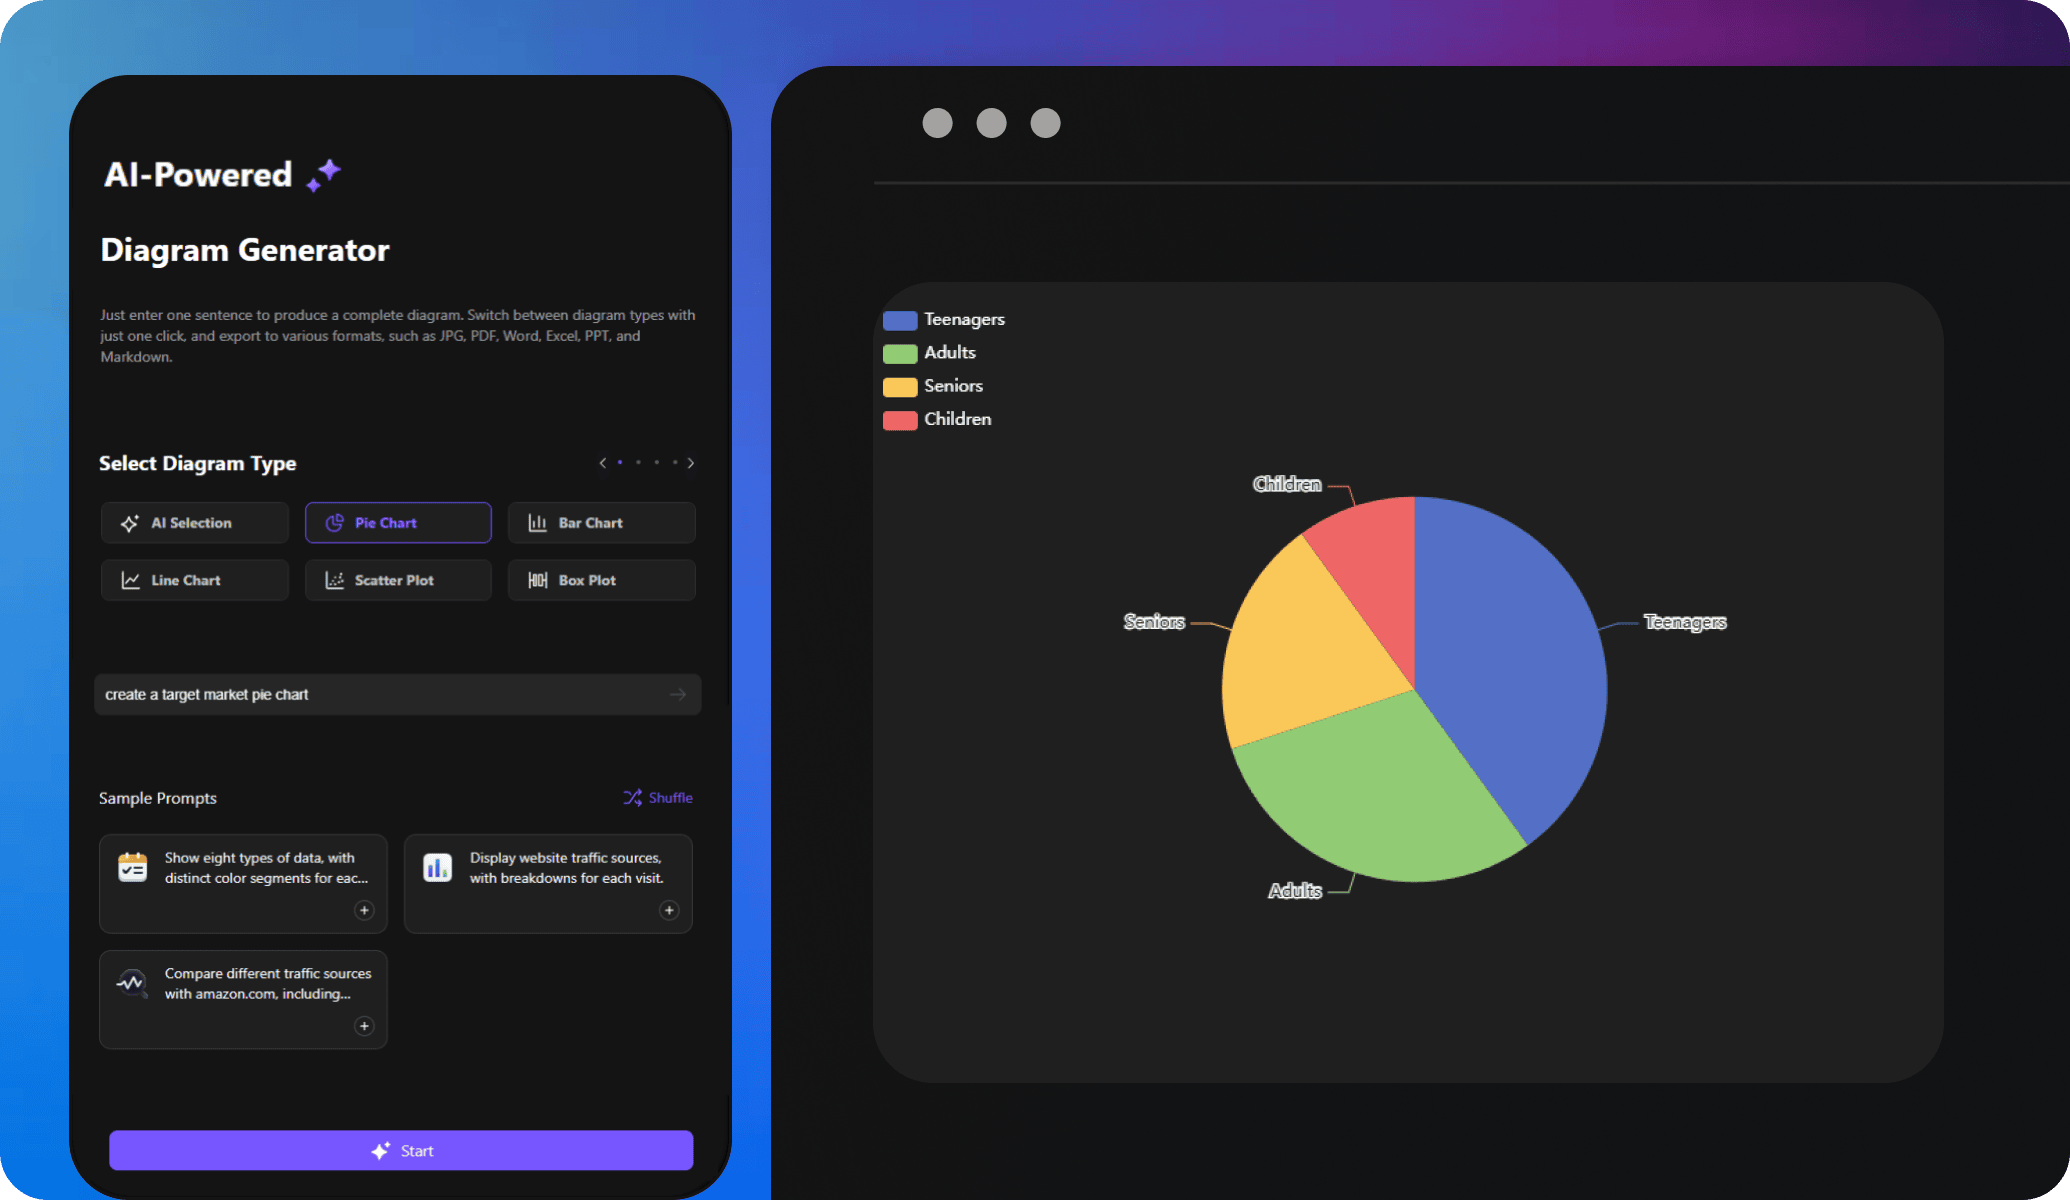
No need to calculate percentages or manually adjust the data! Edraw.AI automatically generates charts from your data in seconds. Enter your prompt or upload your information, and the AI will process it to create a clear, and accurate pie chart in seconds.
Import data to create a pie chart
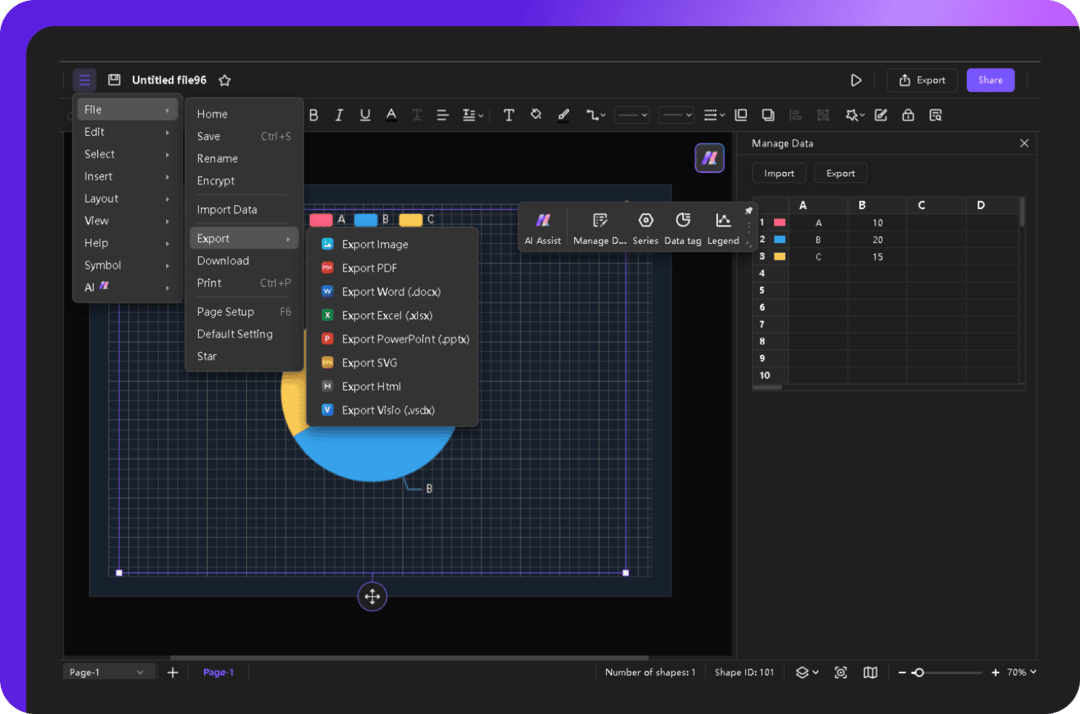
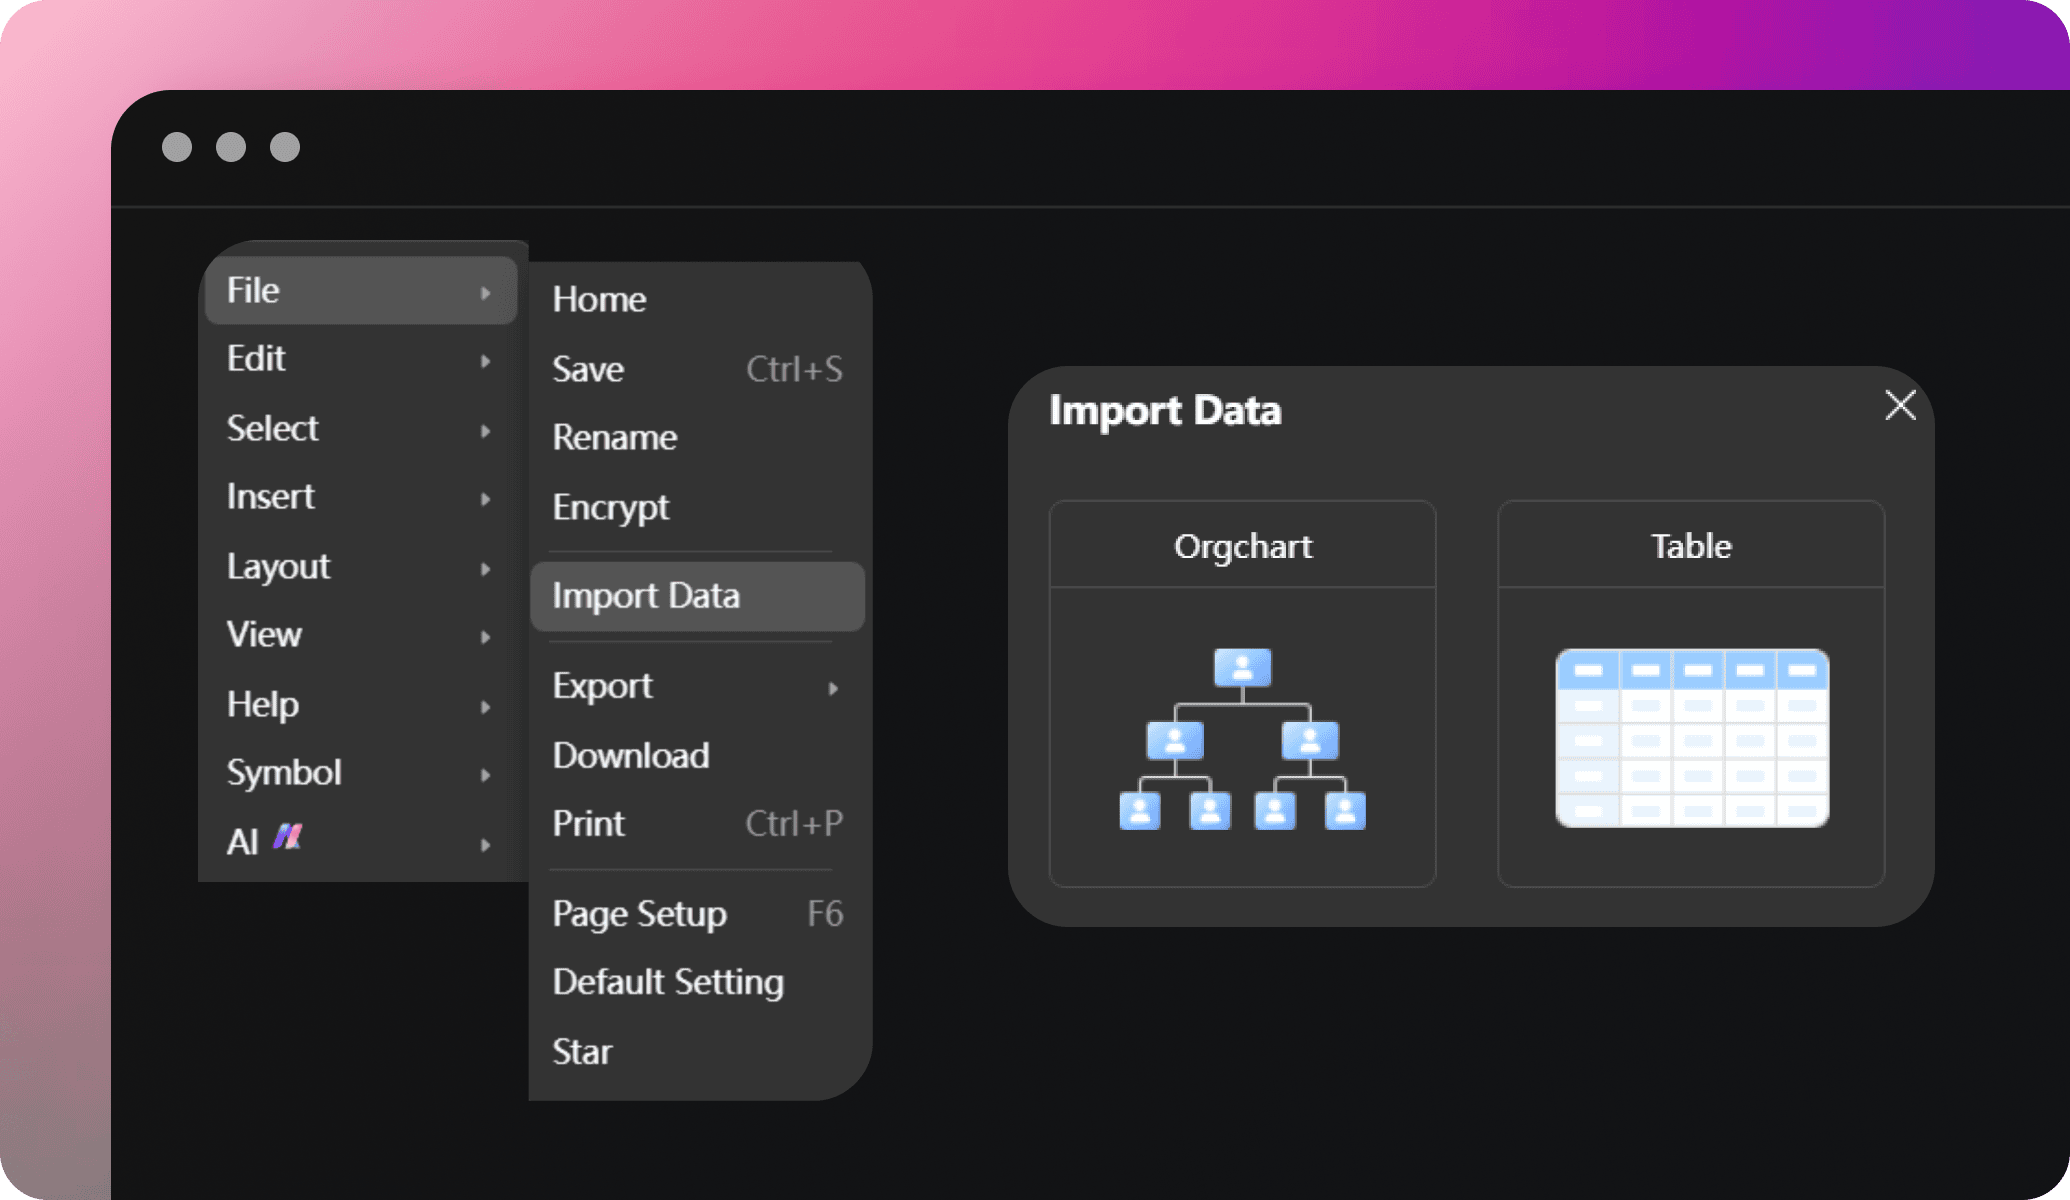
Don’t have time to enter data in the pie chart? No worries! Import your data directly into Edraw.AI canvas and quickly turn your numbers into a clear pie chart. Customize colors, add labels, and analyze sections of your data; all with a few clicks.
Ideal tool for collaboration

Efficiency Boost
With multi-device support and access on the cloud, team members can access and edit files anytime, reducing repetitive tasks and significantly improving efficiency.

All-in-one Solution
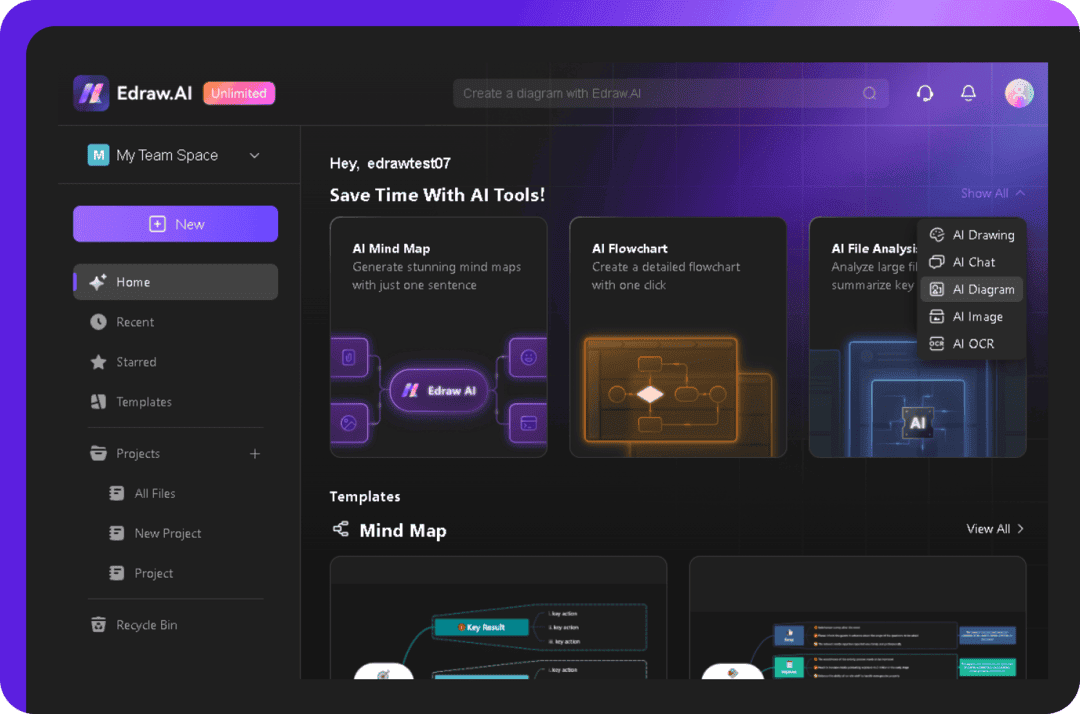
Edraw.AI supports over 210 drawing types, from mind maps to flowcharts. This extensive range allows teams to create diverse visual content within a single platform.

Enhanced Communication
Visual diagrams simplify complex ideas, improving communication within teams and with external partners, making discussions and decision-making more efficient and clear.

Seamless Collaboration
It allows team members to co-edit and share diagrams in real-time, ensuring smooth workflow without the need for constant tool switching or delays.
