Data visualization has never been easier!
Intuitive tools for non-designers
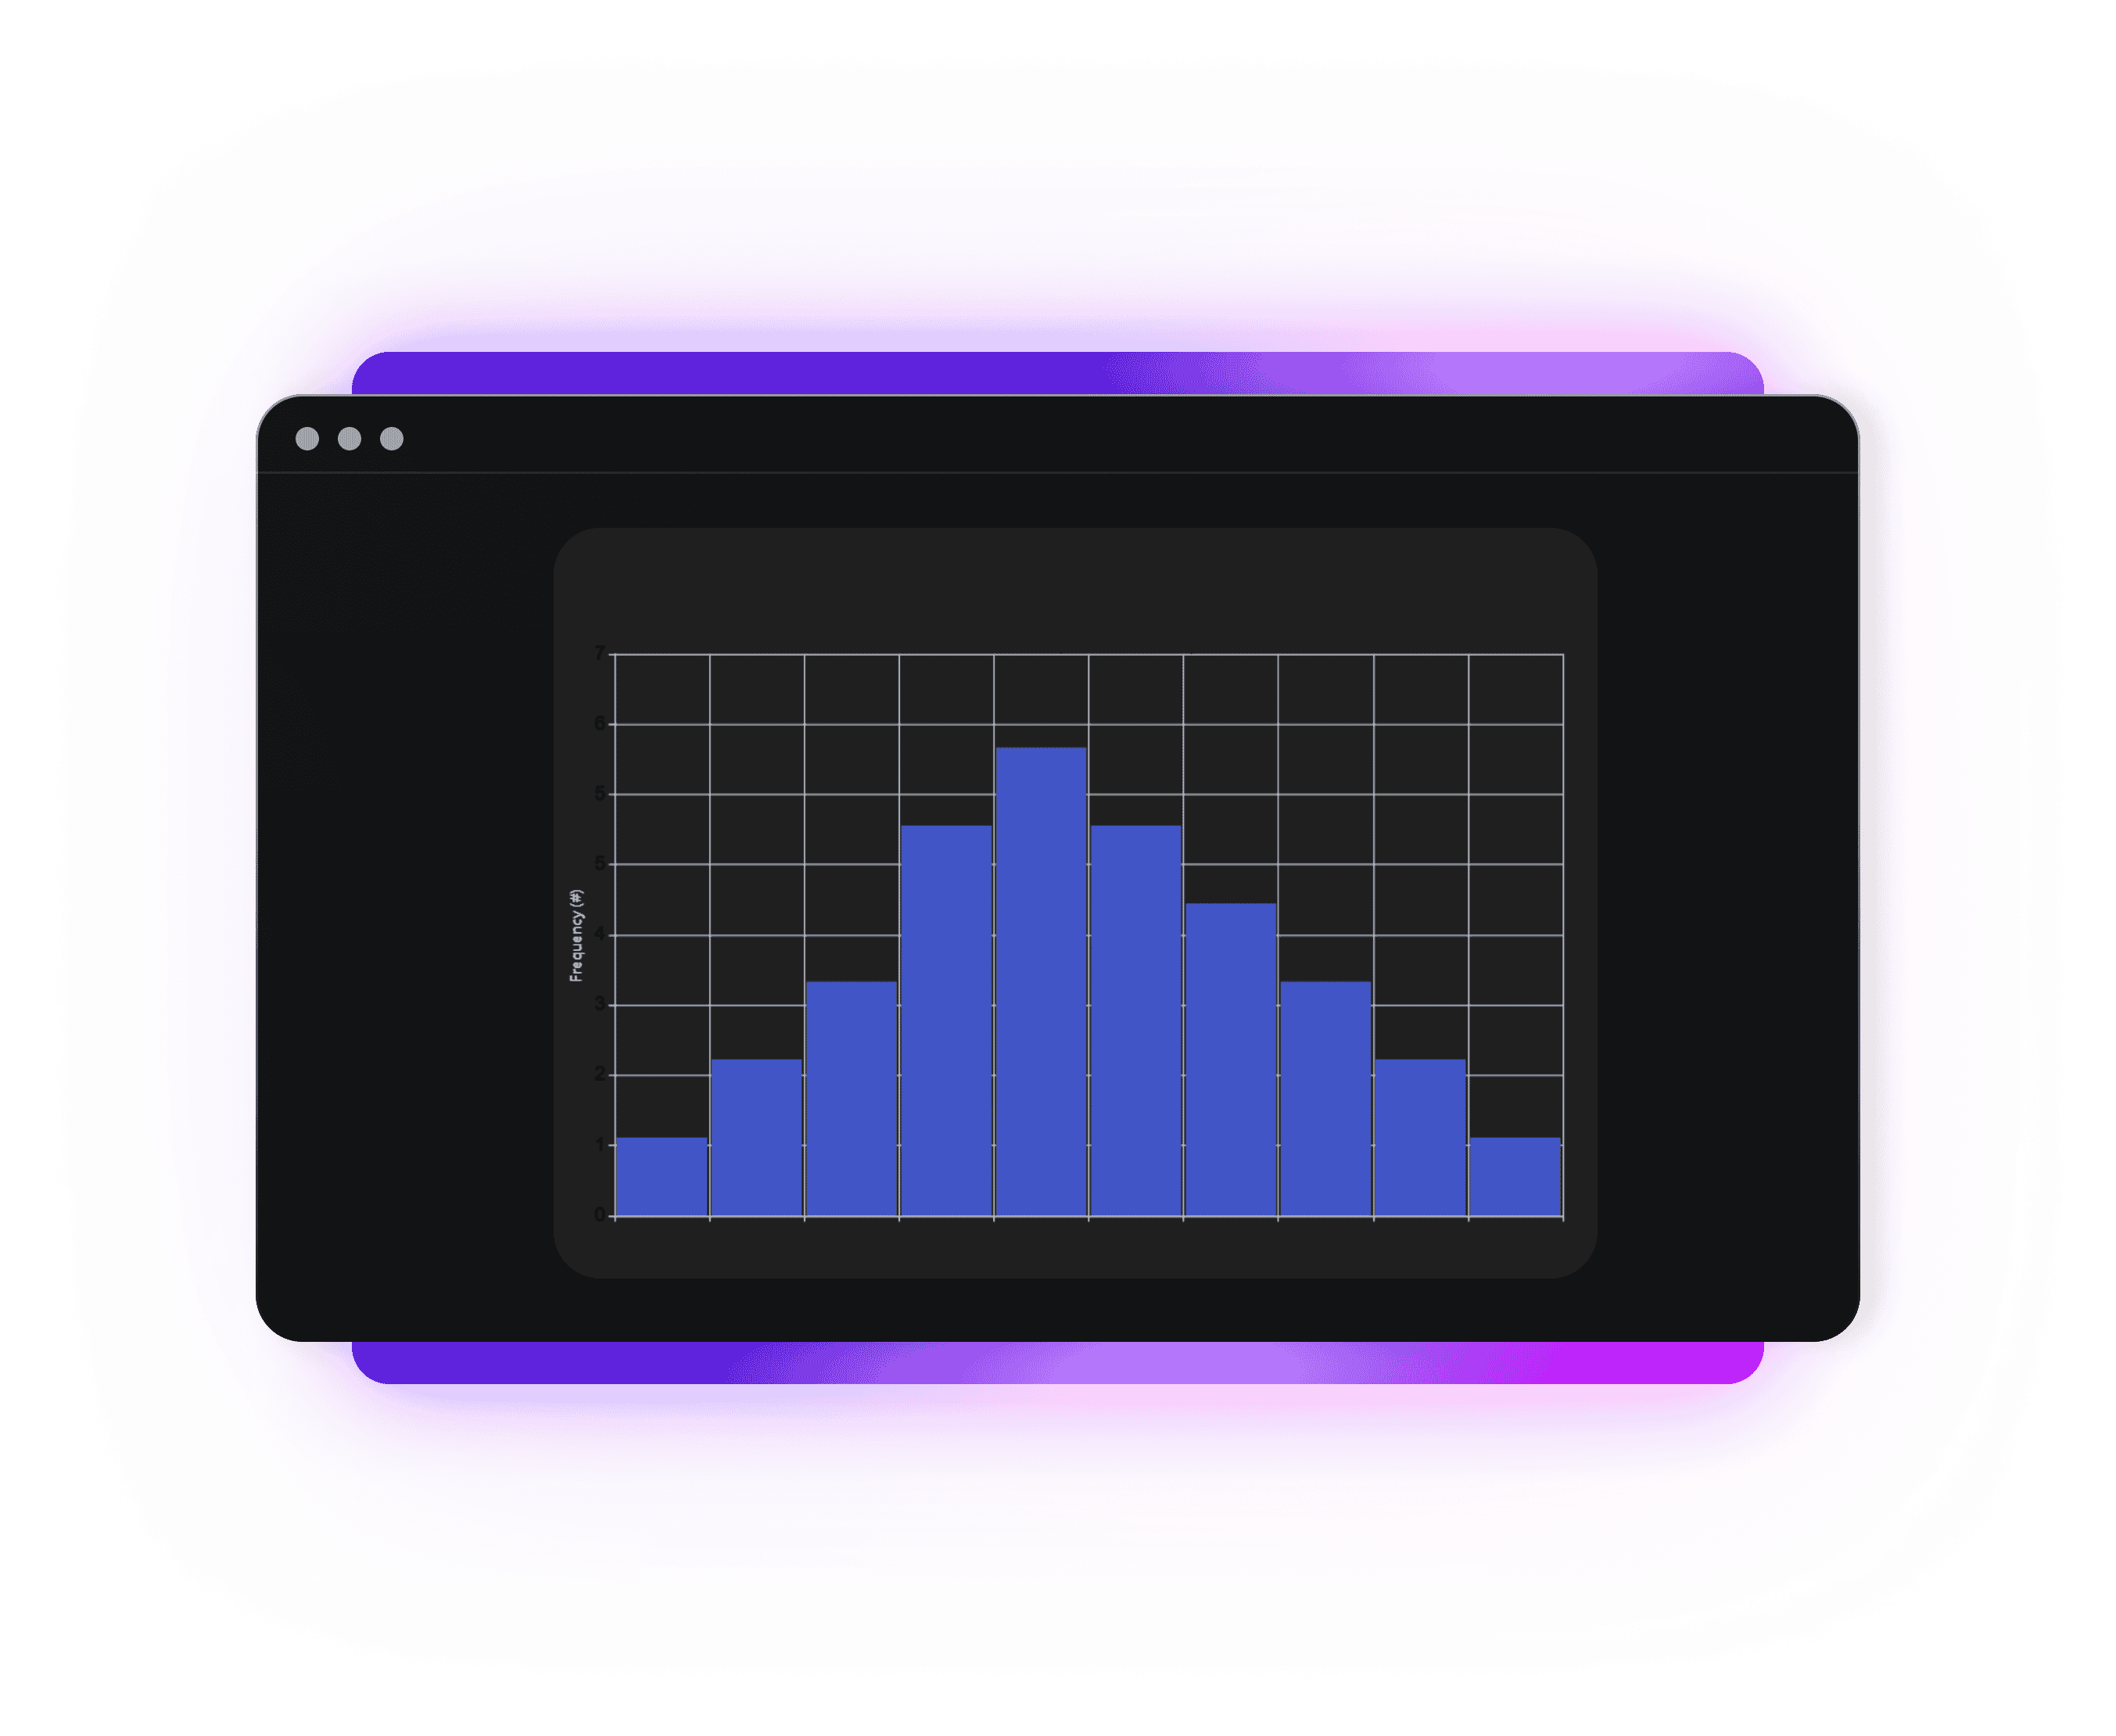
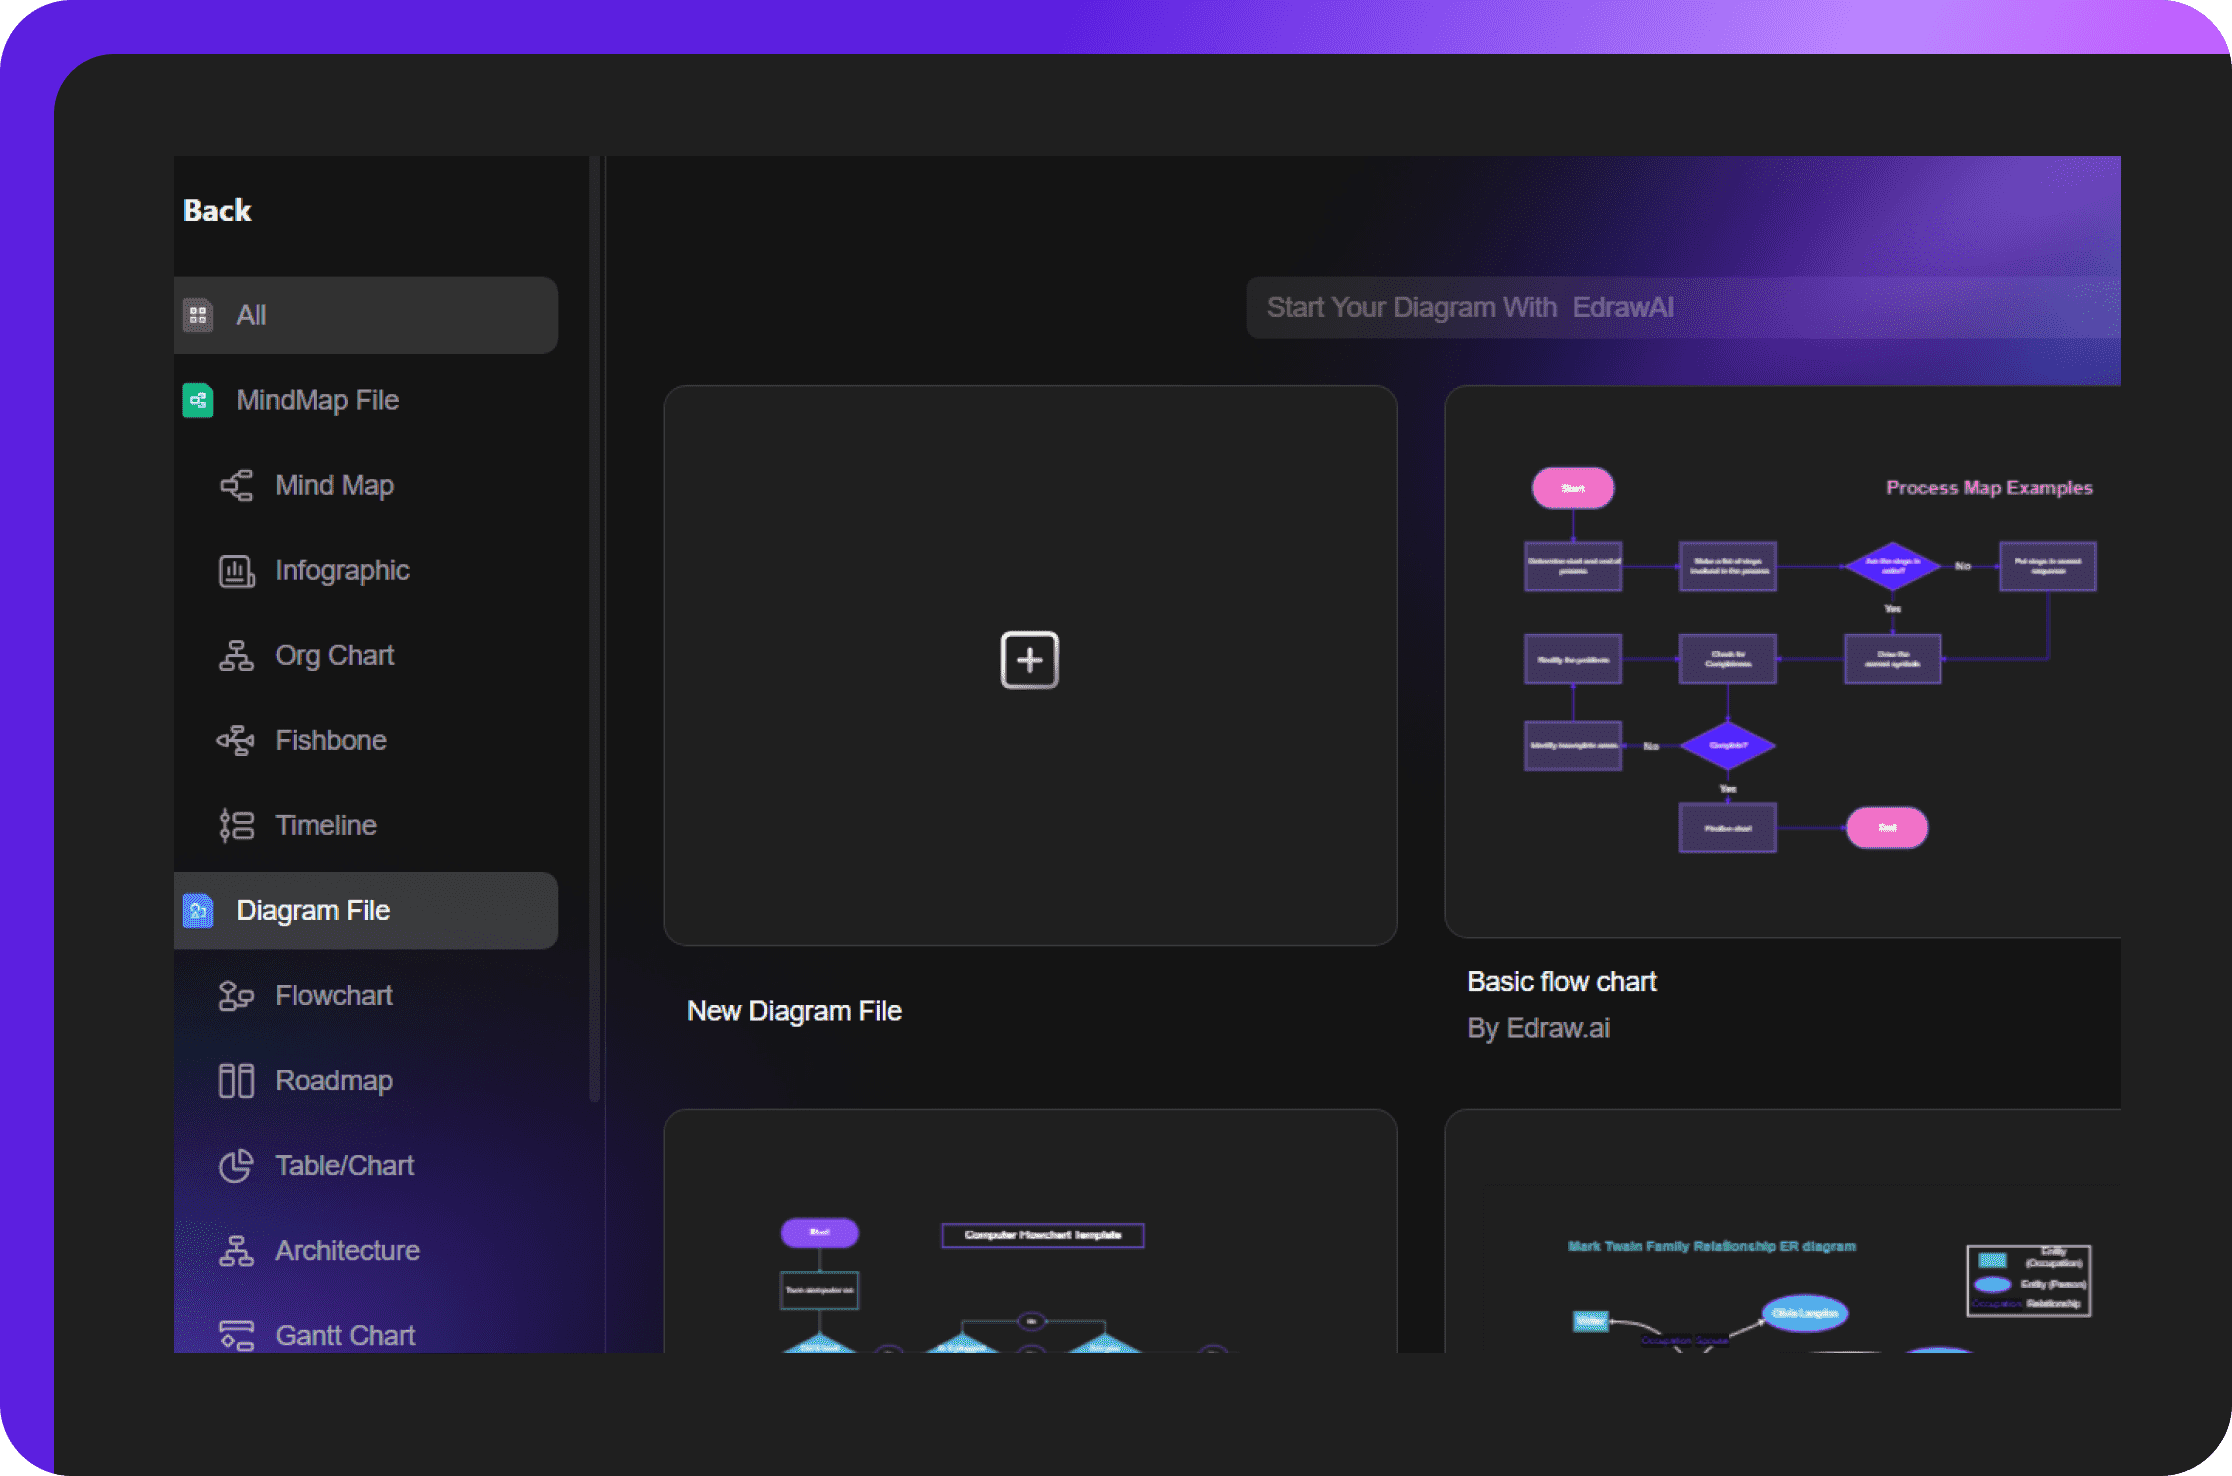
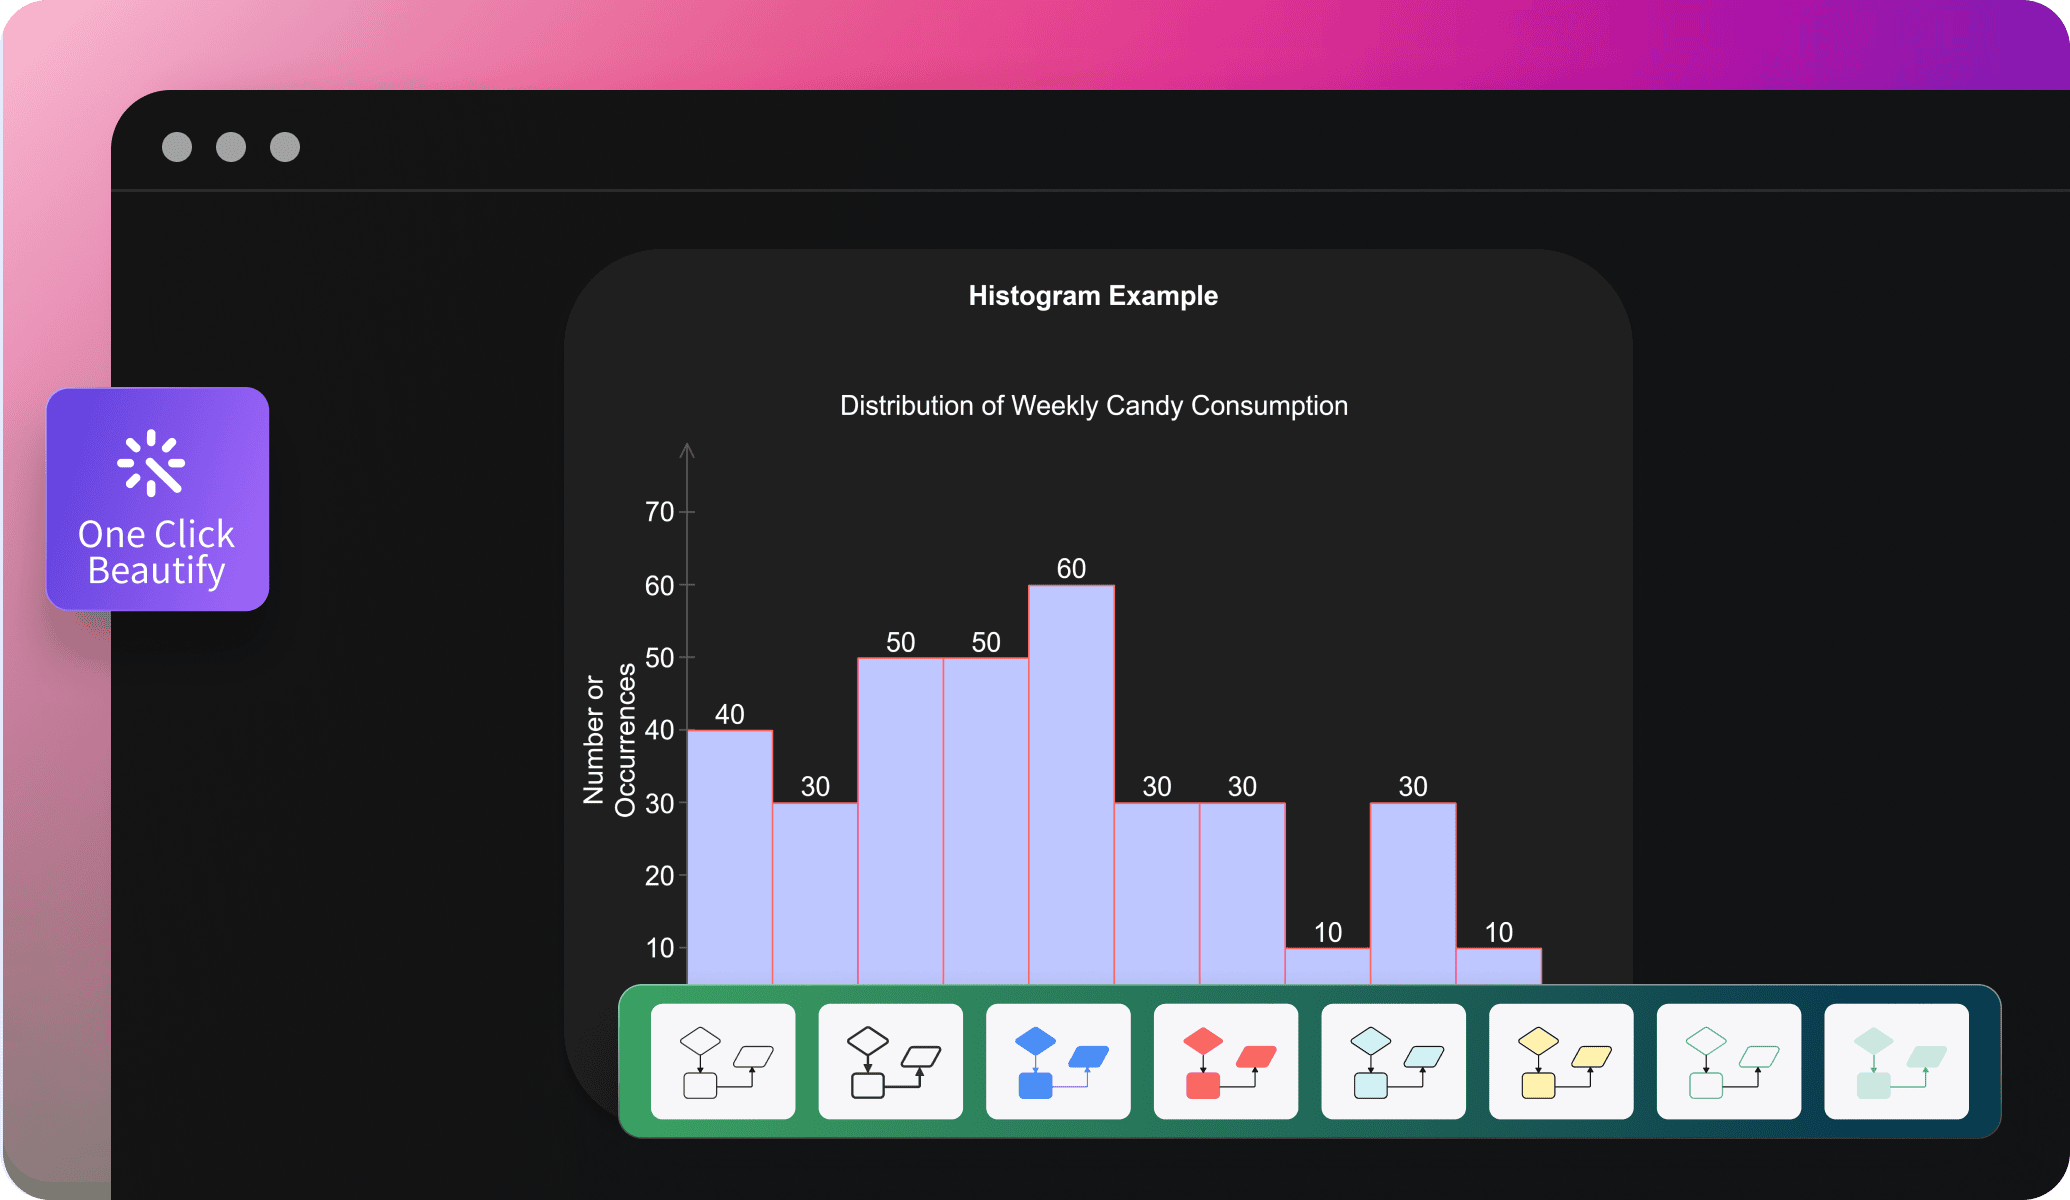
Our easy drag-and-drop tools are developed with non-designers in mind. Access fully-fledged histogram structures from our library, add data legends, and modify information. Have fun with the color schemes and theme of your histogram, and give it a polished look.
Import data from Excel
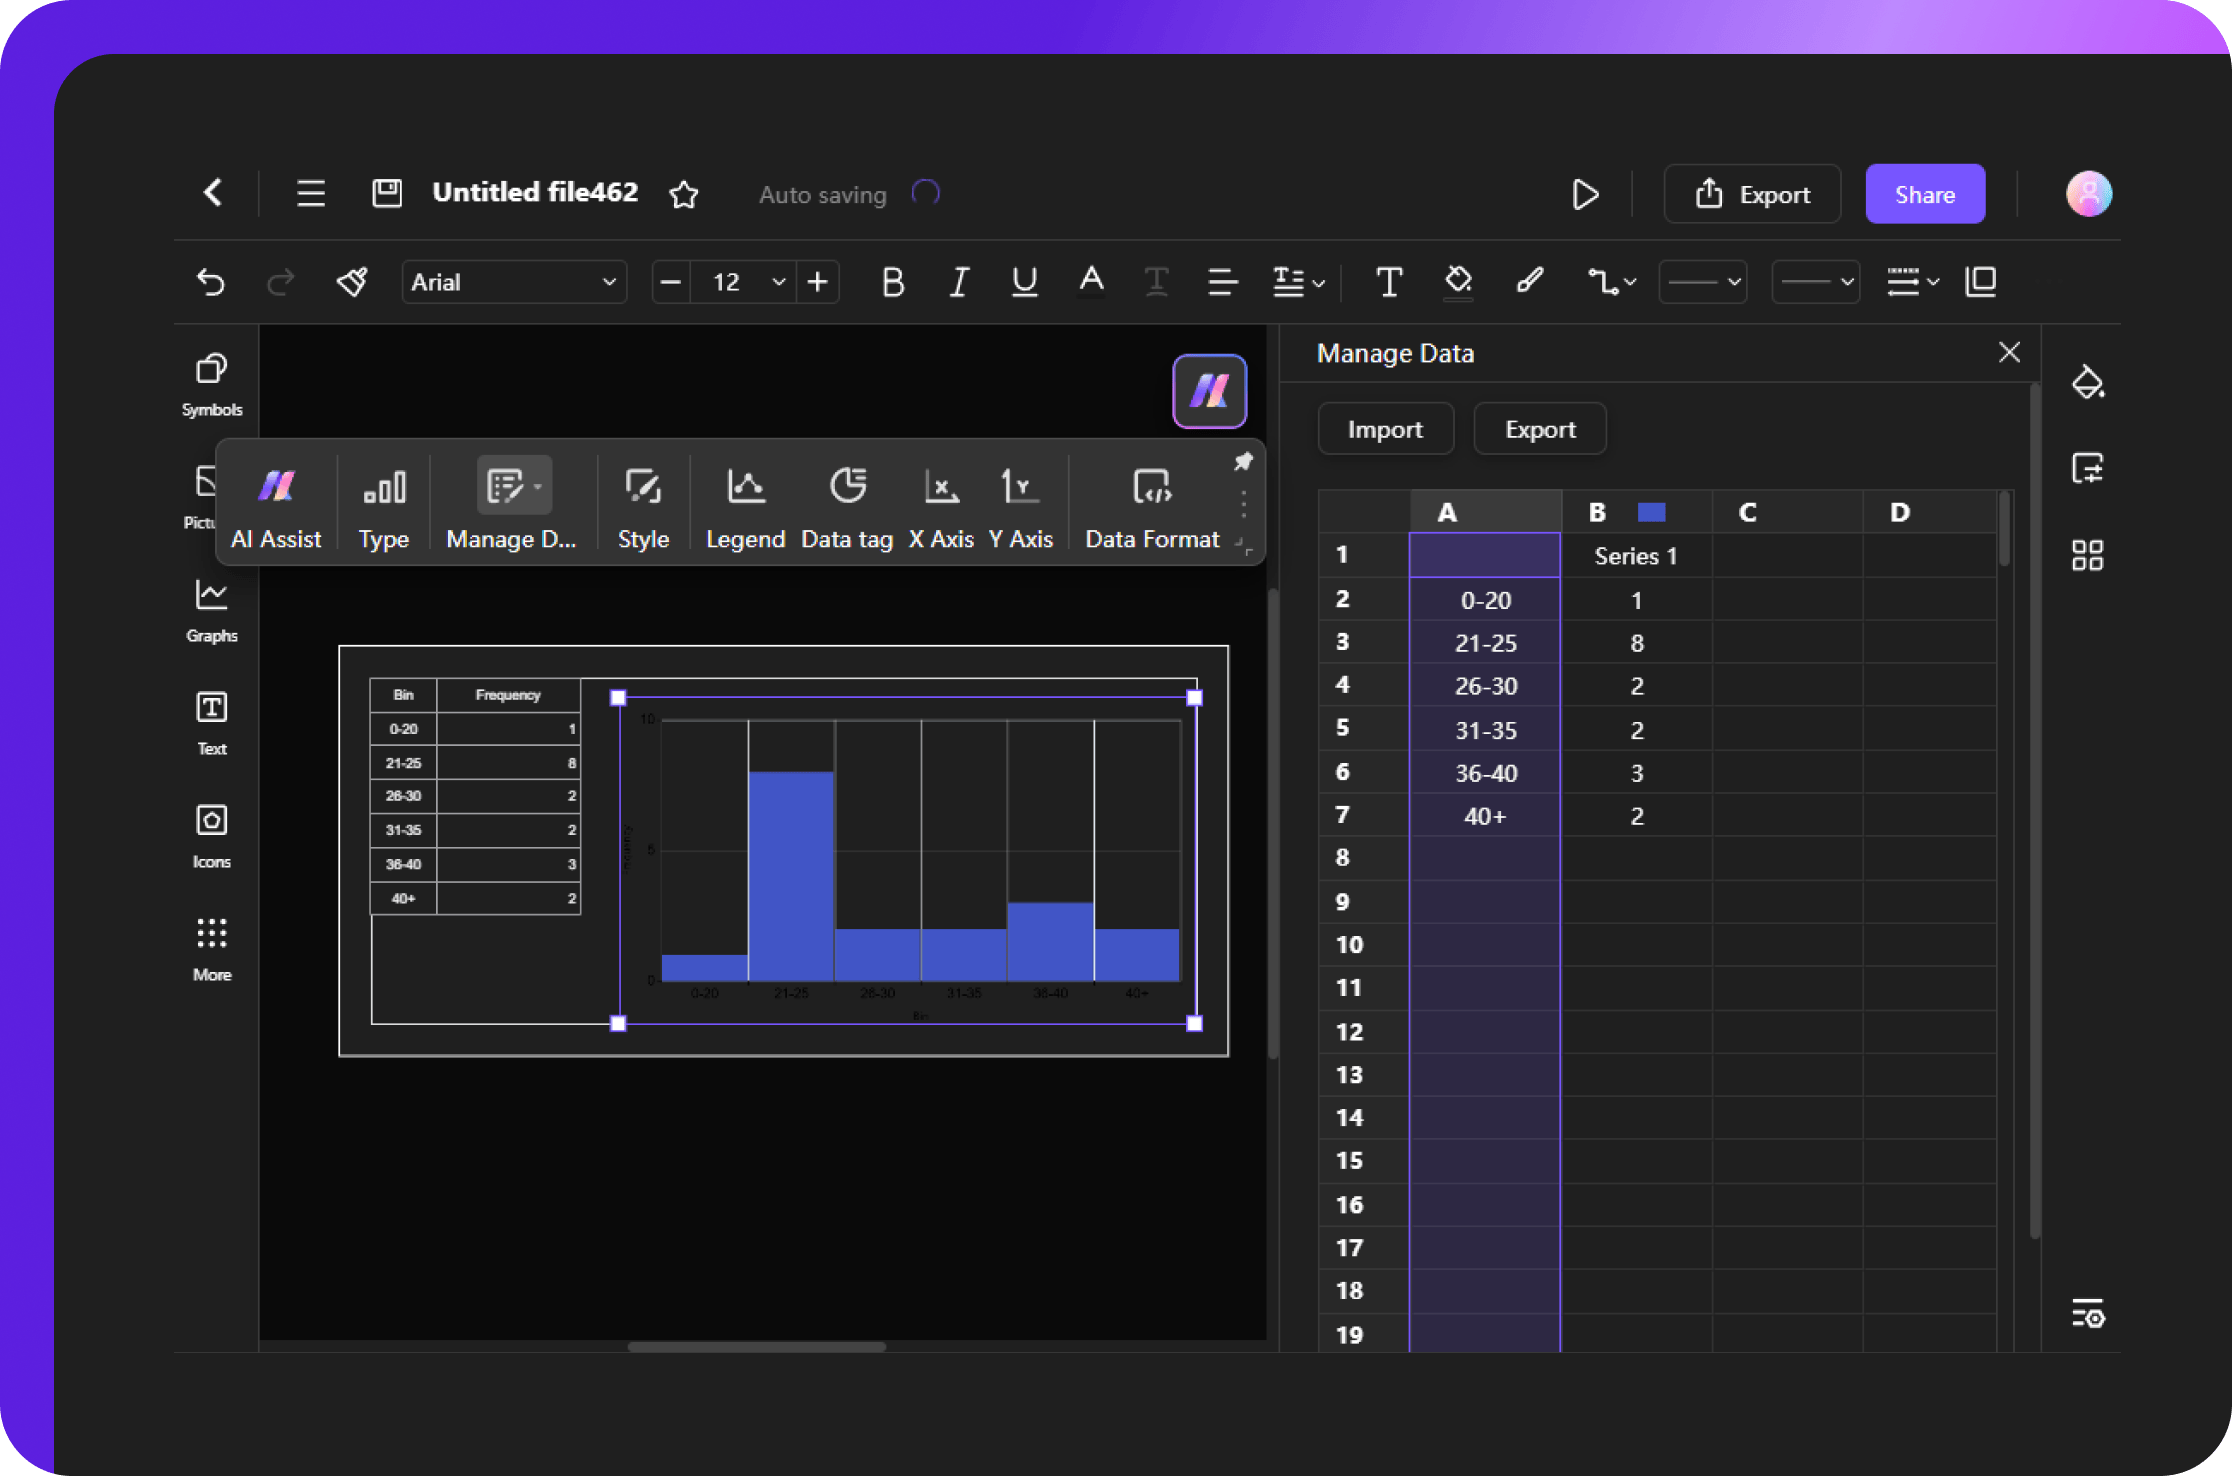
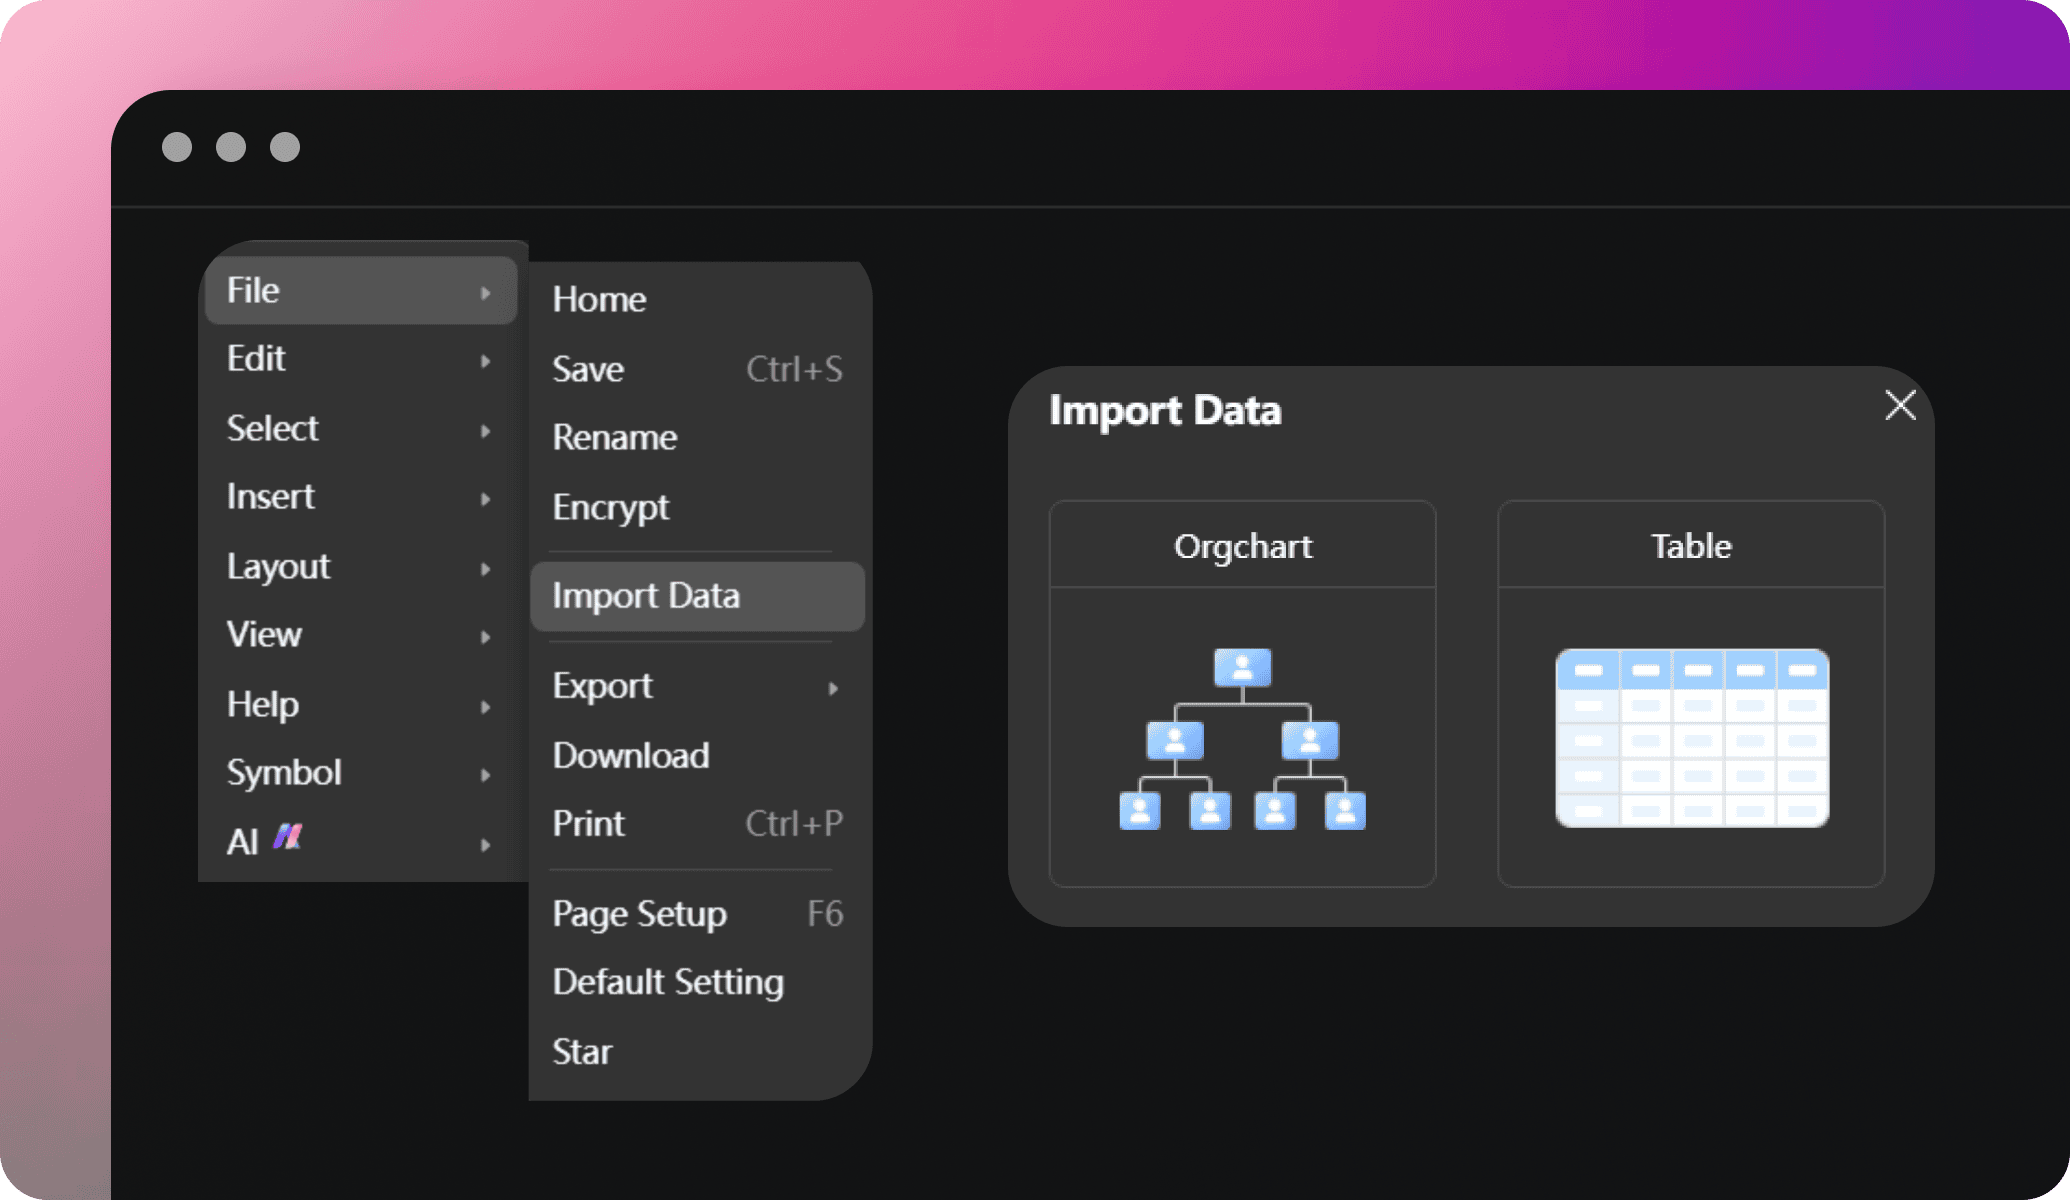
Import spreadsheets to our canvas and say goodbye to hours of manual data entry and errors. Seamlessly upload your gathered data, let the software visualize it in bars, and streamline the creation process. Leverage our AI Assist to analyze and predict trends in your graphs.
Share and download graphs
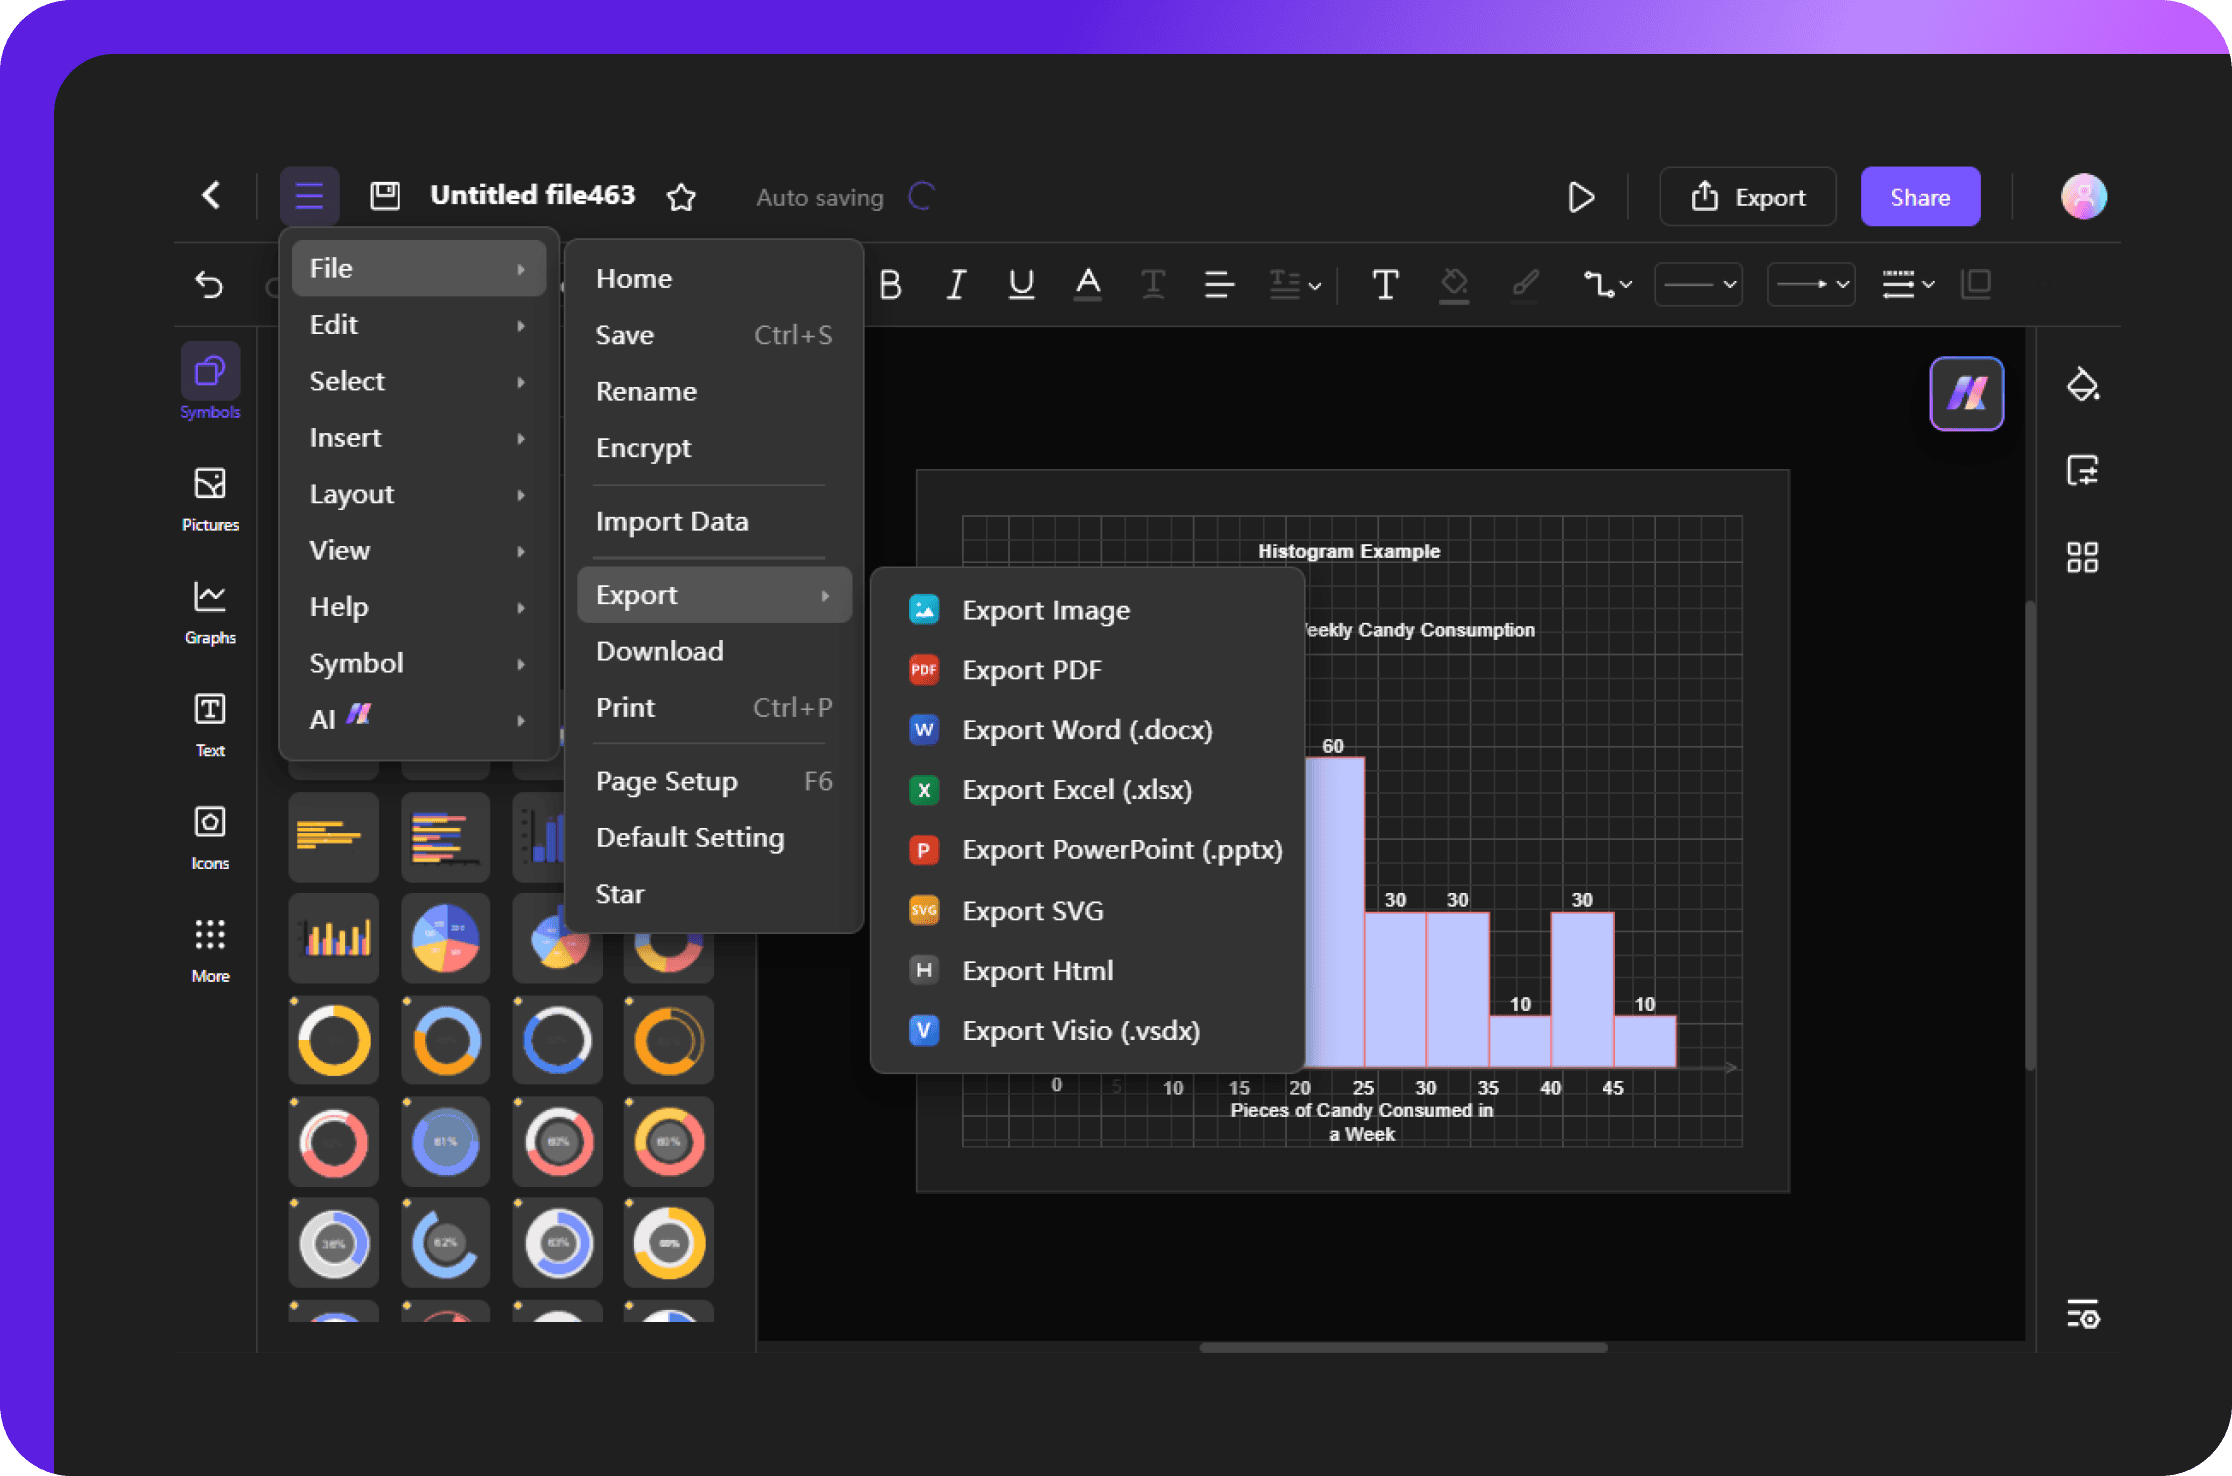
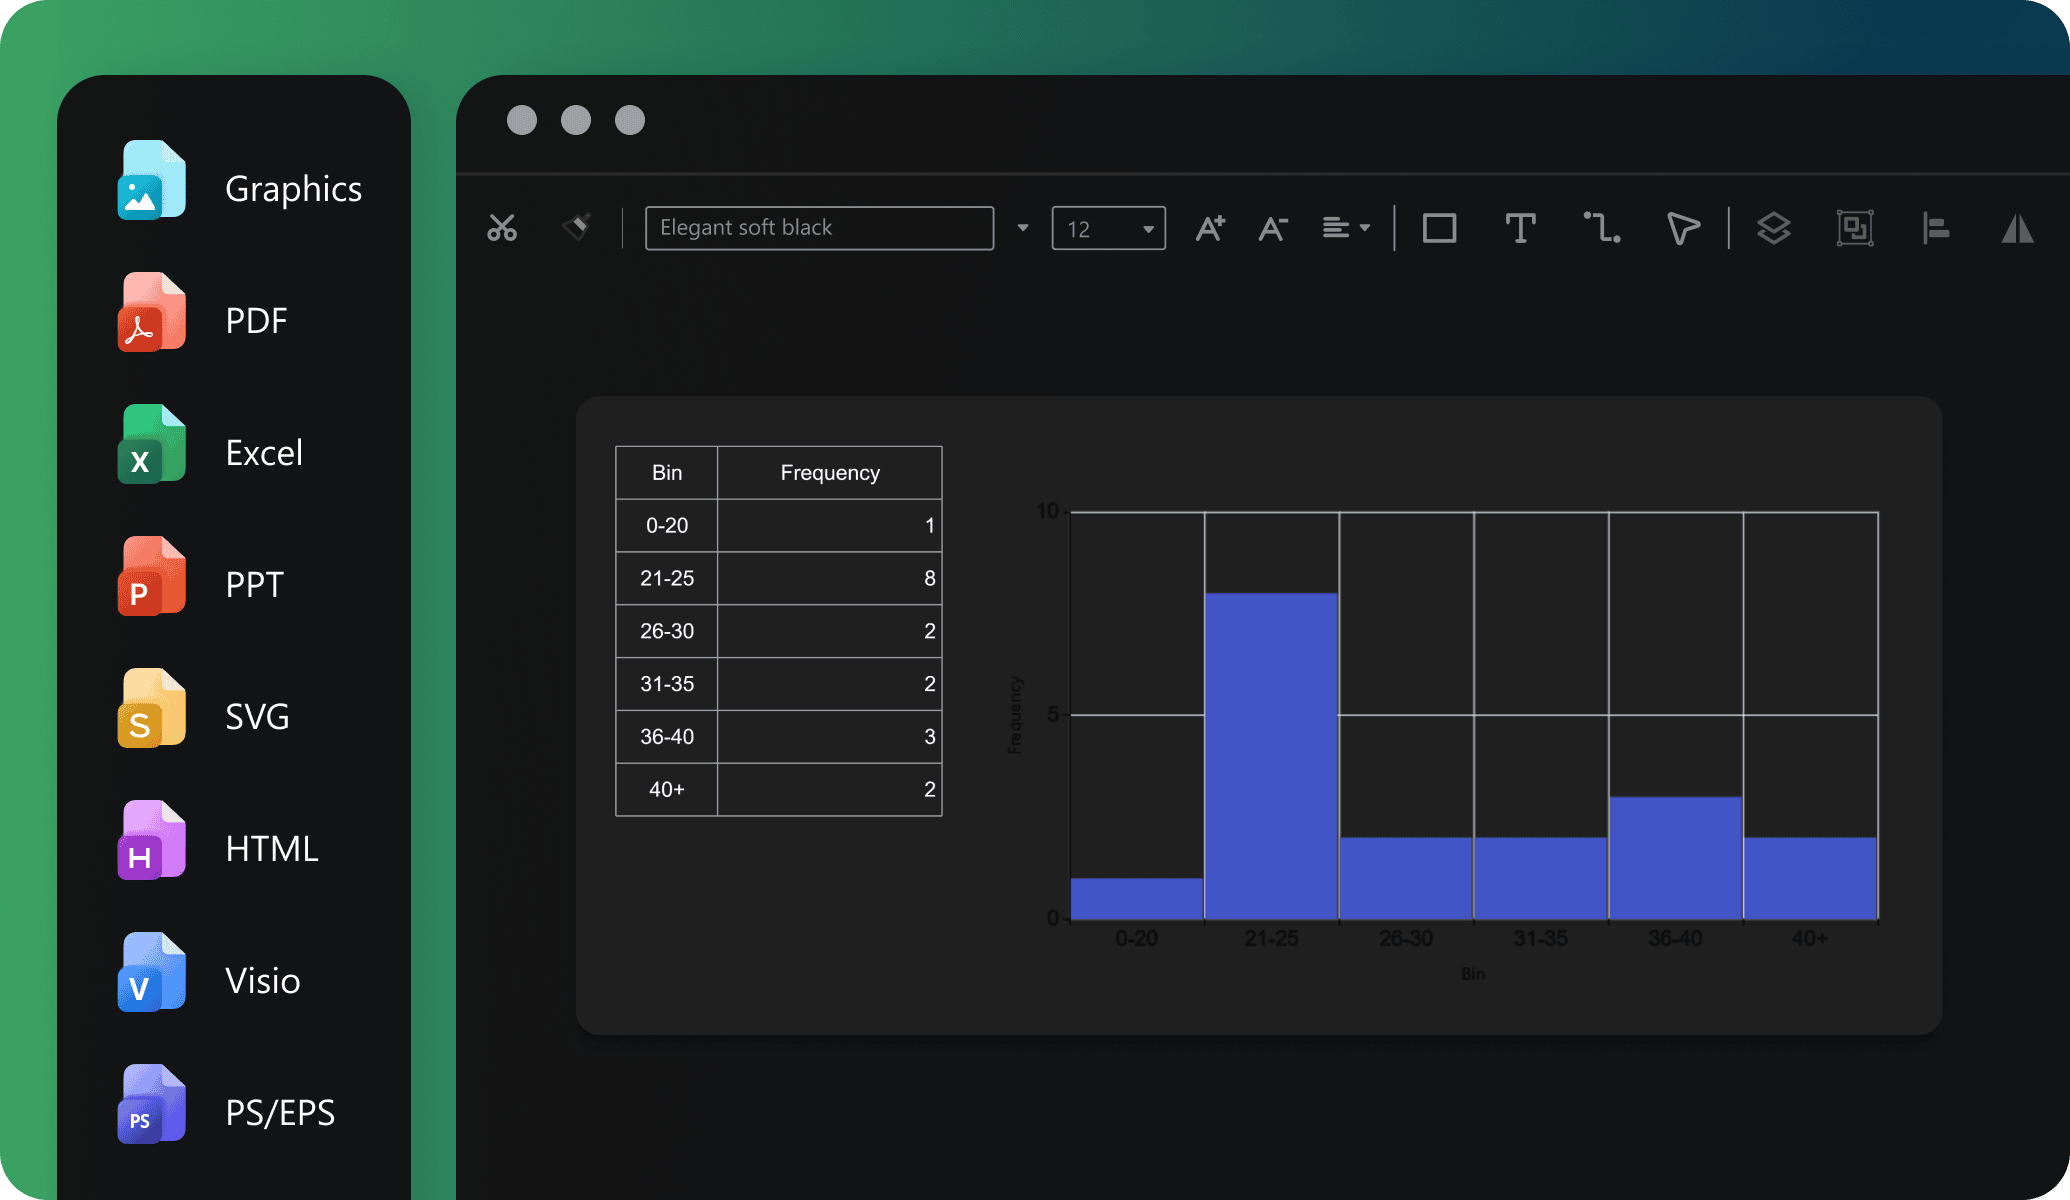
Edraw.AI believes in making your work accessible. It lets you download your diagram in over ten formats or share it directly via email, team space, or social media. Want a hard copy for corporate use? Get high-resolution prints with one click.
Ideal tool for collaboration

Efficiency Boost
With multi-device support and access on the cloud, team members can access and edit files anytime, reducing repetitive tasks and significantly improving efficiency.

All-in-one Solution
Edraw.AI supports over 210 drawing types, from mind maps to flowcharts. This extensive range allows teams to create diverse visual content within a single platform.

Enhanced Communication
Visual diagrams simplify complex ideas, improving communication within teams and with external partners, making discussions and decision-making more efficient and clear.

Seamless Collaboration
It allows team members to co-edit and share diagrams in real-time, ensuring smooth workflow without the need for constant tool switching or delays.
