Edraw.AI User Guides
Edraw.AI User Guides
-
Getting Started
-
Diagram from Scratch
-
Files Operation
-
Shapes Operation
-
Import Data to Make a Chart
-
Format and Style
-
Insert Object
-
View the Diagram
-
-
Mind Map from Scratch
-
Insert Objects
-
Topics Operation
-
Files Operations
-
View a Mind Map
-
Outline Mode
-
Theme and Style
-
-
Create with Templates
-
Create with AI
-
AI Image Tools
-
AI Diagram
-
AI File Analysis
- AI Chat
- AI OCR
- AI Flowchart
- AI Mind Map
- AI Drawing
-
-
Project Management
Adding Charts to Diagrams
The Chart tool in Edraw.AI lets you turn data into easy-to-understand visuals. You can create bar graphs, pie charts, or line graphs. This helps you show trends, comparisons, or proportions clearly. Charts make data more accessible and can highlight key points in your presentations or reports.
To add charts to your Edraw.AI diagrams, do the steps below:
Step ❶
Click the icon with three horizontal lines on the upper left. Then, go to Insert > Chart. Alternatively, press Ctrl+Alt+P on your keyboard.
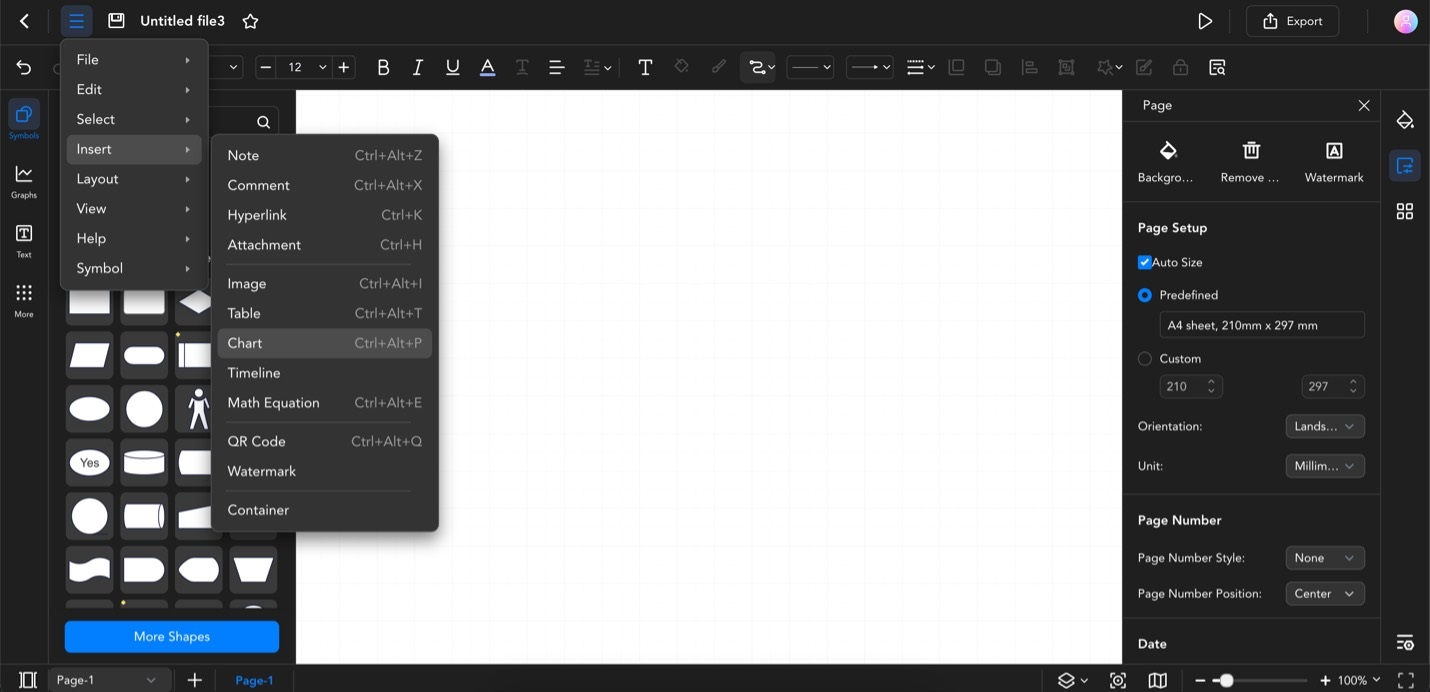
Click the Three-Line Icon, then Go to Insert > Chart, or Press Ctrl+Alt+P
Step ❷
Browse through the available chart types and click OK.
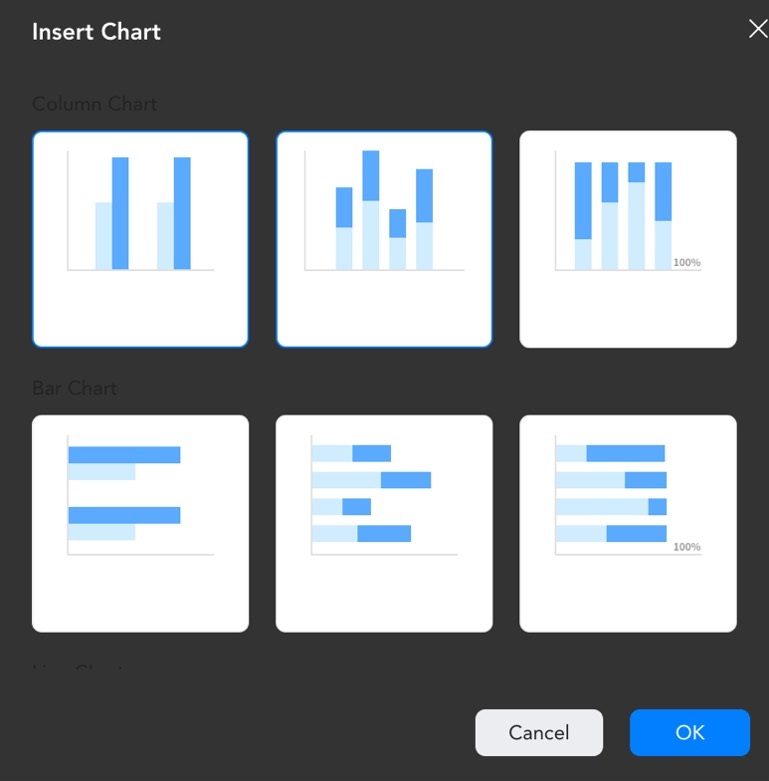
Browse Chart Types and Click OK
Step ❸
Click Manage Data. Use the appearing spreadsheet to add data to your chart.
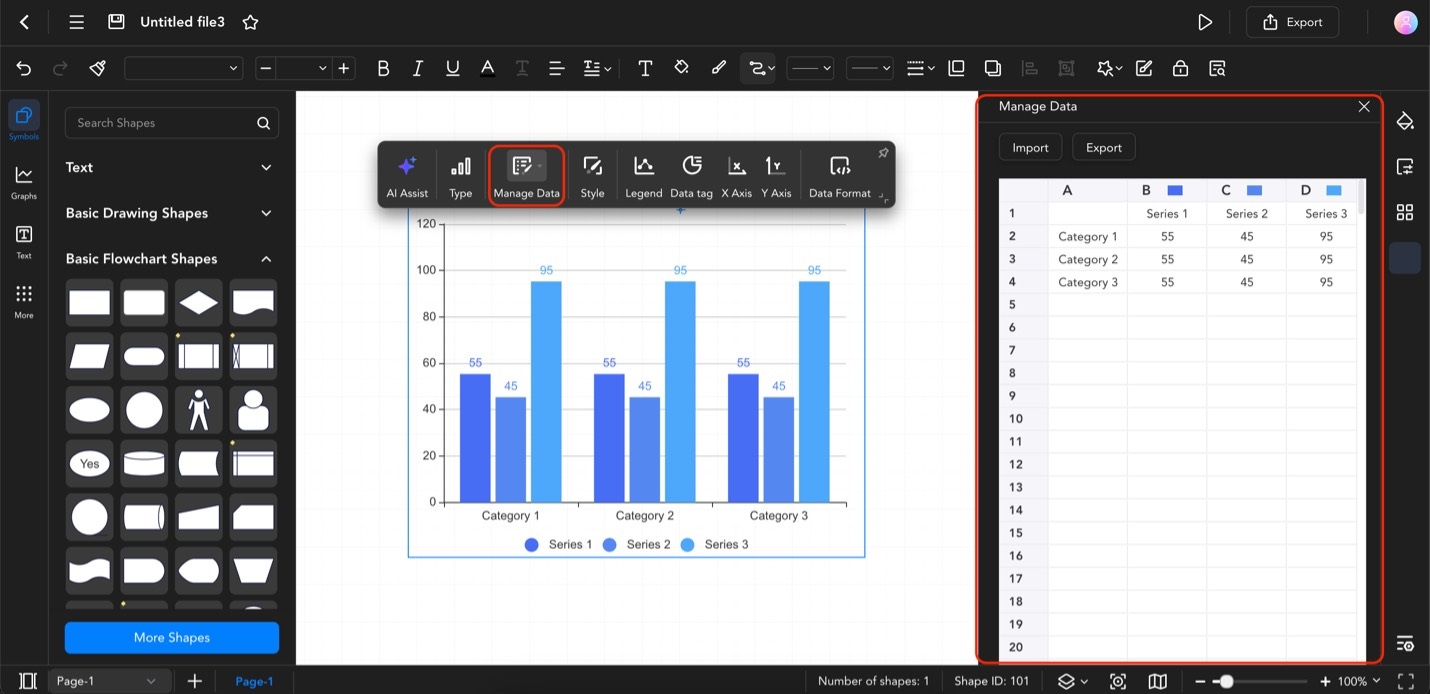
Click Manage Data and Enter Data in the Spreadsheet