Edraw.AI User Guides
-
Getting Started
-
Diagram from Scratch
-
Files Operation
-
Shapes Operation
-
Import Data to Make a Chart
-
Format and Style
-
Insert Object
-
View the Diagram
-
-
Mind Map from Scratch
-
Insert Objects
-
Topics Operation
-
Files Operations
-
View a Mind Map
-
Outline Mode
-
Theme and Style
-
-
Create with Templates
-
Create with AI
-
AI Image Tools
-
AI Diagram
-
AI File Analysis
- AI Chat
- AI OCR
- AI Flowchart
- AI Mind Map
- AI Drawing
-
-
Project Management
Add Tables to Diagrams
Tables in Edraw.AI help you organize and present data clearly in diagrams. You can easily create rows and columns to display structured information. This tool compares data, shows schedules, or lists items. You can customize table styles, colors, and cell sizes to match your diagram's look. Tables make complex information more accessible to understand, improving your visual presentations.
To add tables to your diagrams with Edraw.AI, perform the steps below:
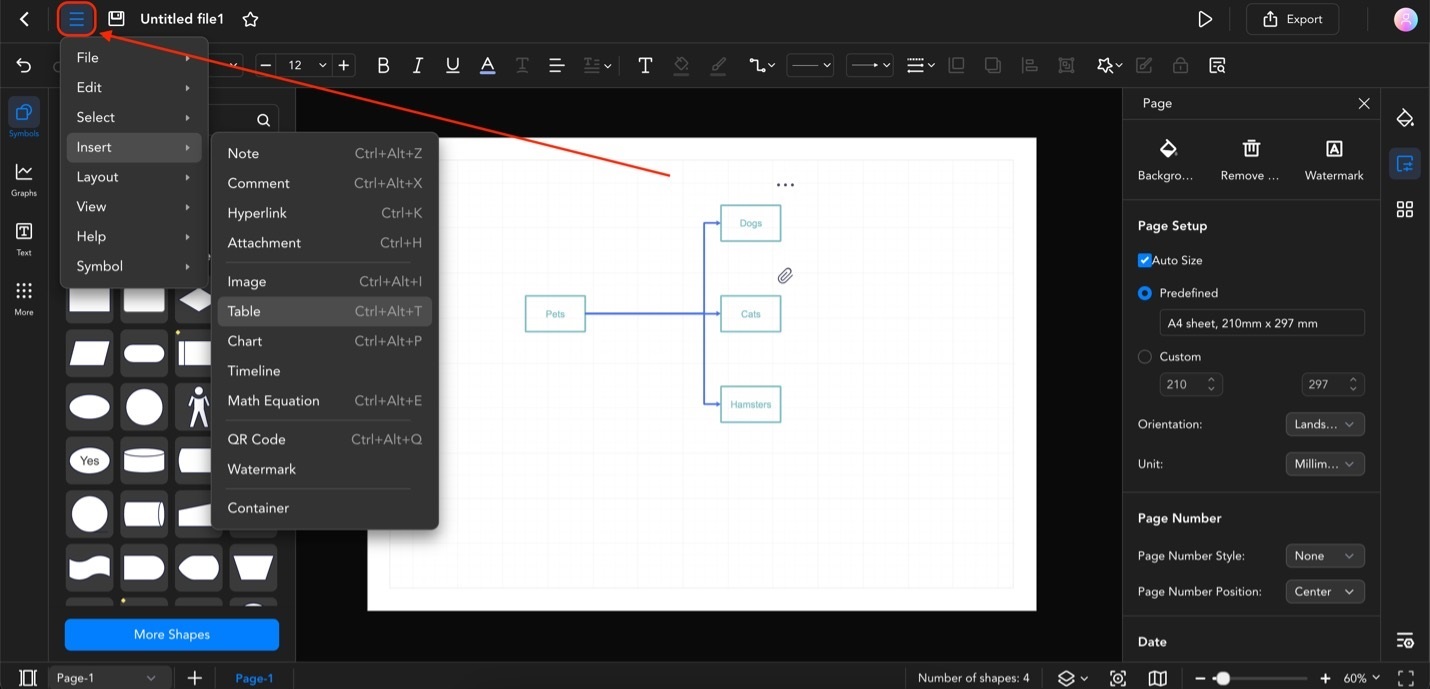
Step ❶
Start the operation by clicking Menu (icon with three horizontal lines). Then, go to Insert > Table. You can also press Ctrl + Alt + T.
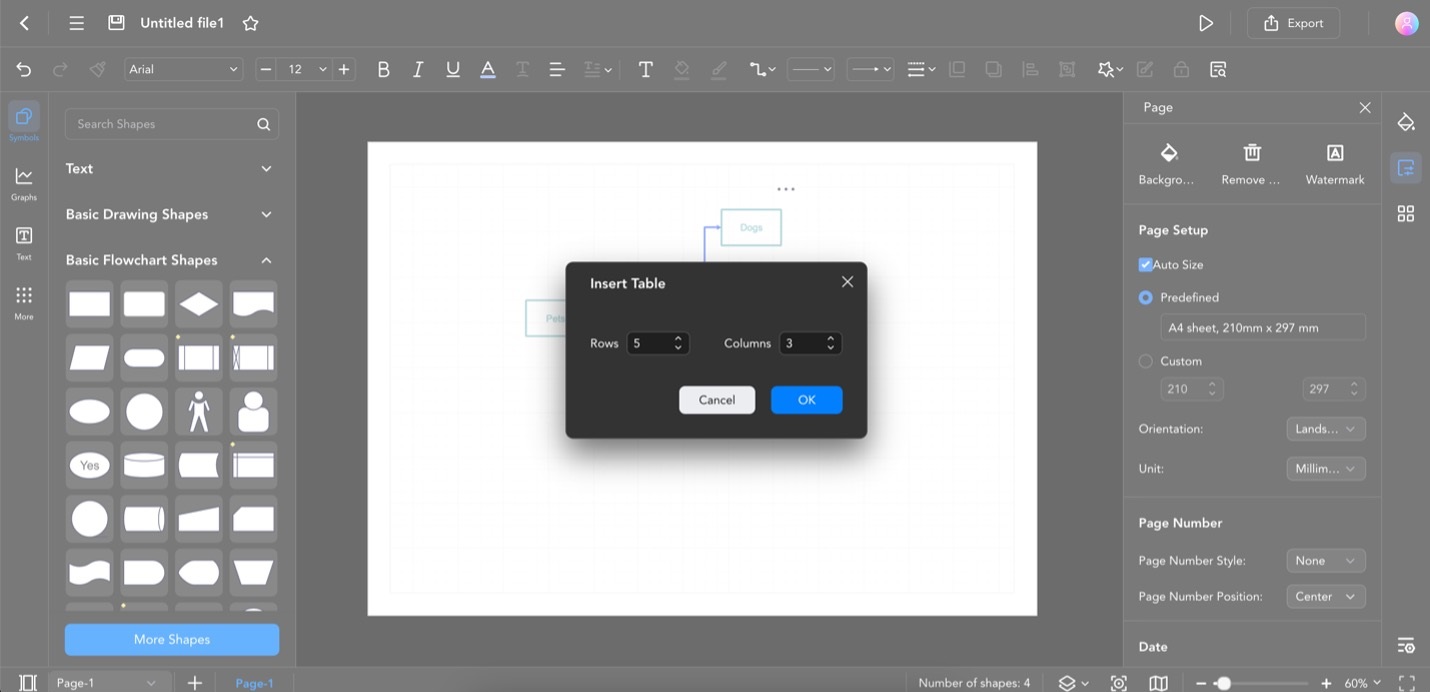
Step ❷
The Insert Table pop-up window will appear. Set your desired number of Rows and Columns.
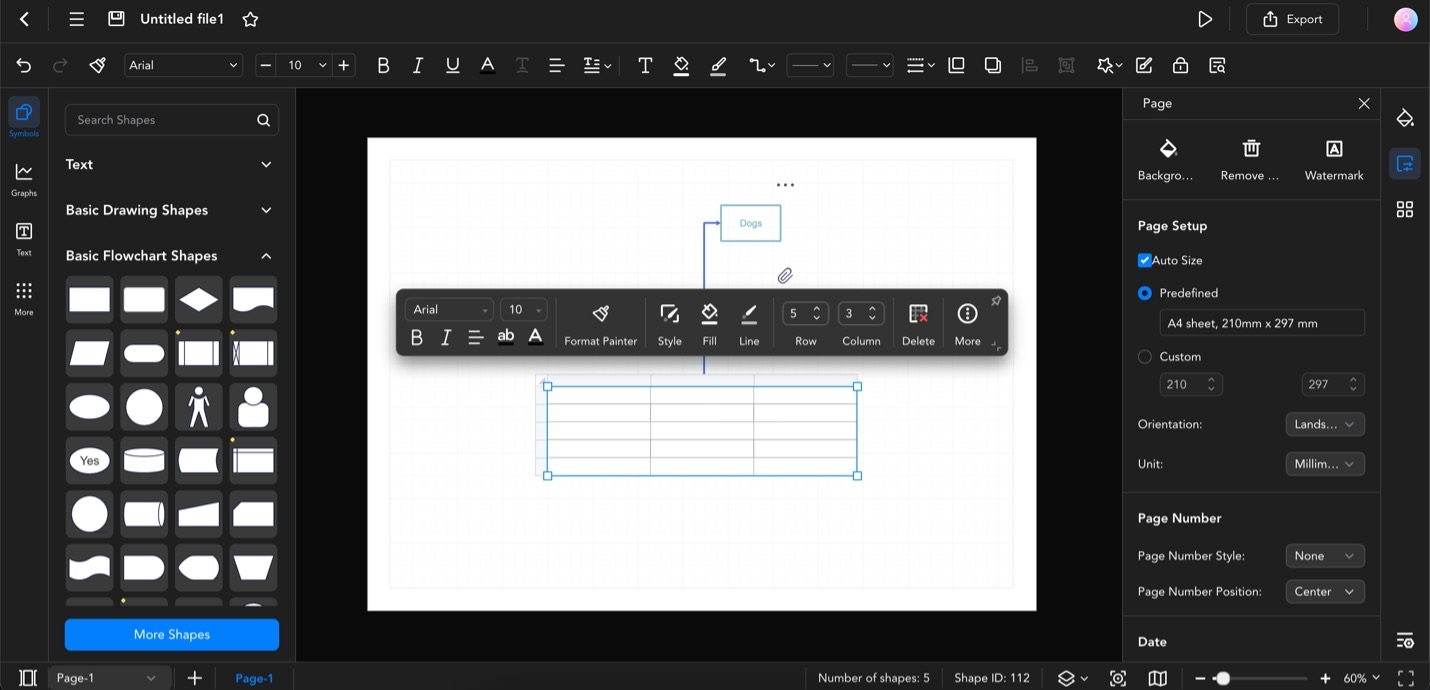
Step ❸
You should now have the table on your canvas. Use the formatting tools available on the appearing customization bar to personalize it.