Edraw.AI User Guides
-
Getting Started
-
Diagram from Scratch
-
Files Operation
-
Shapes Operation
-
Import Data to Make a Chart
-
Format and Style
-
Insert Object
-
View the Diagram
-
-
Mind Map from Scratch
-
Insert Objects
-
Topics Operation
-
Files Operations
-
View a Mind Map
-
Outline Mode
-
Theme and Style
-
-
Create with Templates
-
Create with AI
-
AI Image Tools
-
AI Diagram
-
AI File Analysis
- AI Chat
- AI OCR
- AI Flowchart
- AI Mind Map
- AI Drawing
-
-
Project Management
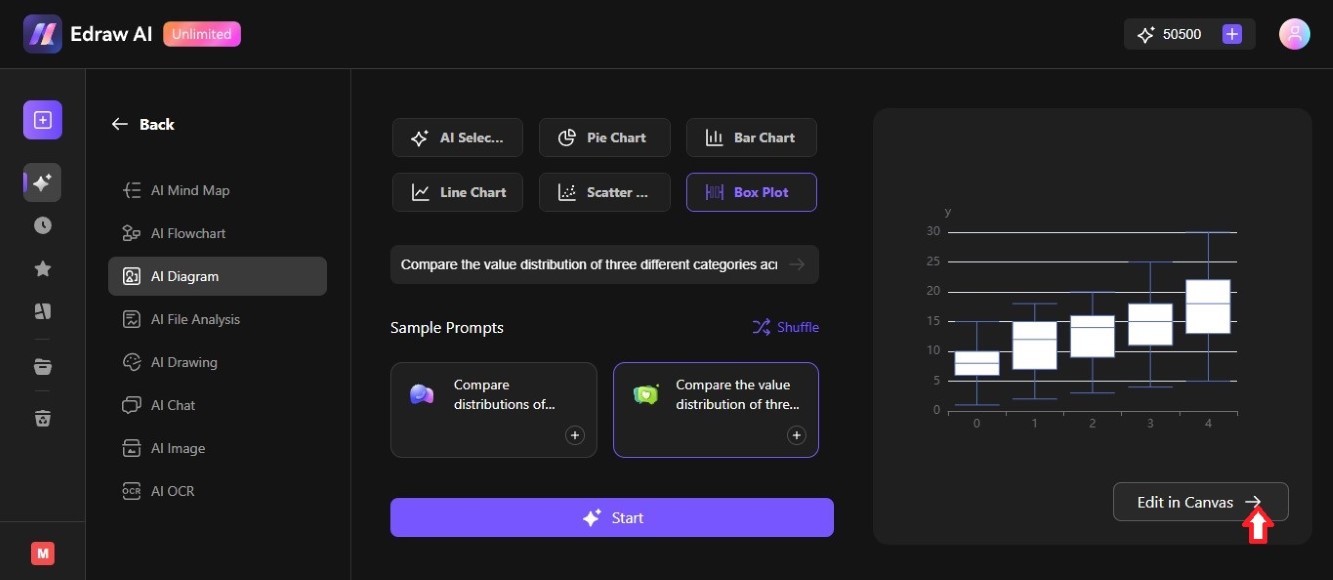
How to Create a Box Plot with AI
A box plot diagram is a graphical representation that summarizes the distribution of a dataset. Edraw.AI diagram generator can help create a box plot using a text prompt. Here's how to use it:
Step ❶
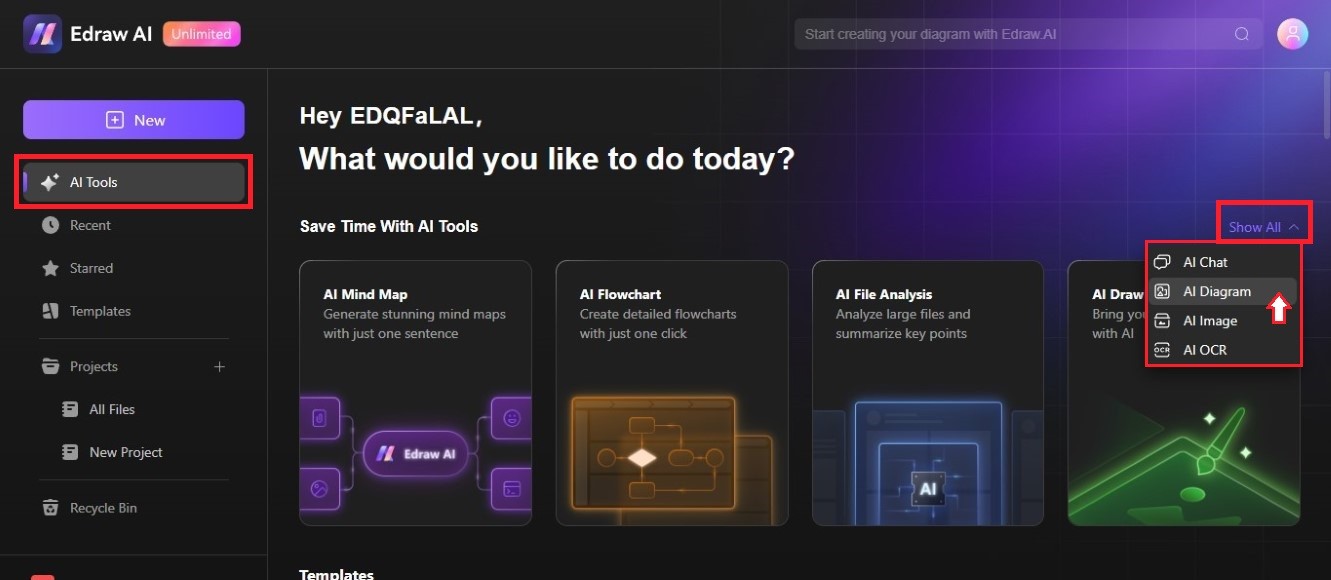
Go to the AI Tools from the left-side navigation pane of the main dashboard, then select AI Diagram from the Show All dropdown list.
Step ❷
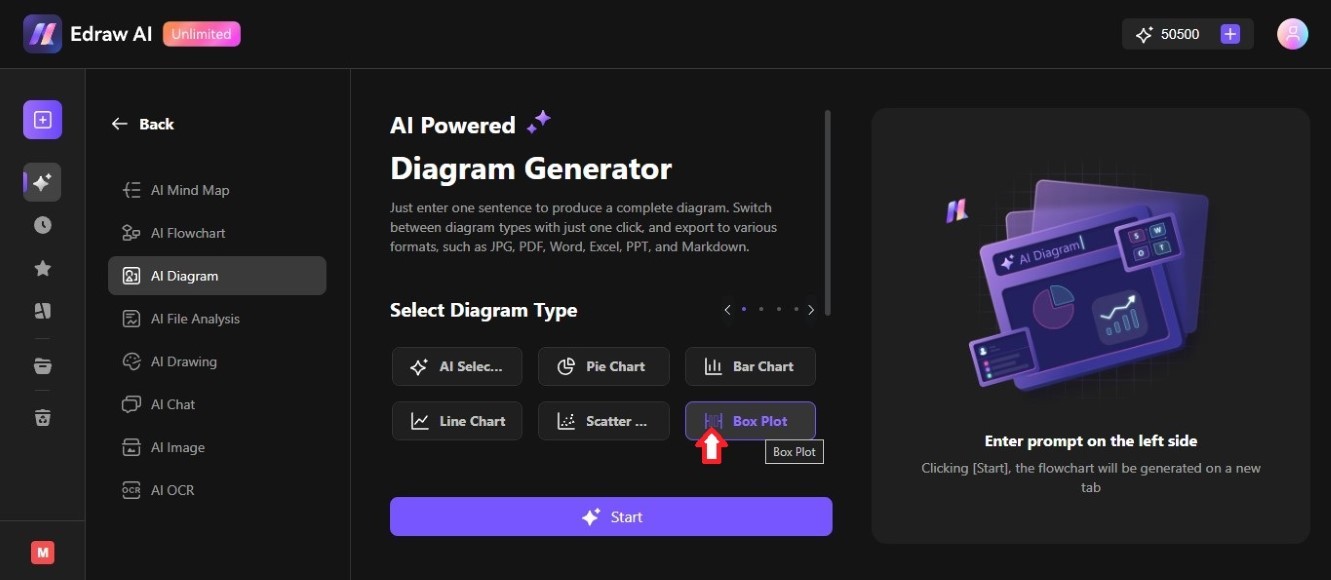
Select Box Plot from the available diagram types.
Step ❸
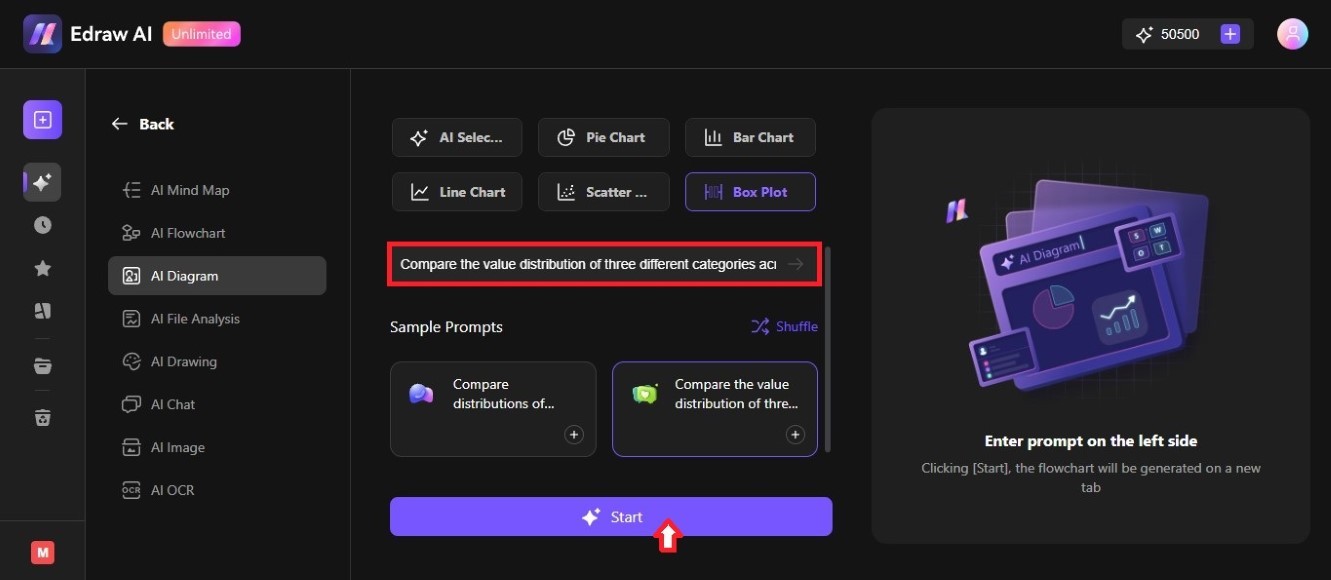
Enter a prompt in the text box, then click Start on the Diagram Generator.
Tip:
Edraw.AI provides examples of prompts for making a box plot. Select one from the Sample Prompts section or click Shuffle to create more ideas.Step ❹
Click Edit in Canvas on the lower-right side of the AI box plot diagram preview.
Step ❺
Double-click the box plot, then click the Edit Data icon on the lower-right side of the Apache Echarts pop-up window. Enter the new values for the box plot diagram.
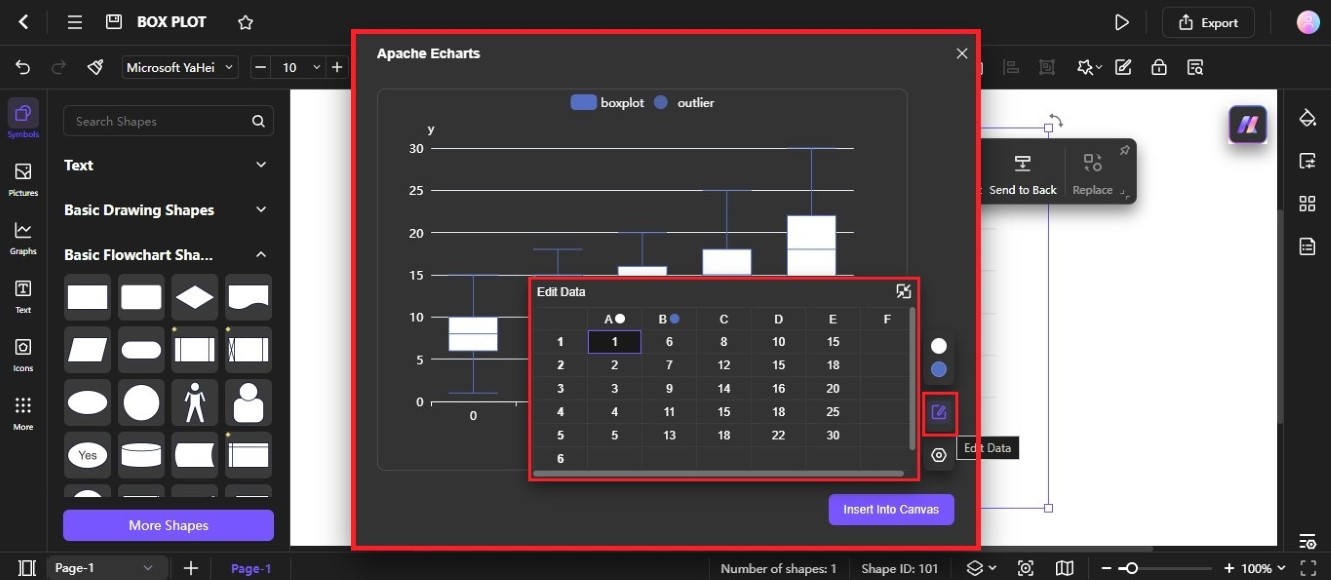
Step ❻
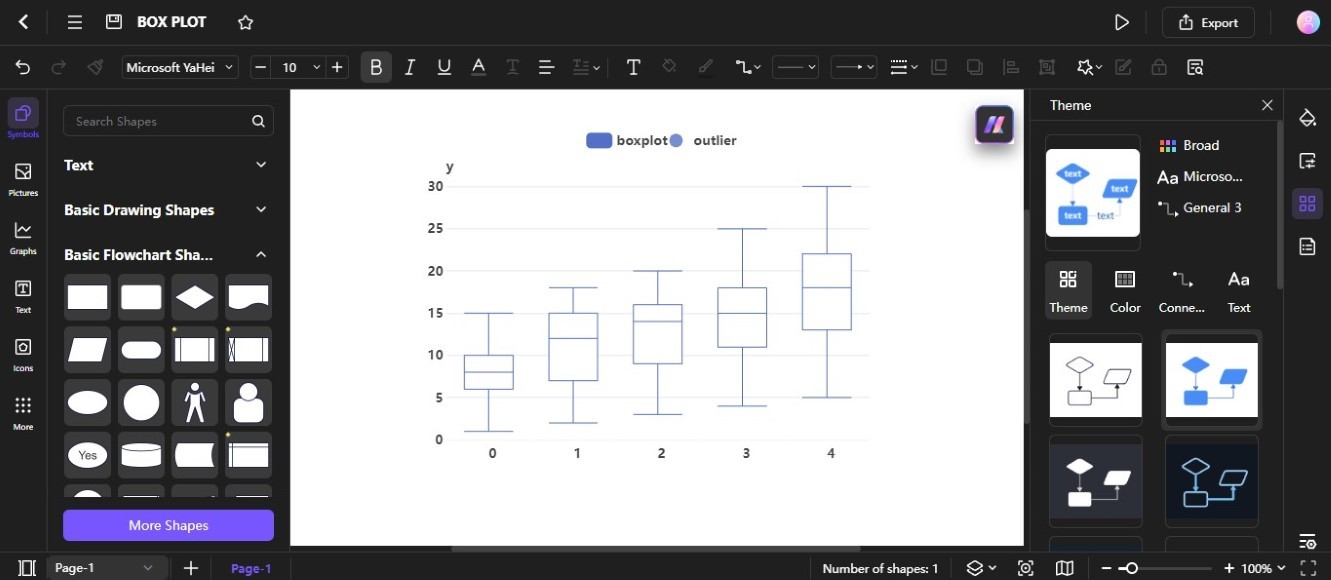
Customize the look of the box plot. Select a Theme, Color, and more from the right panel.