Edraw.AI User Guides
Edraw.AI User Guides
-
Getting Started
-
Diagram from Scratch
-
Files Operation
-
Shapes Operation
-
Import Data to Make a Chart
-
Format and Style
-
Insert Object
-
View the Diagram
-
-
Mind Map from Scratch
-
Insert Objects
-
Topics Operation
-
Files Operations
-
View a Mind Map
-
Outline Mode
-
Theme and Style
-
-
Create with Templates
-
Create with AI
-
AI Image Tools
-
AI Diagram
-
AI File Analysis
- AI Chat
- AI OCR
- AI Flowchart
- AI Mind Map
- AI Drawing
-
-
Project Management
Generate Candlestick Charts With AI Diagram
Candlestick charts are a crowd favorite when it comes to finance. Many analysts utilize this to track crypto or stock prices. If you also want to use this chart, Edraw.AI can generate one for you. Just give it a prompt that it can follow. It automatically calculates and displays opening, closing, and high and low prices, helping you present data or analyze investments.
To generate candlestick charts with Edraw.AI, follow the steps below:
Step ❶
Access AI Diagram by going to AI Tools > Show All.
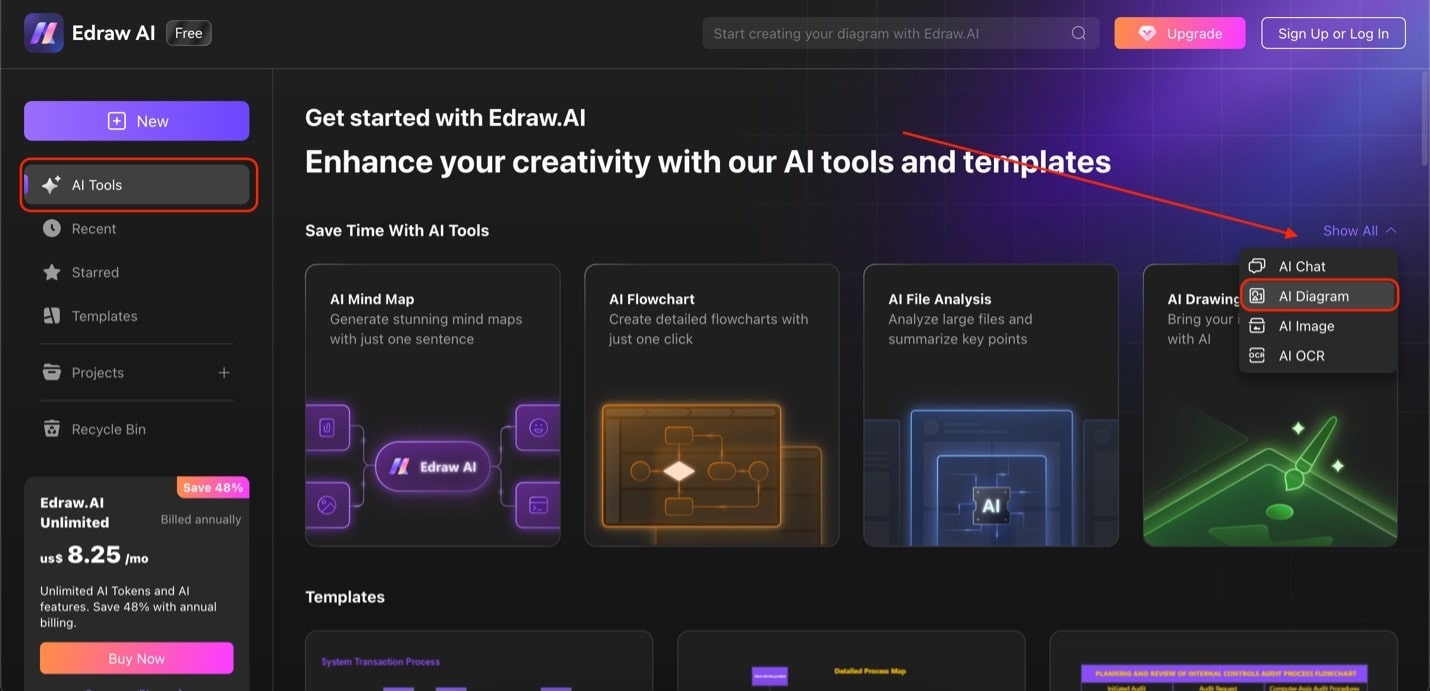
Edraw homepage ai tools
Step ❷
Locate Candlestick Chart under Select Diagram Type. After typing in your prompt, click Start. After the candlestick chart is generated, select Edit in Canvas to customize.
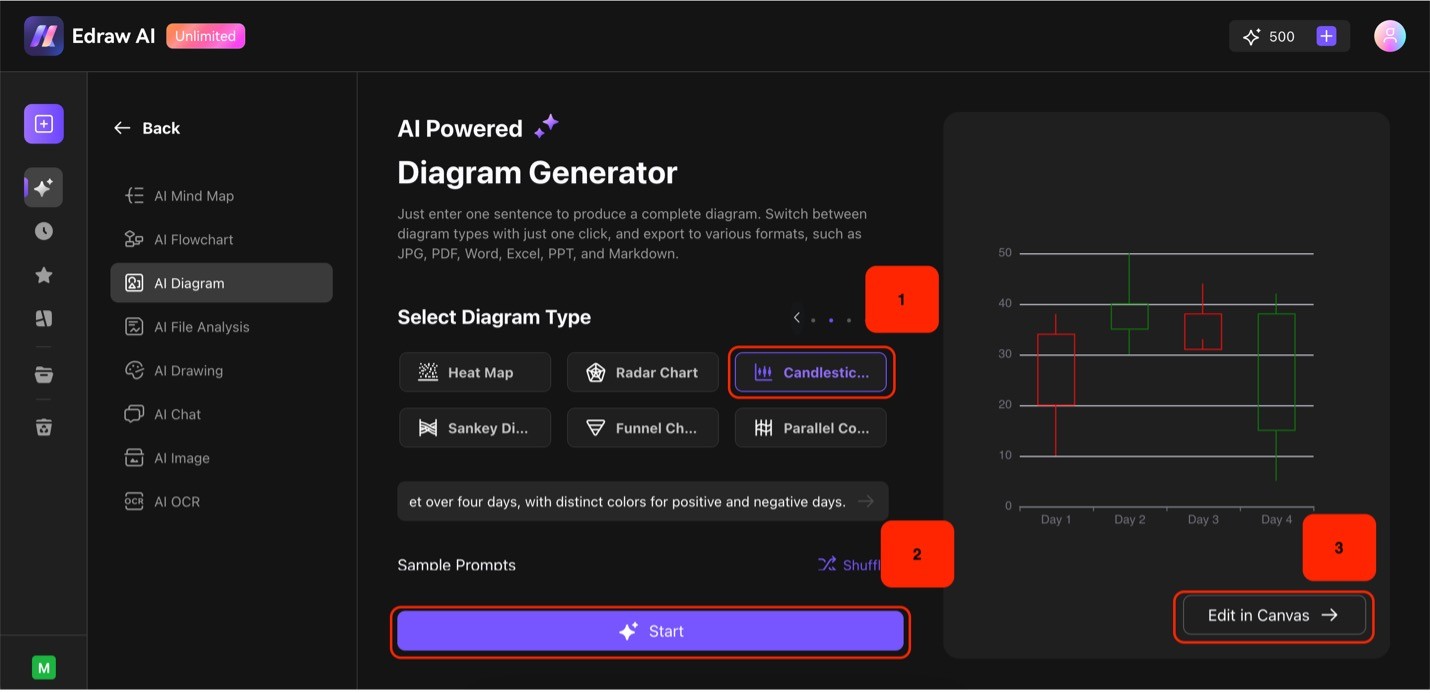
Candlestick chart generator