Edraw.AI User Guides
Analyze Chart With AI
Learn how to use Edraw.AI to analyze and gain insights from your organization charts, flowcharts, tables, and other diagrams.
Index
AI Organization Chart Analysis
Edraw.AI AI Assist feature takes the complexity out of analyzing your organization chart. It offers two key functions: Organization Analysis and Organization Diagnosis. This AI can help you see things like reporting structures, identify potential weaknesses, and ensure your org chart reflects your company's goals. Here's how to use the Organizational Chart Analysis tool in Edraw.AI:
Step ❶
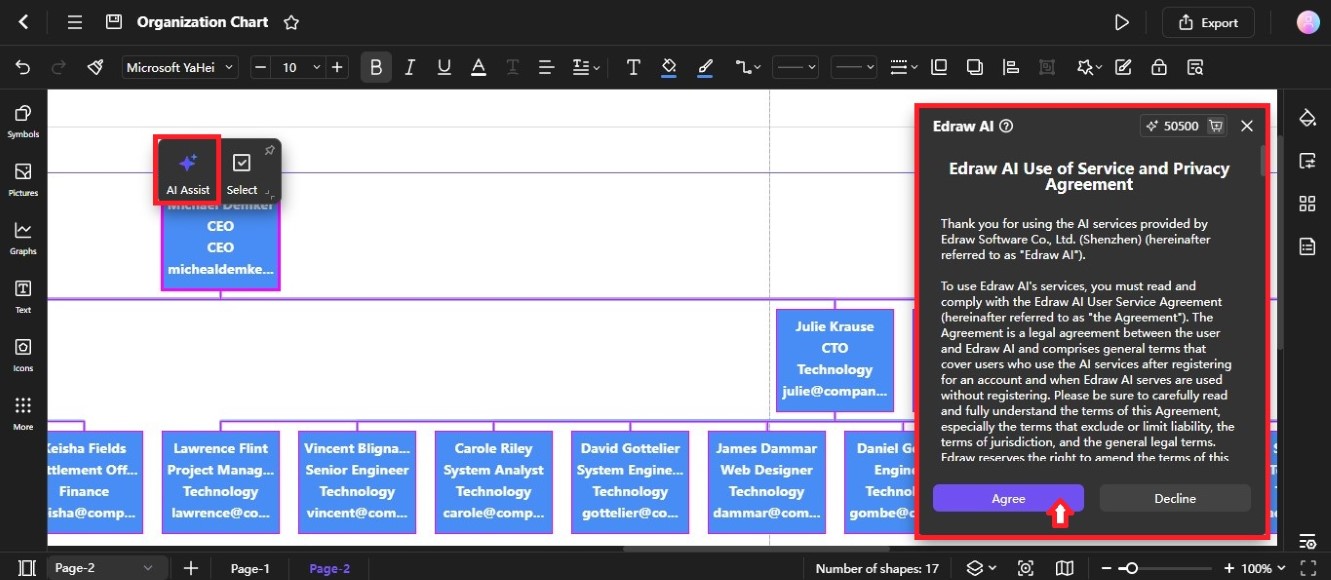
Select the organization chart on the editing canvas, then click AI Assist from the floating toolbar.
Note:
Read the service and privacy agreement, then click Agree to continue.Step ❷
Select Organization Analysis or Organization Diagnosis in the menu to open the Edraw AI panel on the right side of the canvas.
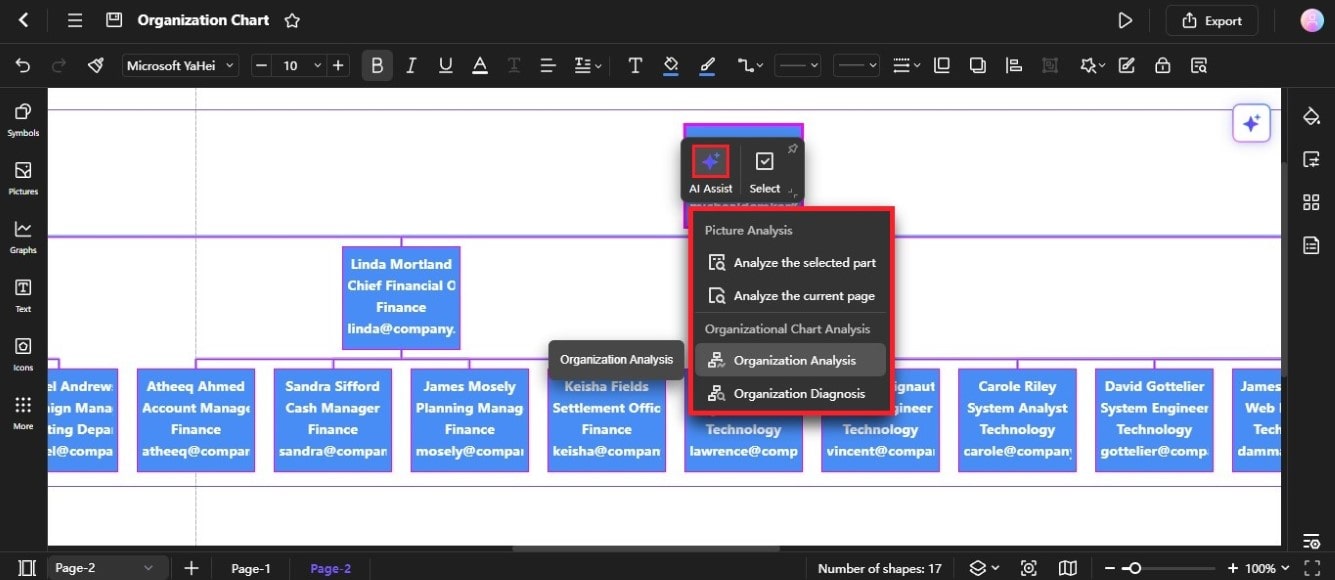
- Organization Analysis
Choosing Organization Analysis will help you see information about your employees, org levels, and more. These insights can help you make informed decisions about your company's structure, human resources, and projects.
- Organization Diagnosis
Edraw AI can also analyze your company's structure to identify strengths, weaknesses, and areas for improvement. It examines decision-making, communication, workflow, and adaptability. By using this tool, you can make informed decisions and optimize your organization's performance.
AI Flowchart Analysis
The AI Analysis feature of Edraw.AI takes the effort out of making clear and efficient flowcharts. It will analyze your existing shapes and text, suggest improvements, identify potential gaps, and more. This AI assistant helps ensure your flowchart is well-organized and easy to understand for everyone. Follow this guide to use the AI flowchart analysis in Edraw.AI:
Step ❶
Select the flowchart on the editing canvas, then click AI Assist from the floating toolbar.
Step ❷
Select Flowchart Detection, Flowchart Optimization, or Flowchart Description on the menu.
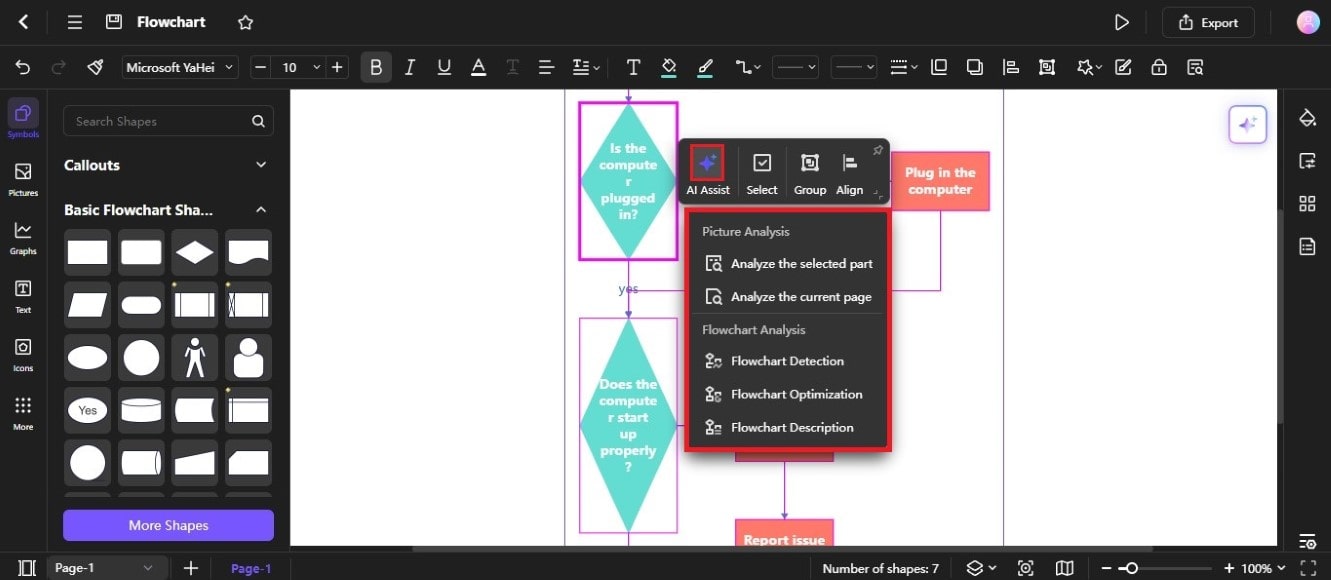
- Flowchart Detection
The Edraw AI tool can analyze your flowchart and detect key elements like nodes, processes, and connections. It then suggests improvements based on what it finds. For example, it might suggest merging steps that can be done together or splitting complex steps into simpler ones. This helps you create a more efficient and easier-to-understand flowchart.
- Flowchart Optimization
Flowchart Optimization lets you improve your flowchart in different ways. You can choose to add more details to your processes, including exceptions to the normal flow of logic, or even add completely new processes. This helps you create a more accurate and complete flowchart that better reflects your real-world process.
- Flowchart Description
Flowchart Description in Edraw AI helps you understand a flowchart by describing its process step by step. It outlines the sequence of actions, checks for correctness, and explains the flow even if the chart is incomplete. This feature ensures you can grasp the flowchart's logic without seeing the specific diagram details.
AI Chart Analysis
By automating tasks like data comparison, anomaly identification, summary, and trend prediction, AI can save you time and provide valuable insights. The AI Chart Analysis feature lets you extract more value from your charts. It helps in making data-driven insights more accessible and actionable. Here's how to use it for different types of charts:
Step ❶
Select the chart on the editing canvas, then click AI Assist from the floating toolbar.
Step ❷
Select an option from the Chart Analysis section in the menu.
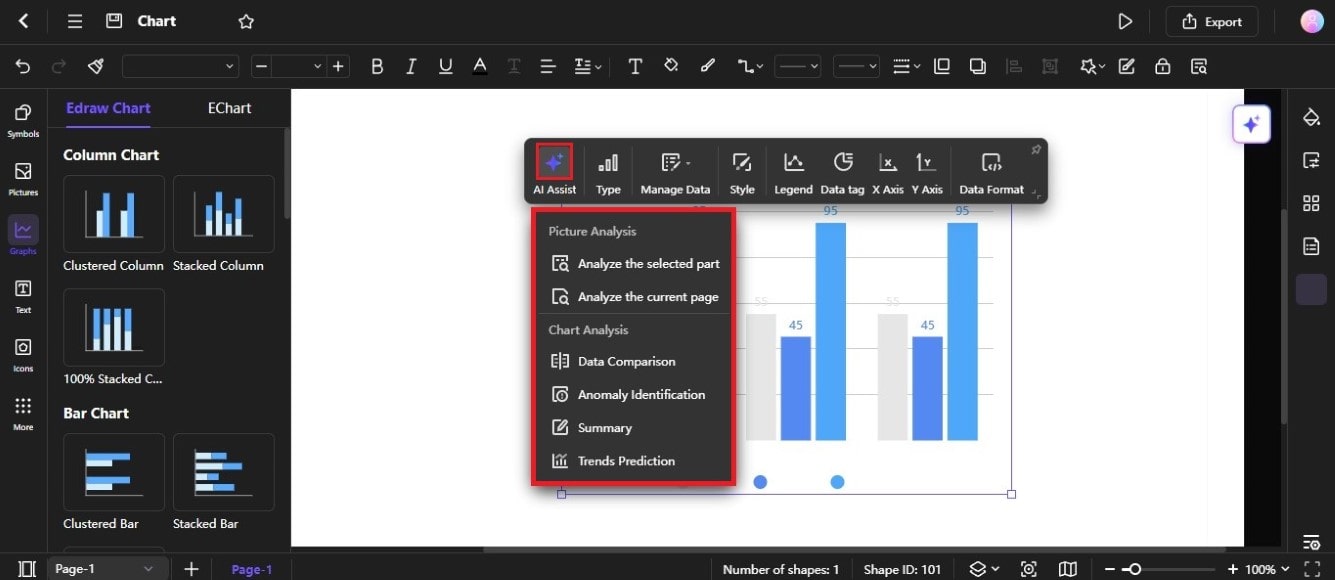
- Data Comparison
AI can quickly compare different data points within a chart. It helps you identify similarities, differences, and outliers.
- Anomaly Identification
AI can detect unusual patterns or data points that deviate from the norm. It will alert you to potential issues or opportunities.
- Summary
AI can automatically generate concise summaries of your chart's key findings. Use this tool to make it easier to communicate your insights to others.
- Trends Prediction
AI analysis can forecast future trends by examining historical data for recurring patterns. It enables you to make decisions grounded in data-driven predictions.
AI Table Analysis
Edraw.AI can help you identify any anomalies or unusual patterns in your data. This can help you to spot potential problems or areas for further investigation. Also, AI can generate a summary of your data, which can help you to understand your data more quickly and easily. Finally, Edraw.AI can help you to predict future trends based on your historical data. It can help you to make informed decisions about your business or project.
Step ❶
Select the table in the editing canvas, then click AI Assist from the floating toolbar.
Step ❷
Select the type of AI table analysis you want in the menu.
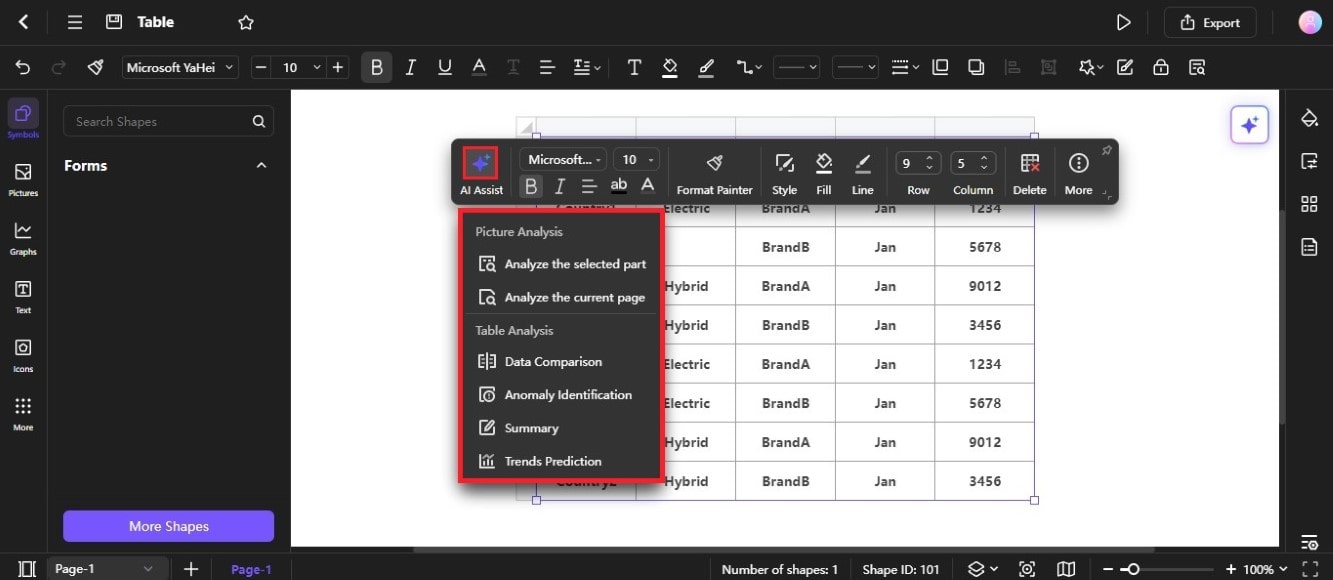
- Data Comparison
Data Comparison helps you identify similarities and differences between multiple datasets, making it easier to spot trends or anomalies. For example, you can use it to compare sales data from different regions or periods to identify which areas are performing better or worse.
- Anomaly Identification
Anomaly Identification helps you spot unusual or unexpected values in your data. By flagging these anomalies, you can investigate potential issues that might affect your analysis. For instance, you might identify a sudden spike in customer complaints or a significant drop in sales.
- Summary
The summary provides a concise overview of your data, highlighting key statistics and trends. It can help you quickly understand your data without delving into the details. For example, a summary might show you the average sales per month, the highest and lowest sales figures, and any significant trends over time.
- Trends Prediction
Trends Prediction uses historical data to forecast future values. You can expect upcoming trends and make informed decisions by analyzing past patterns. For instance, you might predict future sales based on historical sales data. It could help you to plan your inventory and marketing strategies accordingly.