Edraw.AI User Guides
Edraw.AI User Guides
-
Getting Started
-
Diagram from Scratch
-
Files Operation
-
Shapes Operation
-
Import Data to Make a Chart
-
Format and Style
-
Insert Object
-
View the Diagram
-
-
Mind Map from Scratch
-
Insert Objects
-
Topics Operation
-
Files Operations
-
View a Mind Map
-
Outline Mode
-
Theme and Style
-
-
Create with Templates
-
Create with AI
-
AI Image Tools
-
AI Diagram
-
AI File Analysis
- AI Chat
- AI OCR
- AI Flowchart
- AI Mind Map
- AI Drawing
-
-
Project Management
Generate a Line Chart With AI Diagram
Edraw.AI’s line chart tool uses AI to create trend visualizations. Input your prompt, and the AI generates a clear line chart. It automatically scales axes and plots points for optimal viewing. You can use this tool to quickly illustrate data changes over time or compare multiple data series. This will improve your analysis of trends, patterns, and more.
To generate AI line charts with Edraw.AI, follow the steps below:
Step ❶
Go to AI Tools > Show All > AI Diagram from Edraw.AI’s homepage.
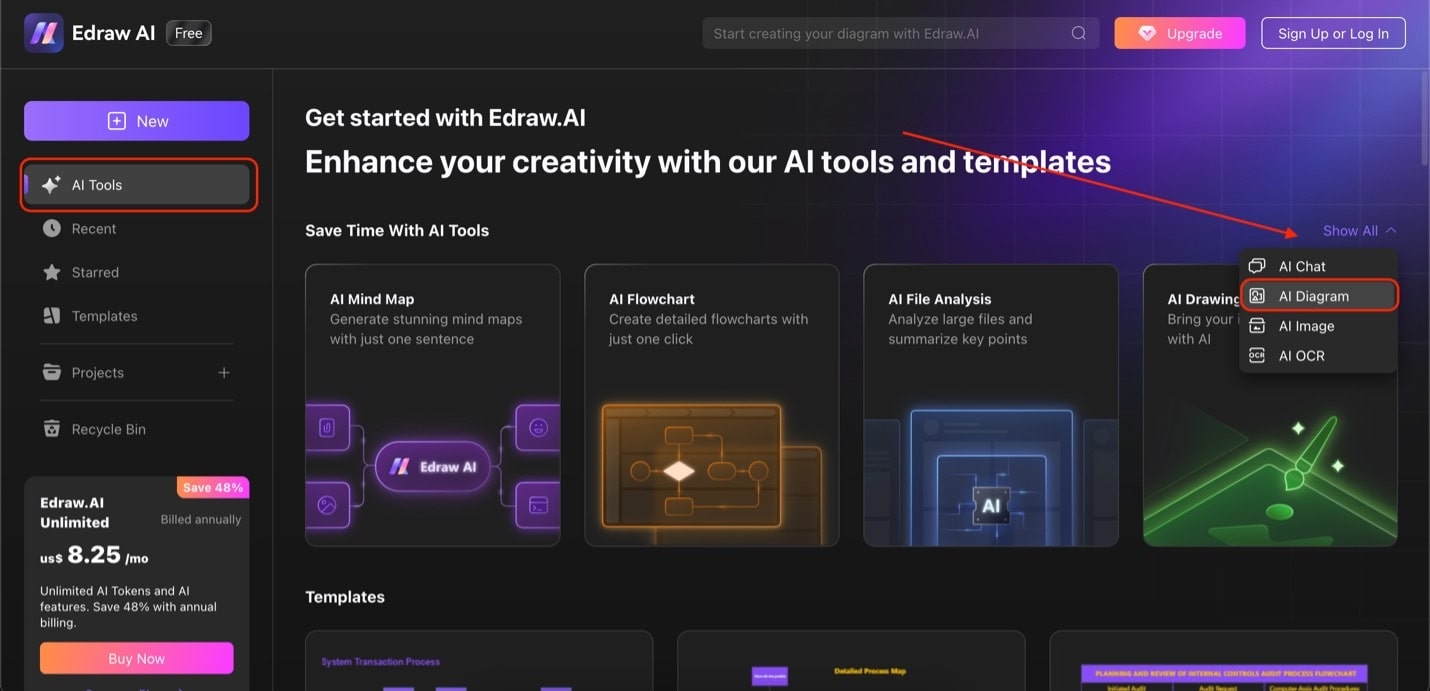
Edraw ai home ai tools
Step ❷
Look for Line Chart under the diagram types. Then, input your prompt in the text box and click Start. Once the line chart is generated, click Edit in Canvas to customize it.
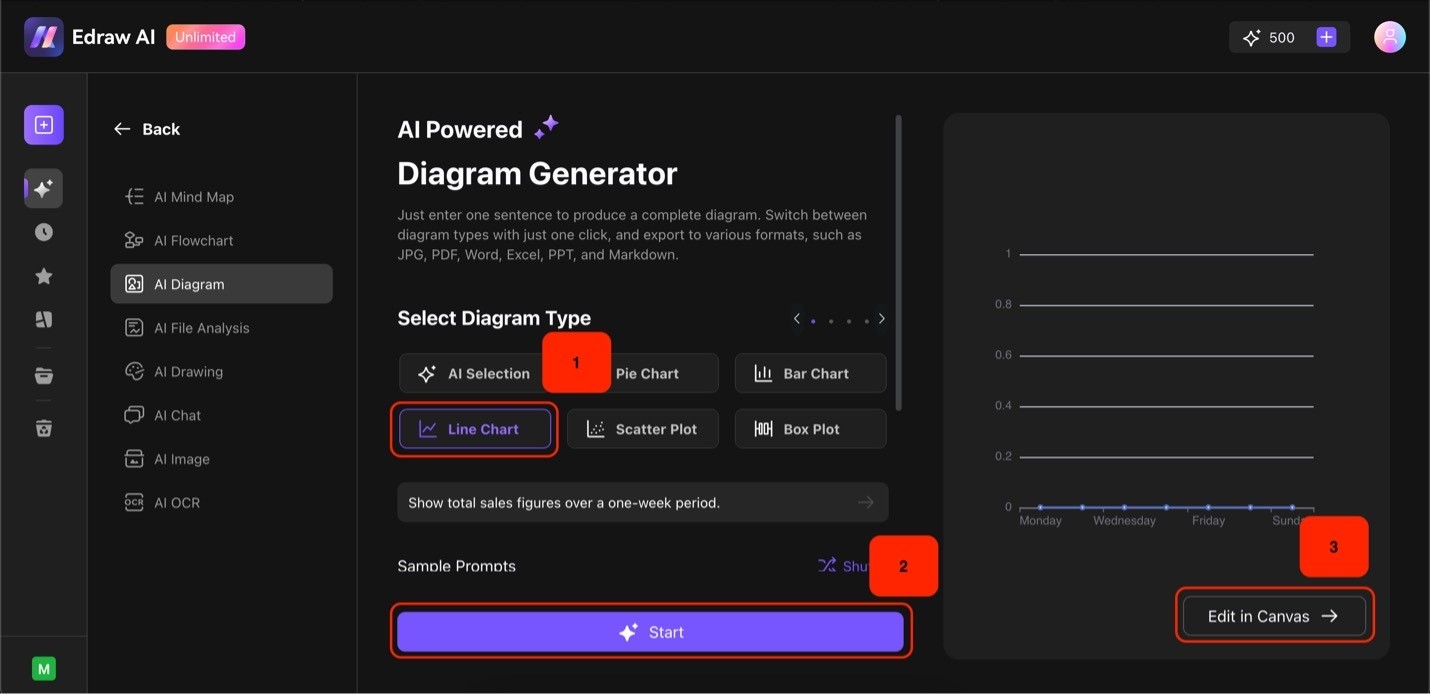
Line chart generator