Edraw.AI User Guides
-
Getting Started
-
Diagram from Scratch
-
Files Operation
-
Shapes Operation
-
Import Data to Make a Chart
-
Format and Style
-
Insert Object
-
View the Diagram
-
-
Mind Map from Scratch
-
Insert Objects
-
Topics Operation
-
Files Operations
-
View a Mind Map
-
Outline Mode
-
Theme and Style
-
-
Create with Templates
-
Create with AI
-
AI Image Tools
-
AI Diagram
-
AI File Analysis
- AI Chat
- AI OCR
- AI Flowchart
- AI Mind Map
- AI Drawing
-
-
Project Management
Create a Sankey Diagram With AI
A Sankey diagram visualizes how a quantity flows between different categories. It uses arrows of varying widths to show the relative size of each flow. You can use the AI diagram generator in Edraw.AI to easily create a Sankey diagram using a prompt:
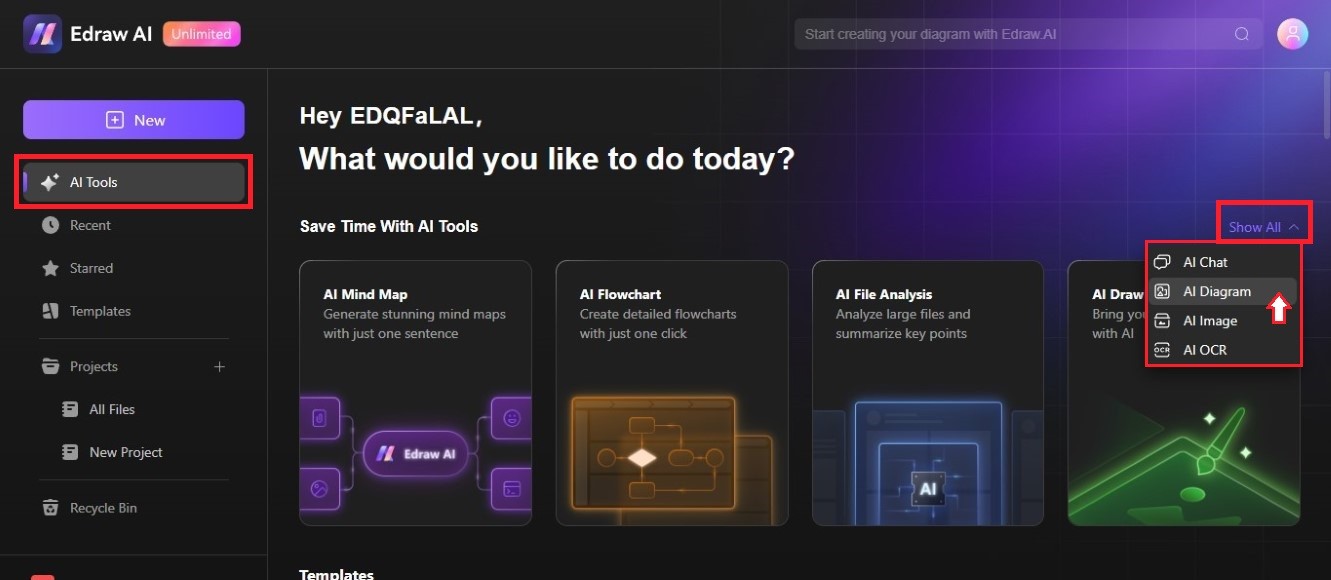
Step ❶
Go to AI Tools from the left-side navigation pane of the Edraw.AI dashboard. Next, select AI Diagram from the Show All dropdown list.
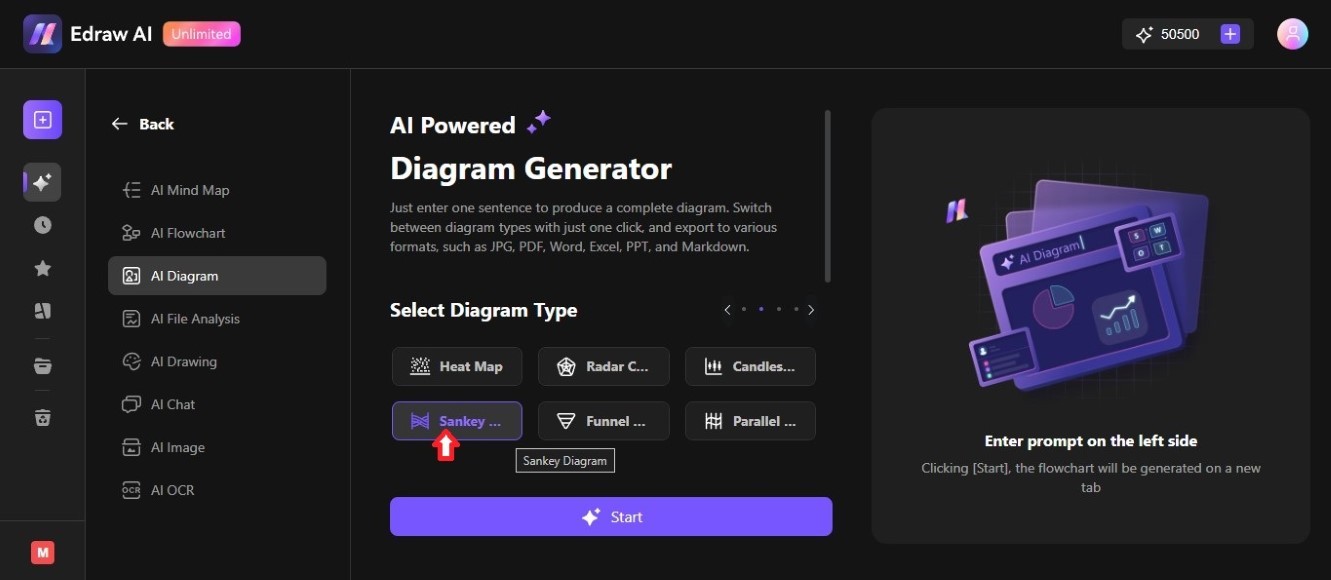
Step ❷
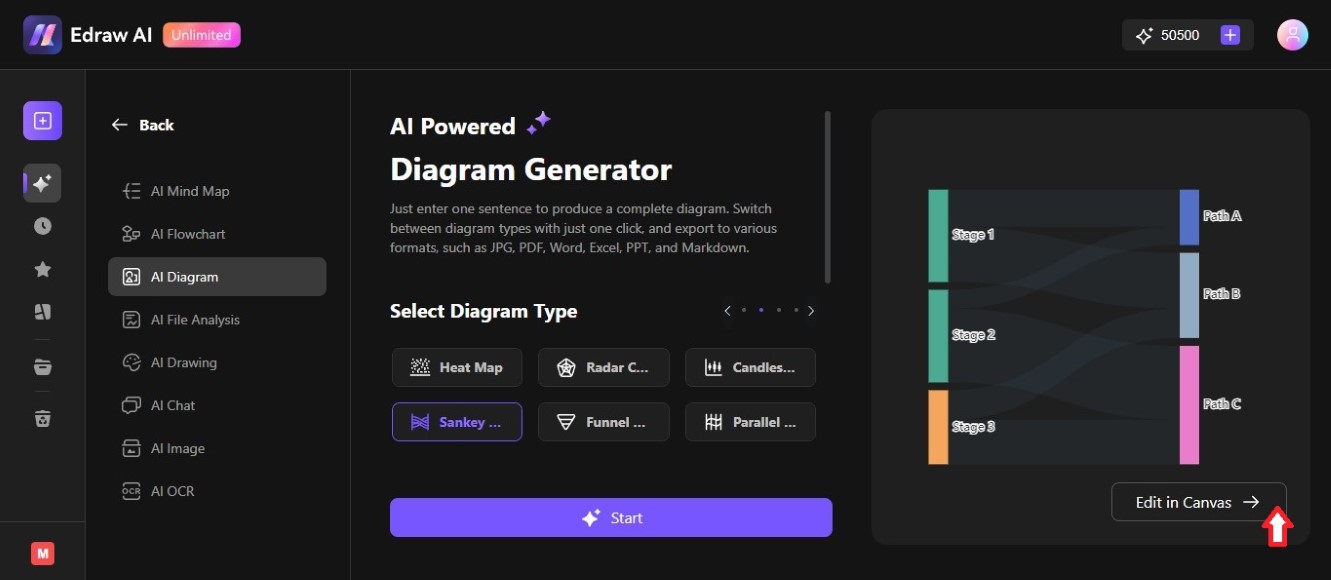
Use the left and right navigation arrows to browse the diagram types. Select the Sankey Diagram to proceed.
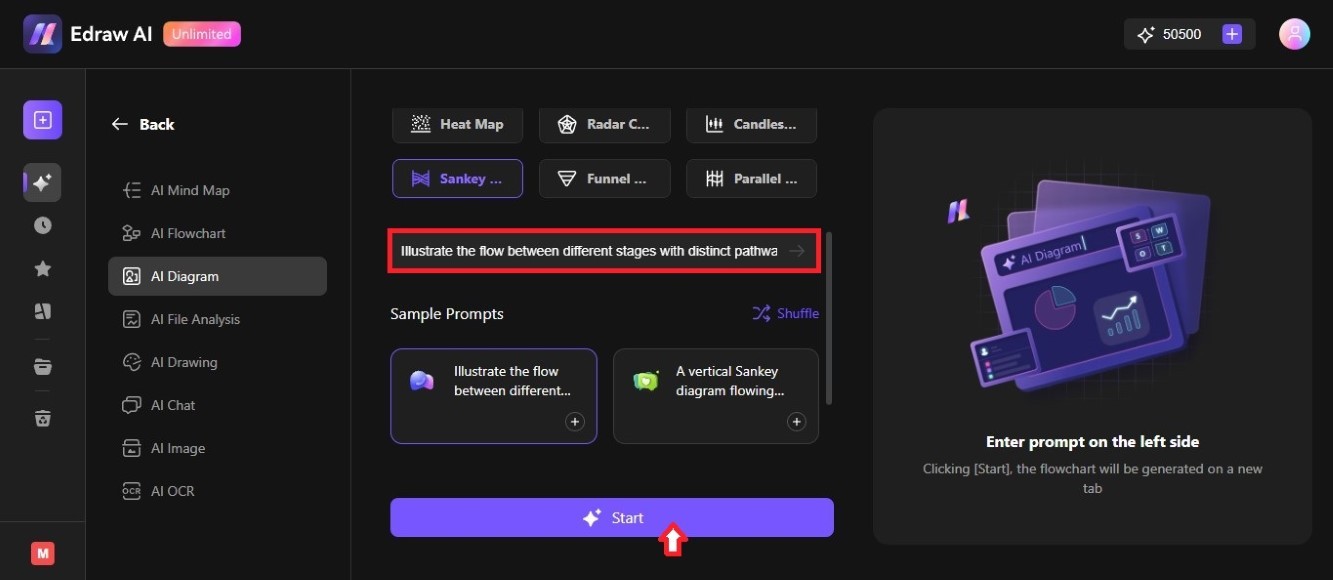
Step ❸
Enter a new prompt in the textbox or select an example in the Sample Prompts section. Then, click Start to generate the Sankey diagram using the AI Diagram Generator.
Step ❹
A preview of the AI-generated Sankey diagram will be available on the right side of the interface. Click Edit in Canvas to open it on a new tab.
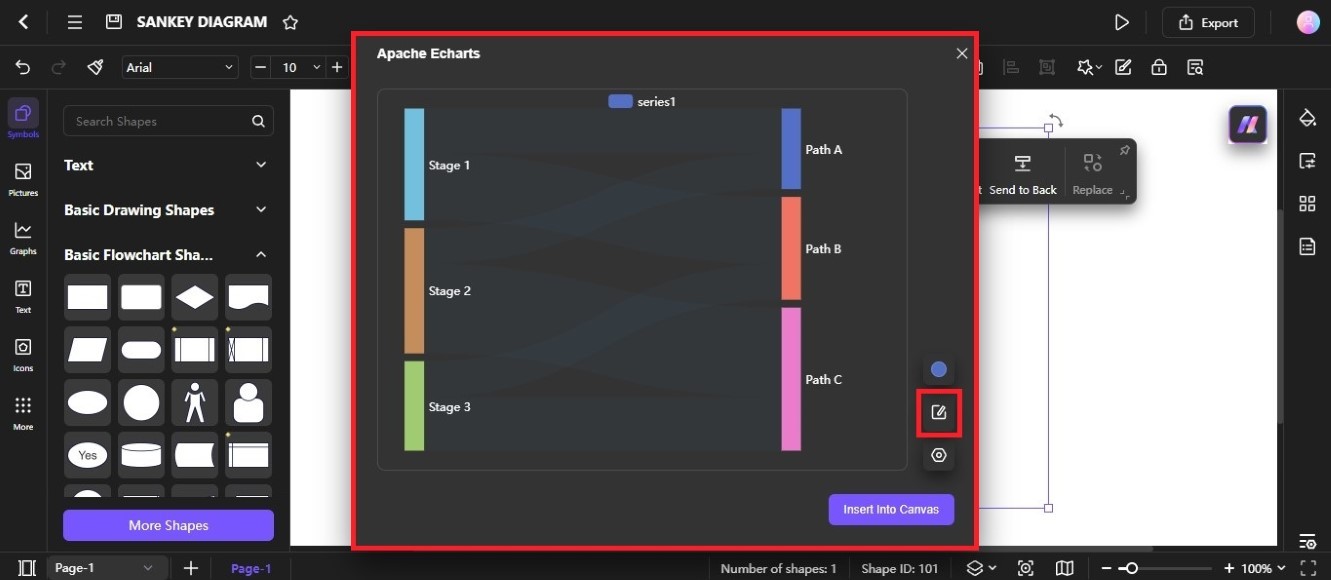
Step ❺
Double-click the Sankey diagram in the canvas. Then, click the Edit Data icon from the Apache Echarts pop-up window. Next, enter the new texts and numerical values on the table, then click Insert into Canvas to apply changes.