Edraw.AI User Guides
-
Getting Started
-
Diagram from Scratch
-
Files Operation
-
Shapes Operation
-
Import Data to Make a Chart
-
Format and Style
-
Insert Object
-
View the Diagram
-
-
Mind Map from Scratch
-
Insert Objects
-
Topics Operation
-
Files Operations
-
View a Mind Map
-
Outline Mode
-
Theme and Style
-
-
Create with Templates
-
Create with AI
-
AI Image Tools
-
AI Diagram
-
AI File Analysis
- AI Chat
- AI OCR
- AI Flowchart
- AI Mind Map
- AI Drawing
-
-
Project Management
Change Chart Type
Edraw.AI can help you change chart types easily. Instead of making different charts, you can click a button to switch between them. This lets you quickly see how each chart type looks with your data and choose the best one for your needs. Also, this way, you can focus on analyzing your data rather than spending time on chart design. Here's how to change the chart type in Edraw.AI:
Step ❶
Select the chart on the editing canvas, then select the Type icon from the floating toolbar.
Step ❷
Scroll down to see the chart type most suitable to your data visualization needs. For example, if you want to compare values across different categories, you might choose a column chart.
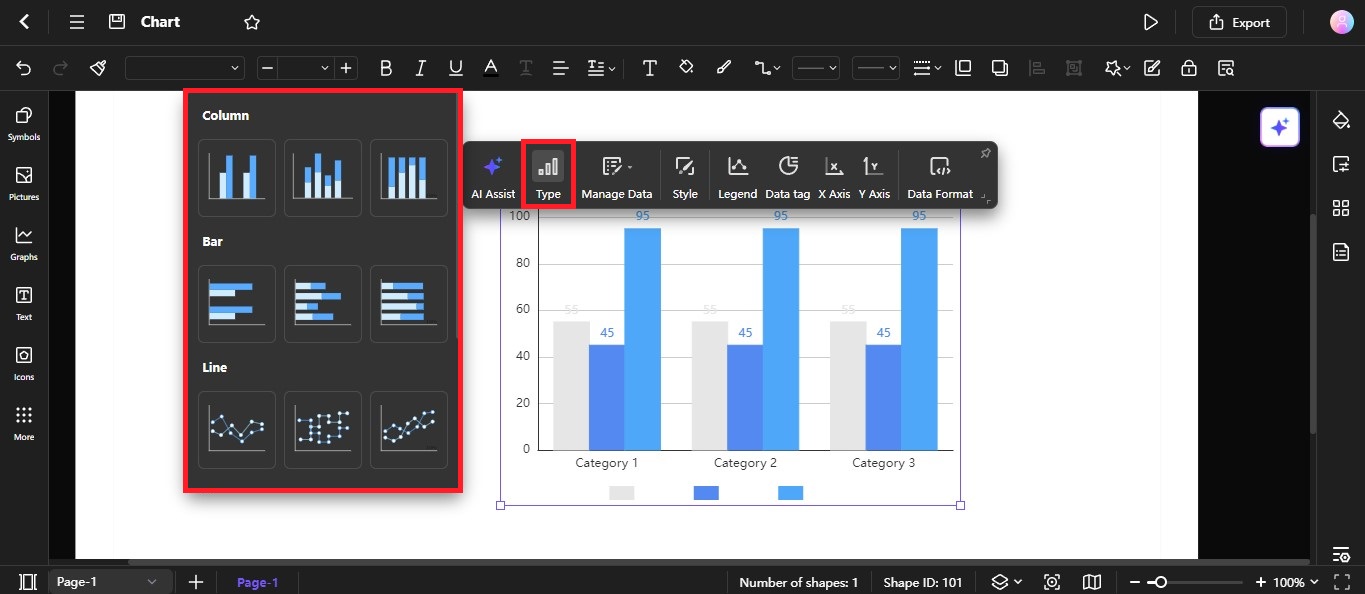
Step ❸
Select the chart type you prefer to apply to your data on the editing canvas. You can further customize the chart by adjusting settings like colors, labels, and axes using the available options.