Edraw.AI User Guides
-
Getting Started
-
Diagram from Scratch
-
Files Operation
-
Shapes Operation
-
Import Data to Make a Chart
-
Format and Style
-
Insert Object
-
View the Diagram
-
-
Mind Map from Scratch
-
Insert Objects
-
Topics Operation
-
Files Operations
-
View a Mind Map
-
Outline Mode
-
Theme and Style
-
-
Create with Templates
-
Create with AI
-
AI Image Tools
-
AI Diagram
-
AI File Analysis
- AI Chat
- AI OCR
- AI Flowchart
- AI Mind Map
- AI Drawing
-
-
Project Management
User Interface
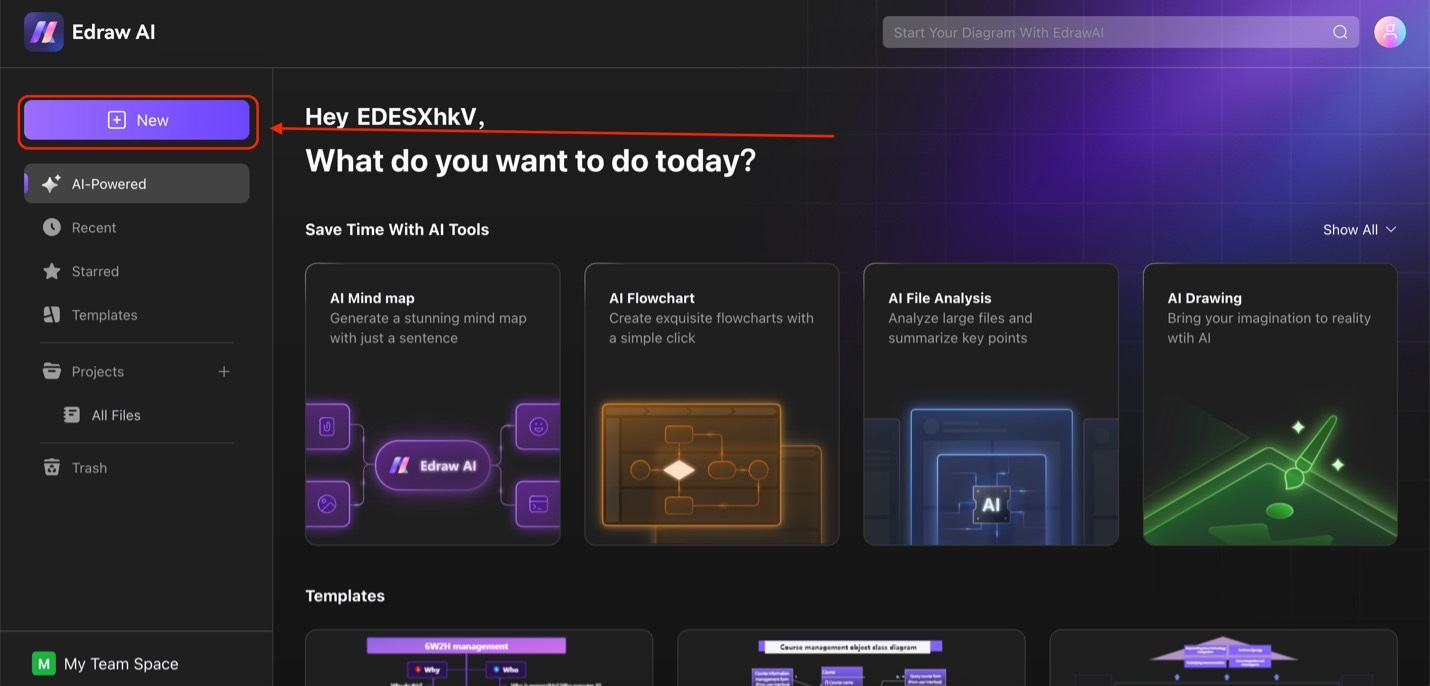
The user interface of Edraw.AI is designed with clarity and efficiency in mind. It provides a seamless experience for both novice and experienced users. Upon logging in, you’re greeted by an intuitive dashboard that offers quick access to your recent projects, templates, and key features. Click +New to create a diagram.
Index

The Main Workspace and Main Toolbar
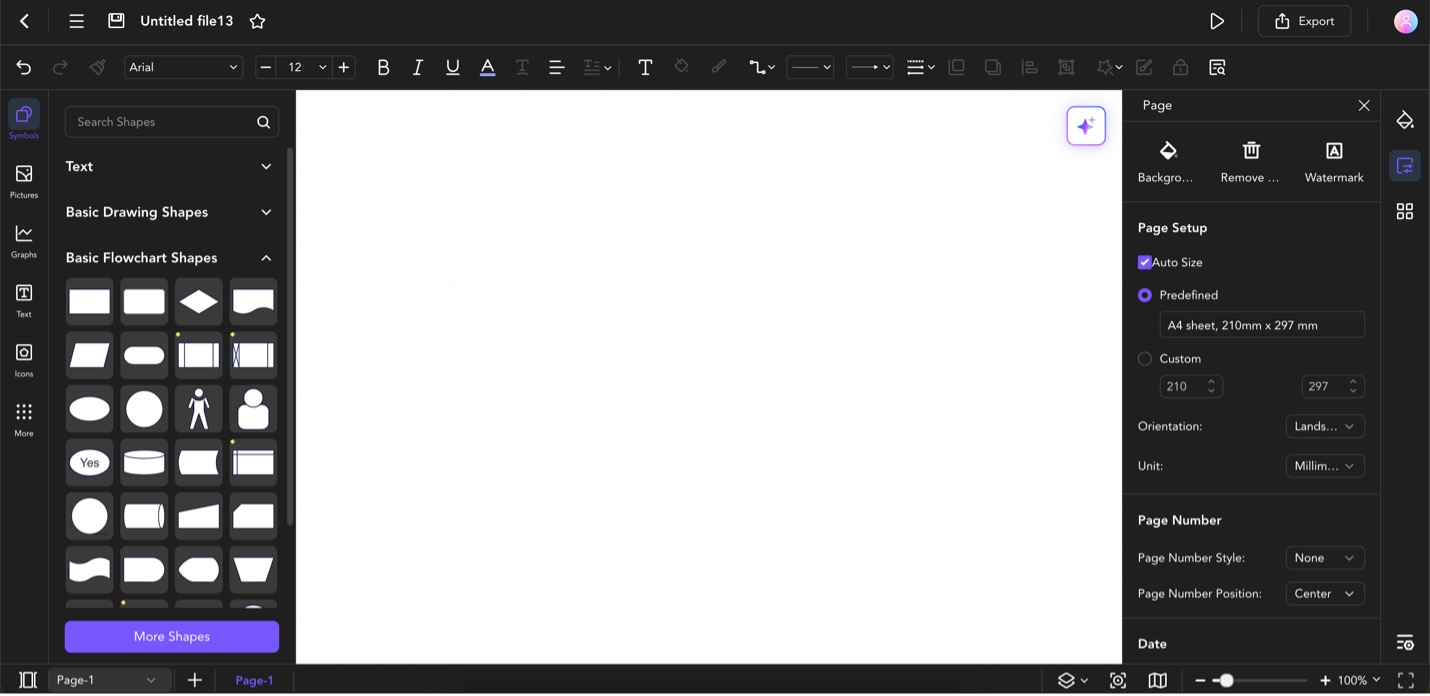
The main workspace has a customizable toolbar at the top for easy access to frequently used tools. This will let you edit text styles or connector colors easily, as well as some other options.
On the left, you’ll find a collapsible panel housing an extensive library of shapes, icons, and other elements. The right side displays properties and formatting options for selected objects. Of course, the main drawing area is located on the center page of the screen.

The Elements Panel
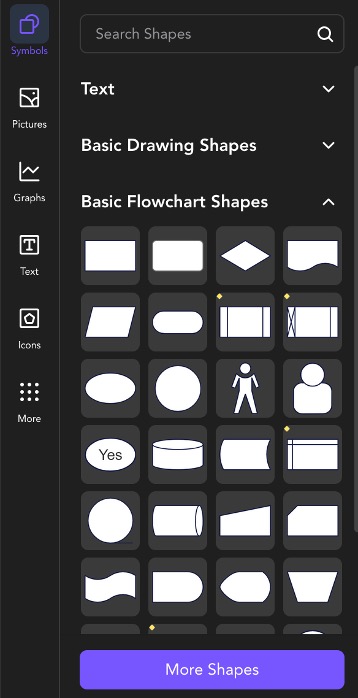
As mentioned earlier, the elements panel is located on the left side. It hosts icons, clipart, and other media to add to your diagrams and mind maps. Here’s what you can access from this panel:
- Shapes. It provides a wide variety of primary and complex shapes that can be used to build diagrams, flowcharts, and other visual elements.
- Pictures. Allows you to insert images into your diagrams.
- Graphs. Includes tools to create different types of graphs and charts.
- Texts. Offers text boxes and formatting options to add and customize text within your diagrams.
- Icons. A collection of icons that can be inserted into your diagrams to represent different concepts, actions, or categories.
- Research and Other Tools (under “More”). It provides access to additional resources like research tools and other advanced features that can further enrich your diagrams with relevant information.

The Formatting and Customization Panel
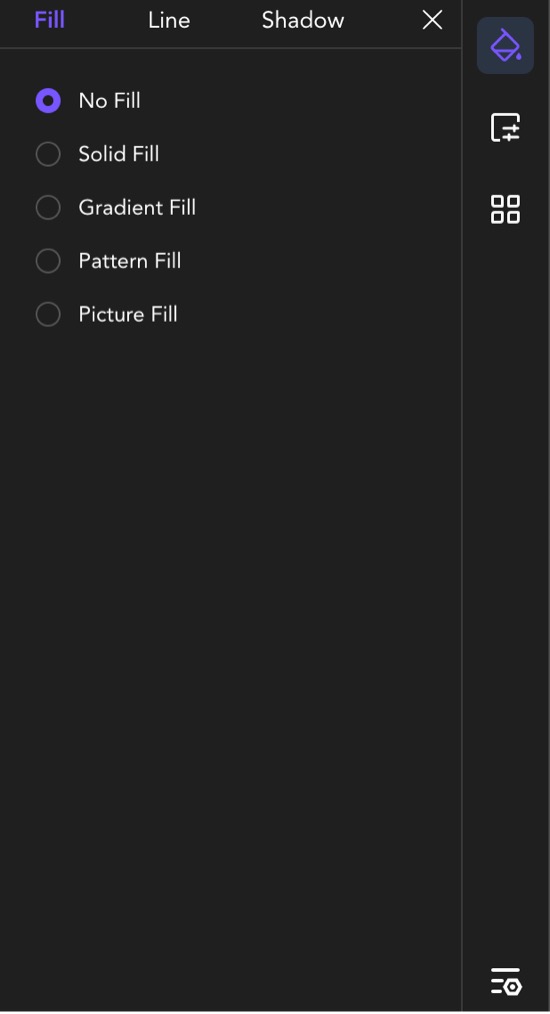
The Formatting and Customization Panel in Edraw.AI is where you can fine-tune the appearance of your diagrams. This panel offers a range of tools to adjust styles, modify page settings, and apply themes, allowing you to create polished and visually consistent diagrams easily. Here’s what you can access from this menu:
- Style
- Fill. Customize the fill color or pattern of shapes and elements.
- Line. Adjust line styles, thickness, and colors to define boundaries and connections.
- Shadow. Add or modify shadows to create depth and enhance the visual impact of your elements.
- Page Settings
- Background. Set or change the background color or image of your diagram.
- Watermark. Add a watermark to protect or brand your diagrams.
- Remove Background. Easily remove backgrounds from images or elements for a cleaner look.
- Page Setup.Configure page size, orientation, and margins for your diagrams.
- Page Number. Insert or customize page numbers for multi-page diagrams.
- Theme
- Change the Theme/Design of the Diagram. Quickly apply a different theme or design to your diagram for a cohesive look.
- Edit Connector Colors. Modify the color of connectors to match or contrast with other elements.
- Edit Text Colors. Adjust text colors to improve readability or match the overall theme.
- Edit Element Colors. Customize the color of individual elements to align with your design preferences.
