


 What's a radar chart generator?
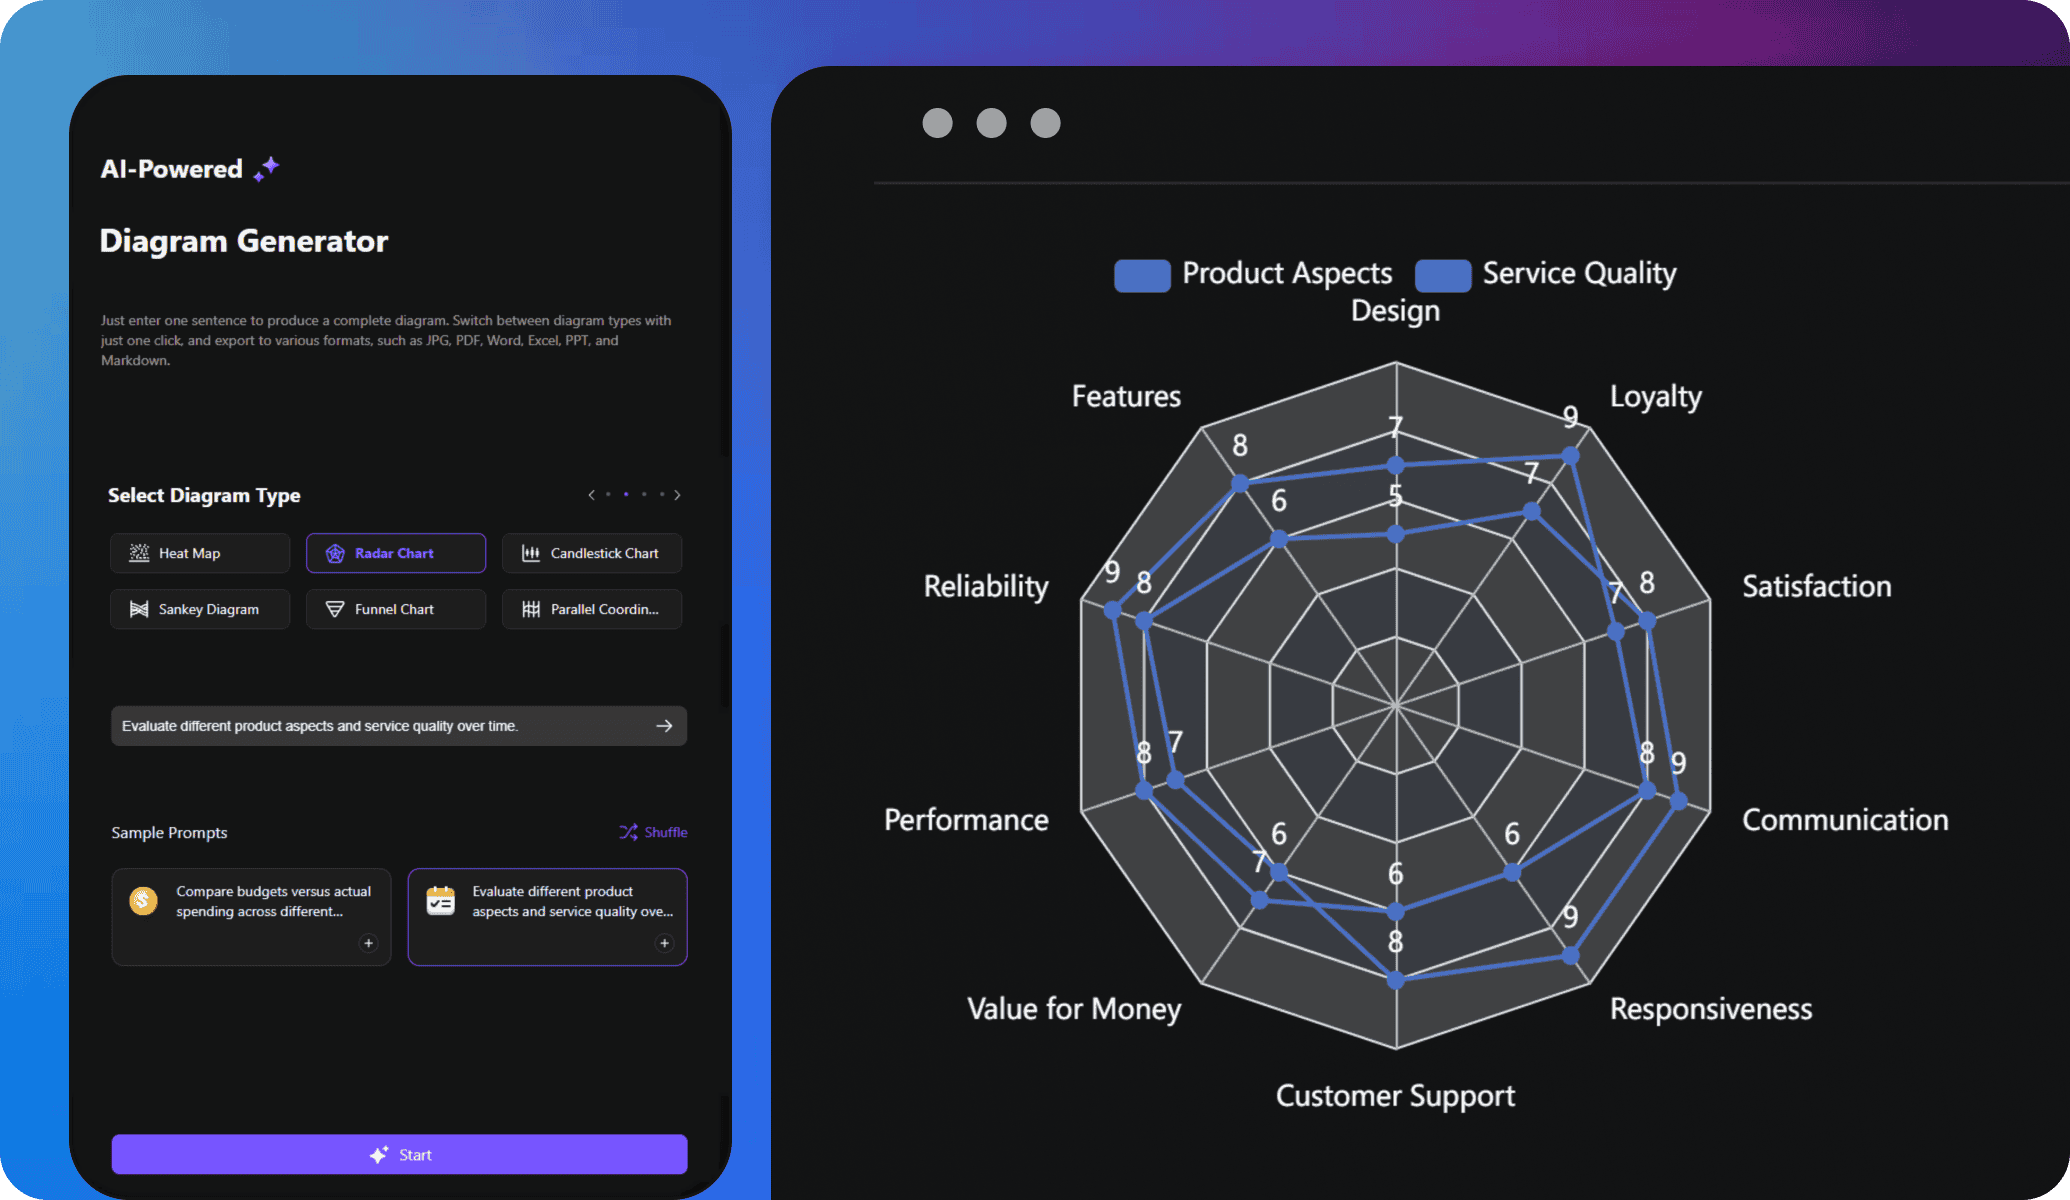
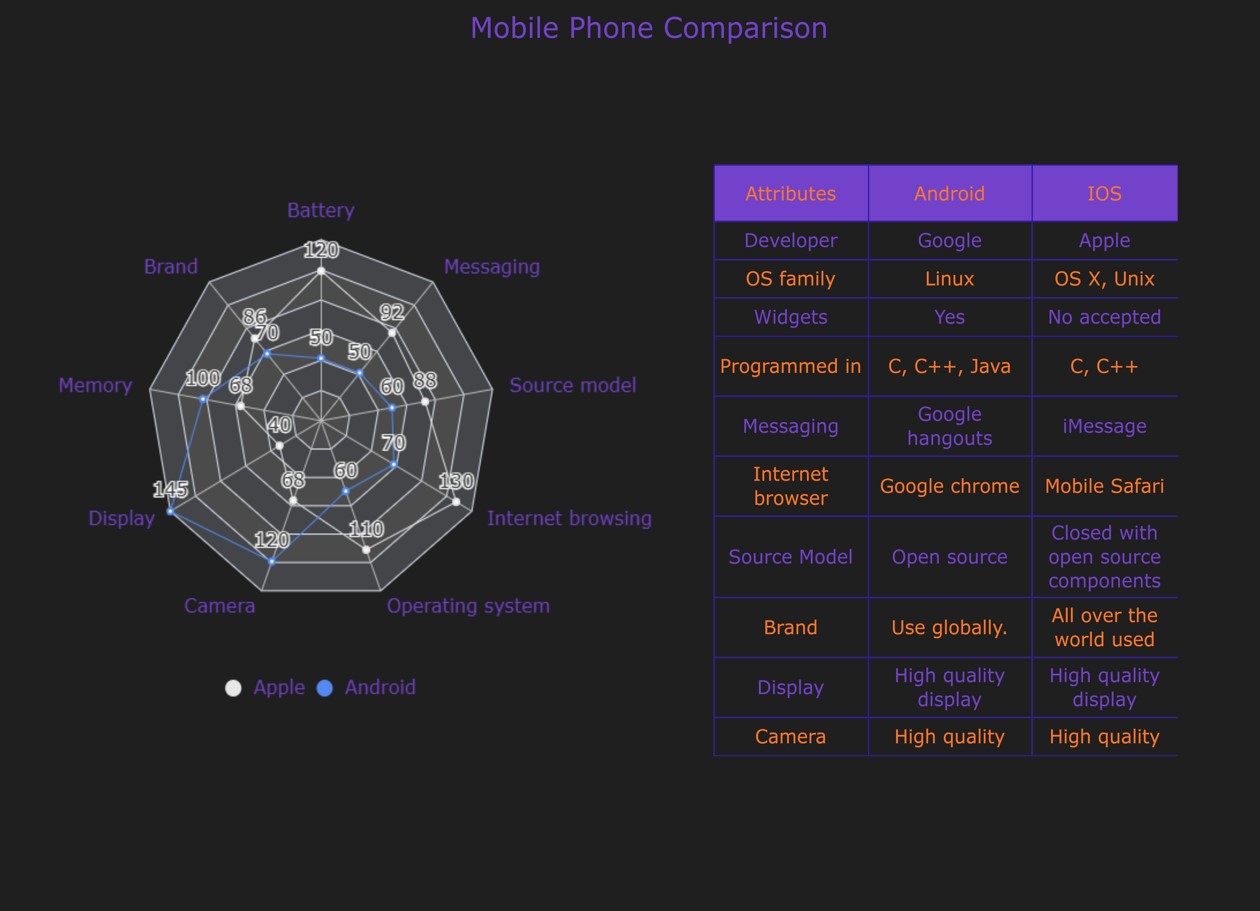
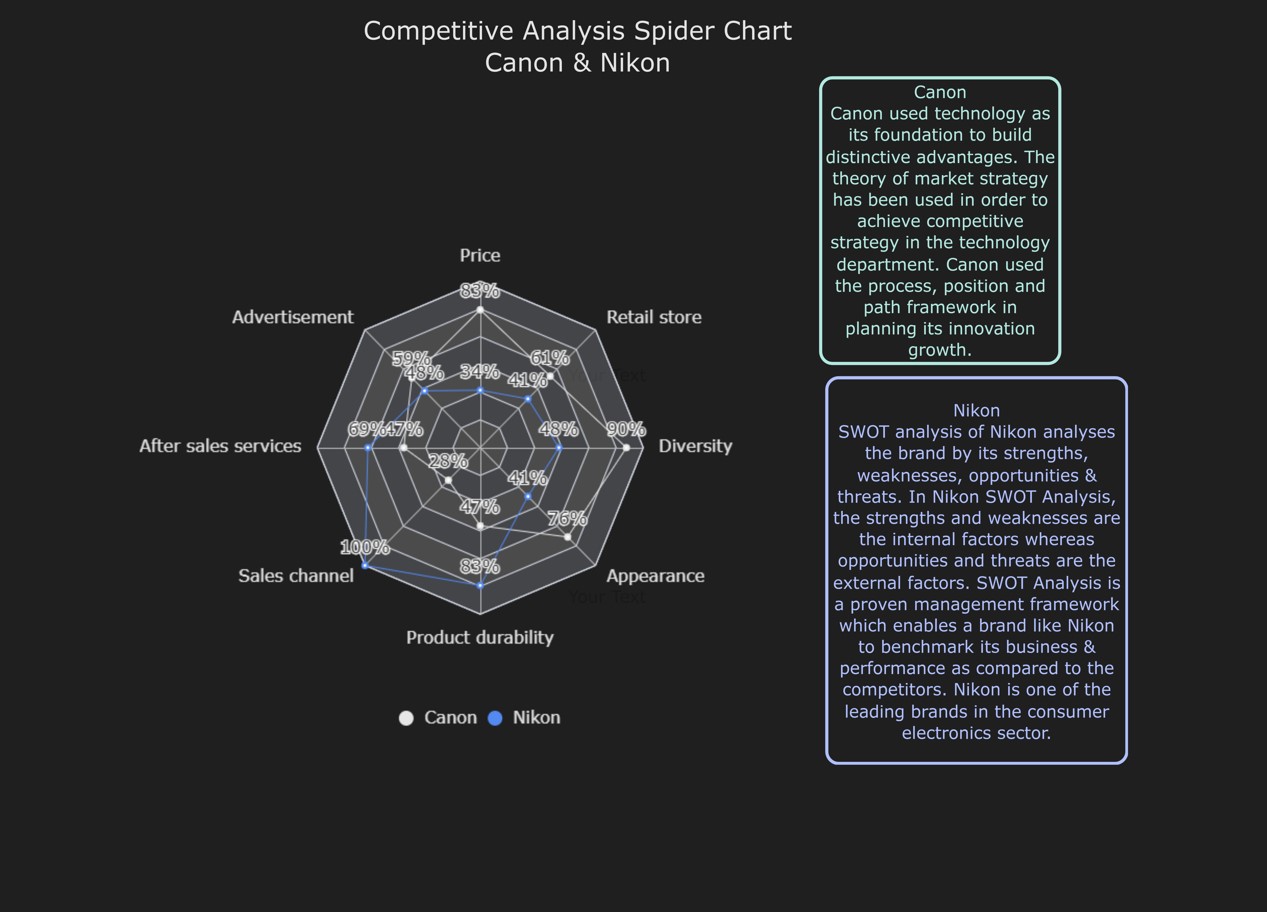
A radar chart generator creates visual representations of data across multiple variables using your prompts. It displays the data on a circular grid with axes radiating from a central point.
What are some other tools of Exraw.AI?
Edraw.AI is a complete diagramming package featuring smart AI tools like a slide generator, diagramming generator, file analysis, and chatbot. You are free to use these functions to streamline routine tasks and stay productive.
How can I customize my radar chart in Edraw.AI?
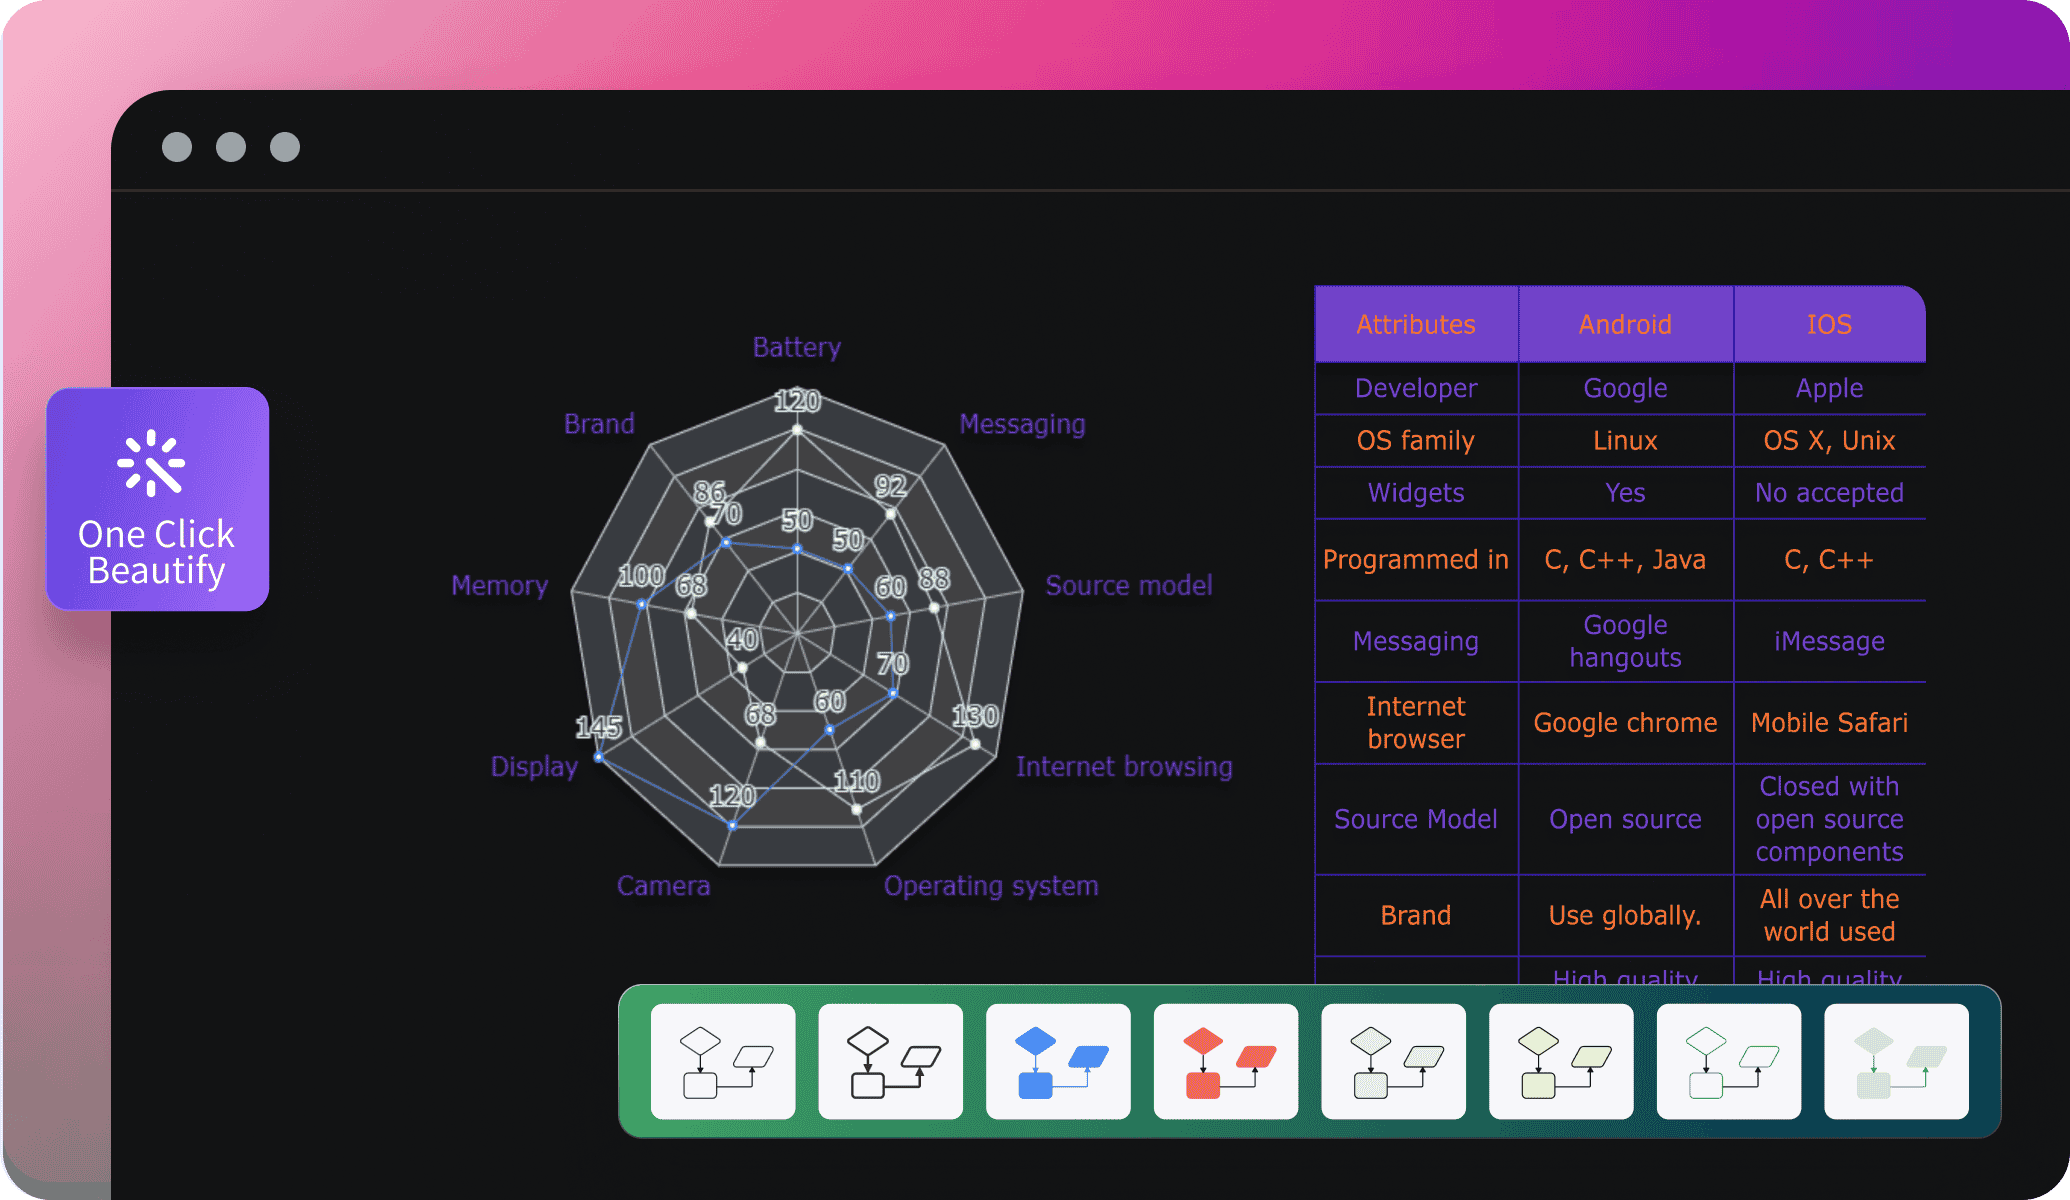
You can customize your radar chart by adjusting colors, axis labels, grid styles, and adding data points. Edraw.AI allows you to change chart dimensions, add annotations, and apply various themes to make your chart presentable.
Can I collaborate with others on the radar chart?
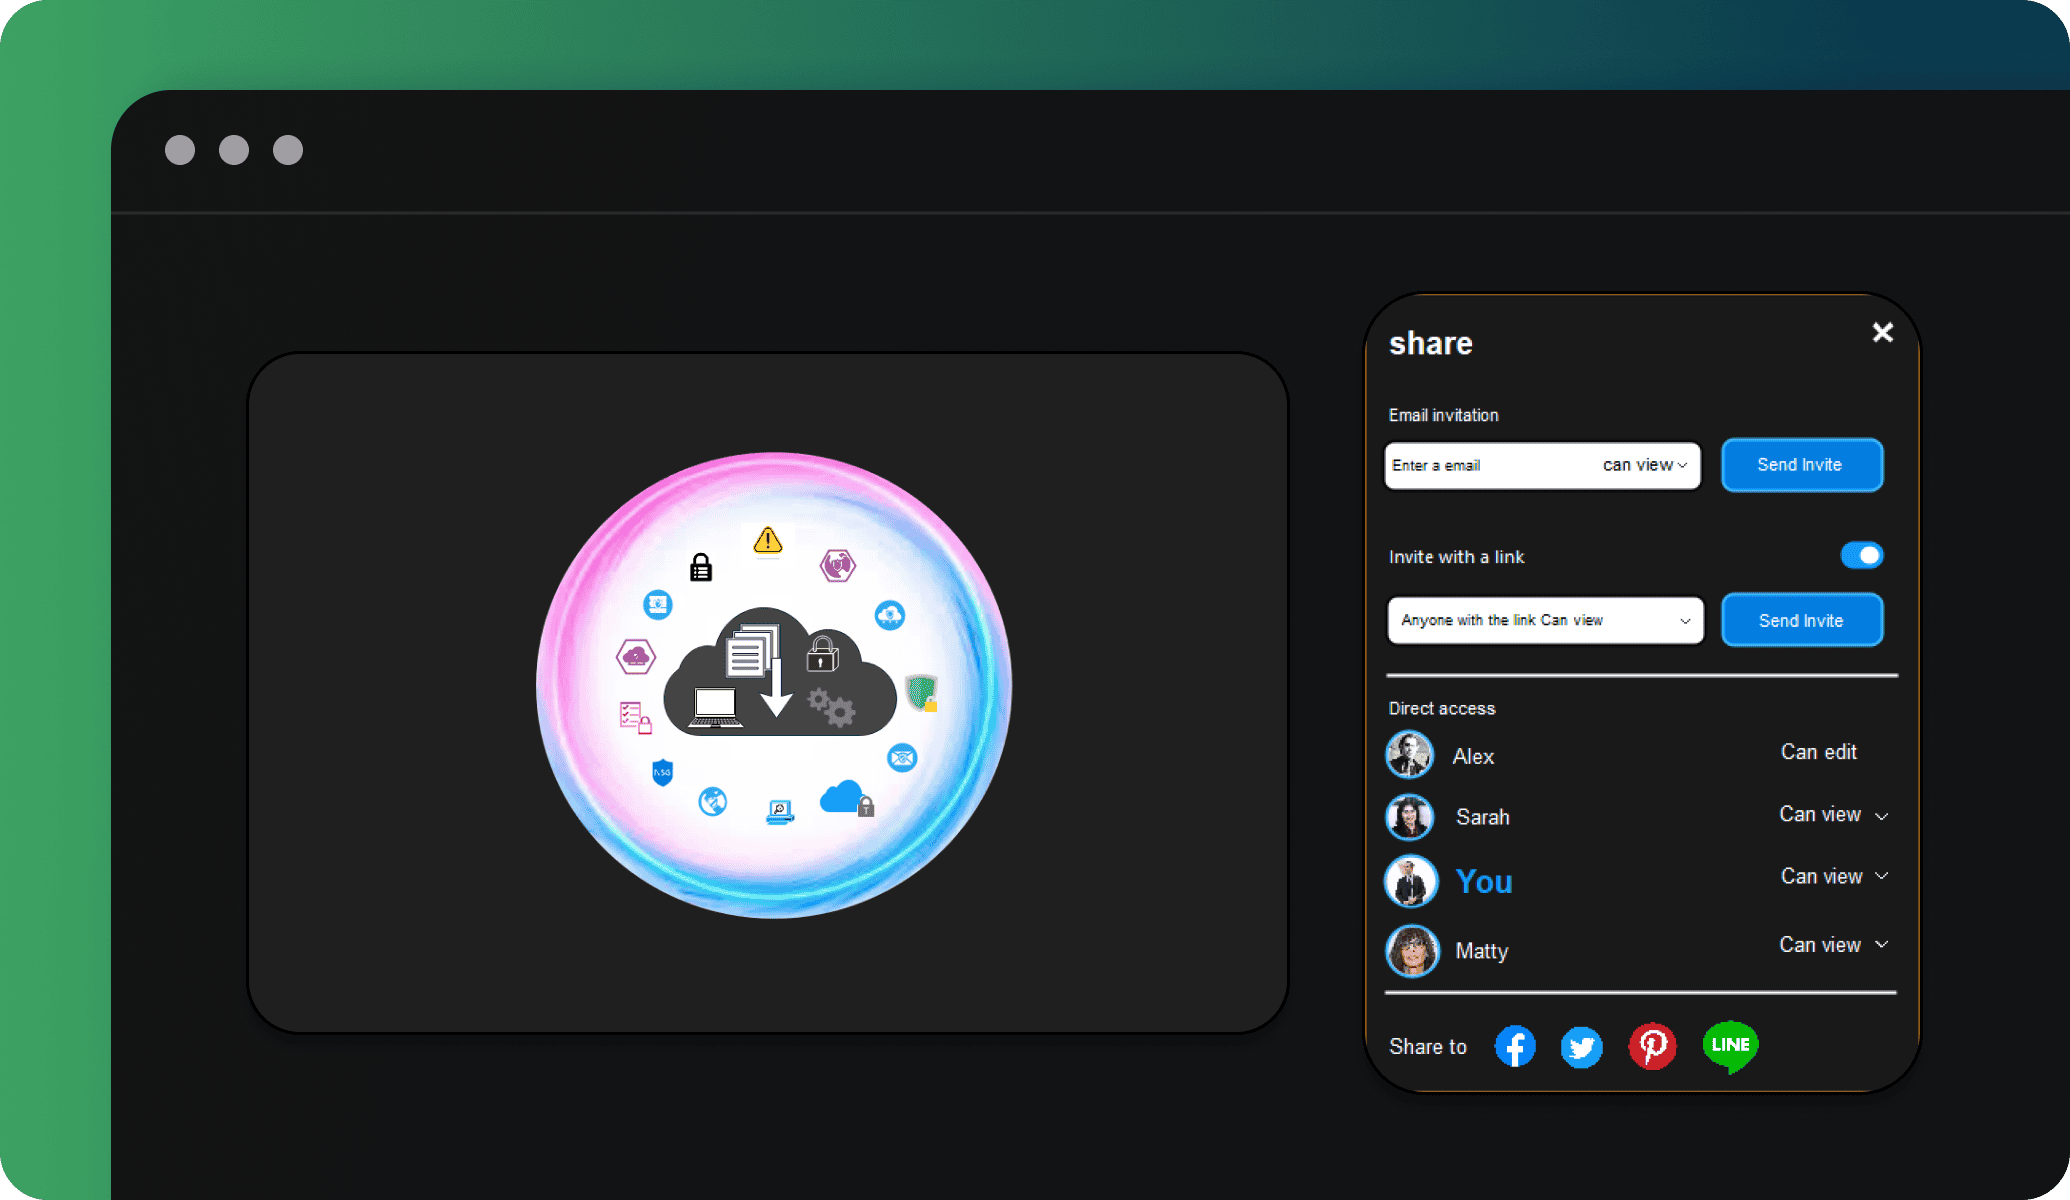
Yes, definitely! Edraw.AI allows you to collaborate with others on your radar chart. You can share the chart in real-time, enabling others to view, comment, or edit it. Our tool is designed to make teamwork efficient, especially for group data analysis projects.