


 What is a scatter plot generator?
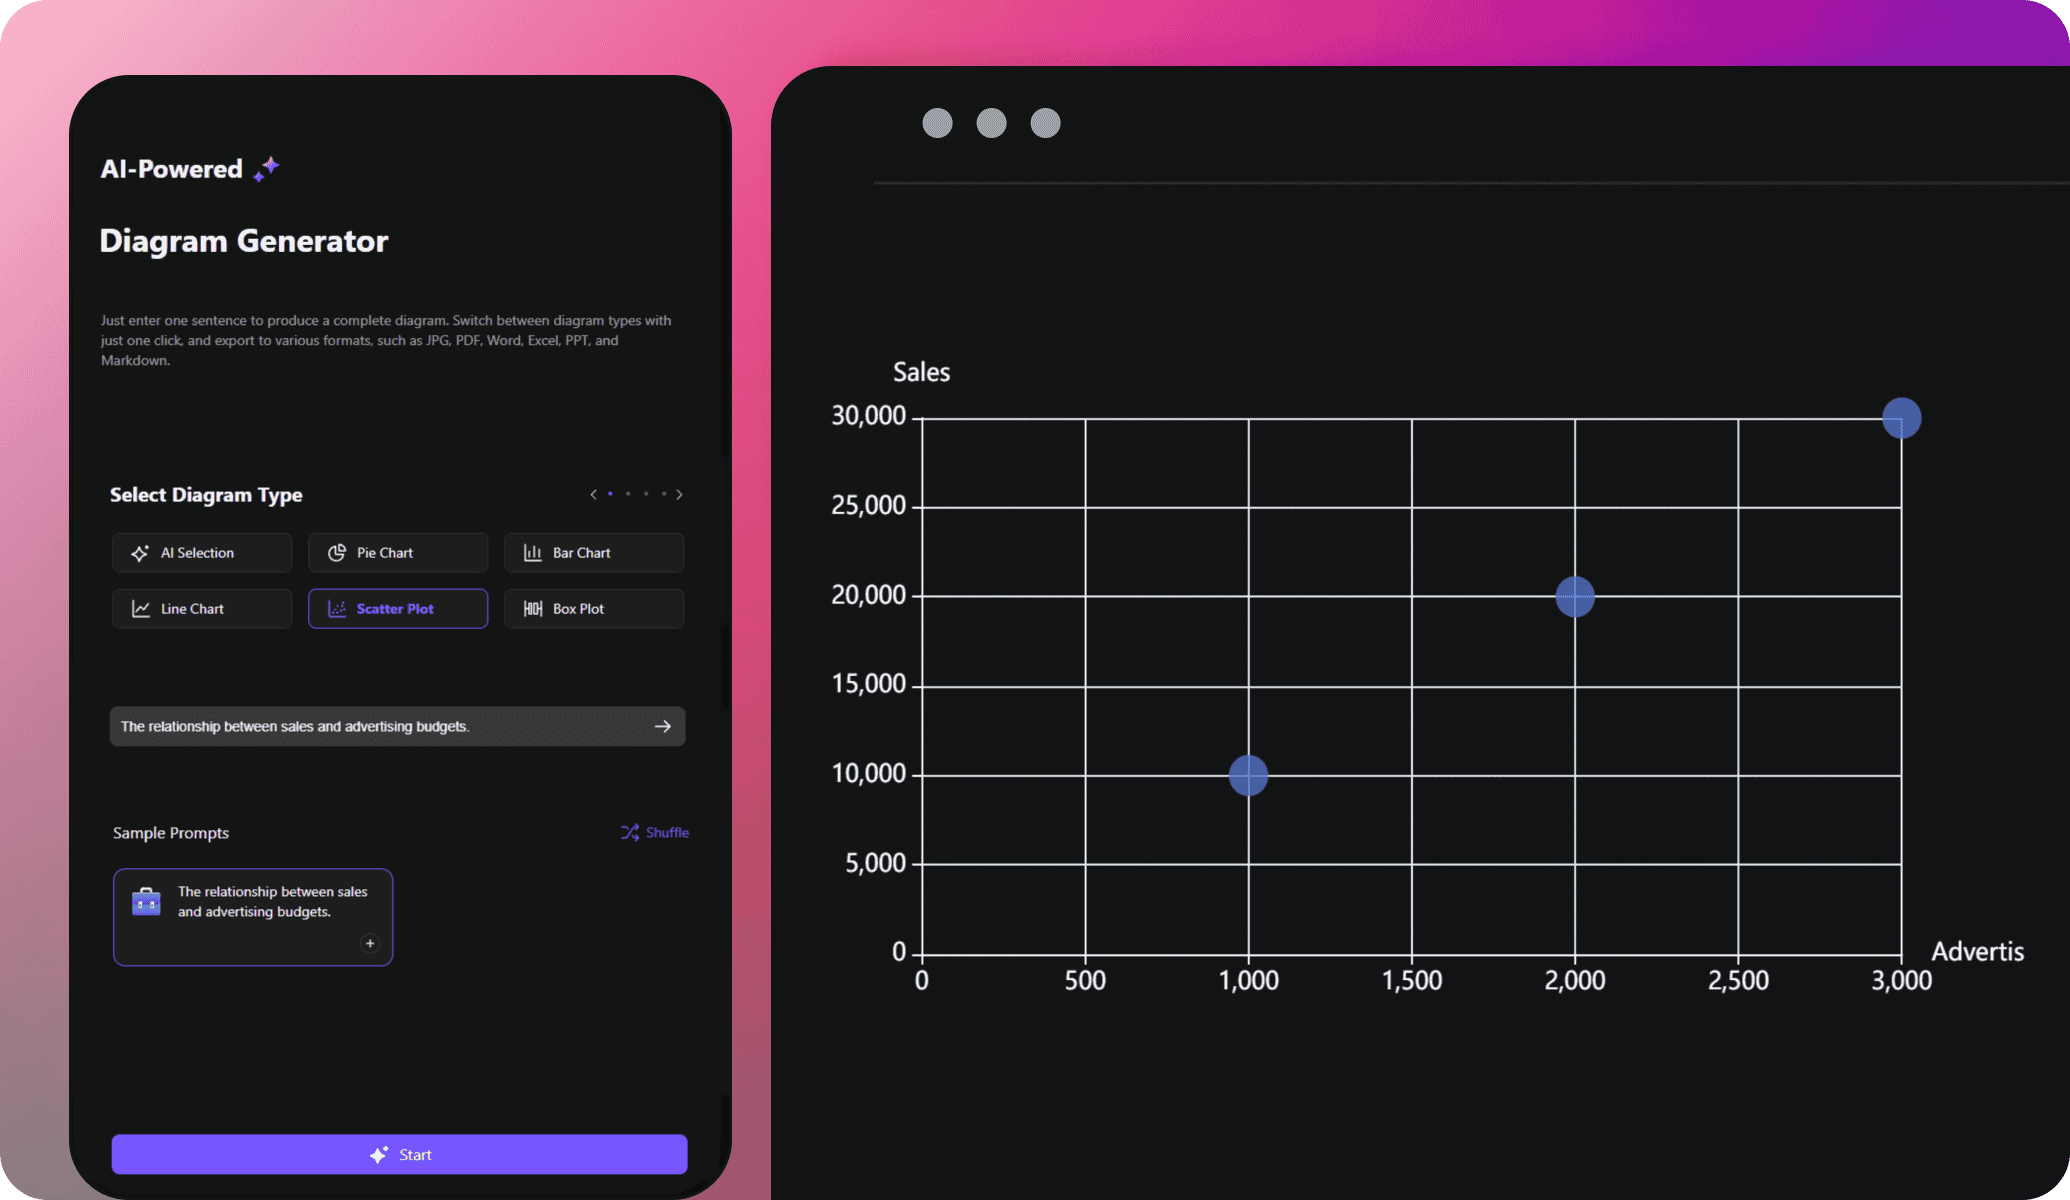
A scatter plot generator uses AI algorithms to create diagrams from user prompts. It asks users to enter their diagram requirements as text descriptions, uses machine learning algorithms to process them, and produces accurate scatter plots accordingly.
What other tools does Edraw.AI have for scatter plot diagrams?
With Edraw.AI, you can run a quick chart analysis on your scatter plot diagram. It helps you identify anomalies and predict trends. Get quick summaries for your diagrams and compare data sets. Manage data from the table, import your data sheets, or export the table in CSV or XLSX format.
Is there any other way to create a scatter plot diagram with Edraw.AI?
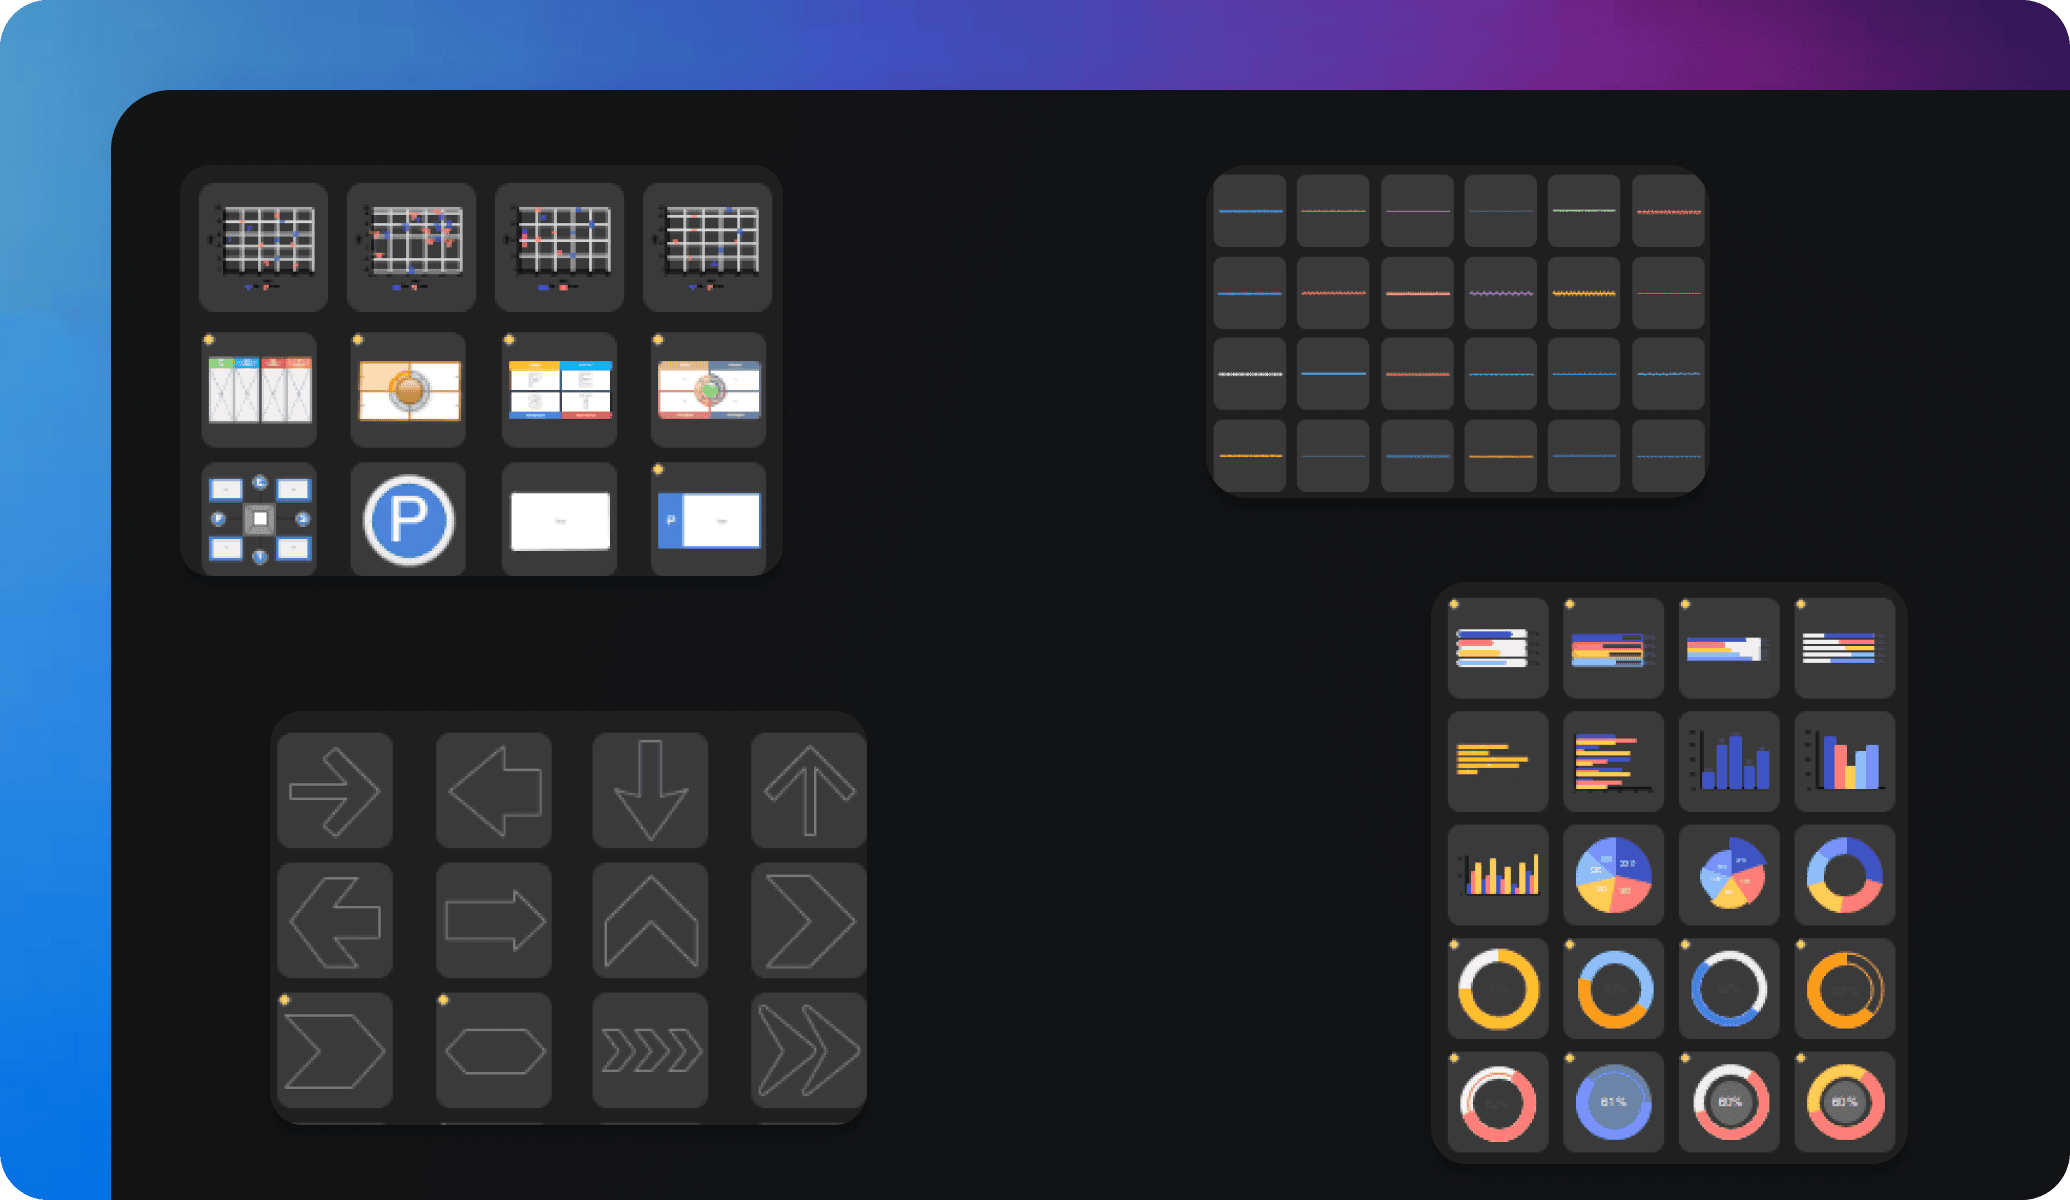
Yes of course! You can use our ready-to-edit scatter plot templates to streamline diagram creation. Our software also gives you the option to open a blank canvas and create a scatter plot diagram manually from scratch. Simply import data, add data labels, and you are done.
How to edit a scatter plot diagram in Edraw.AI?
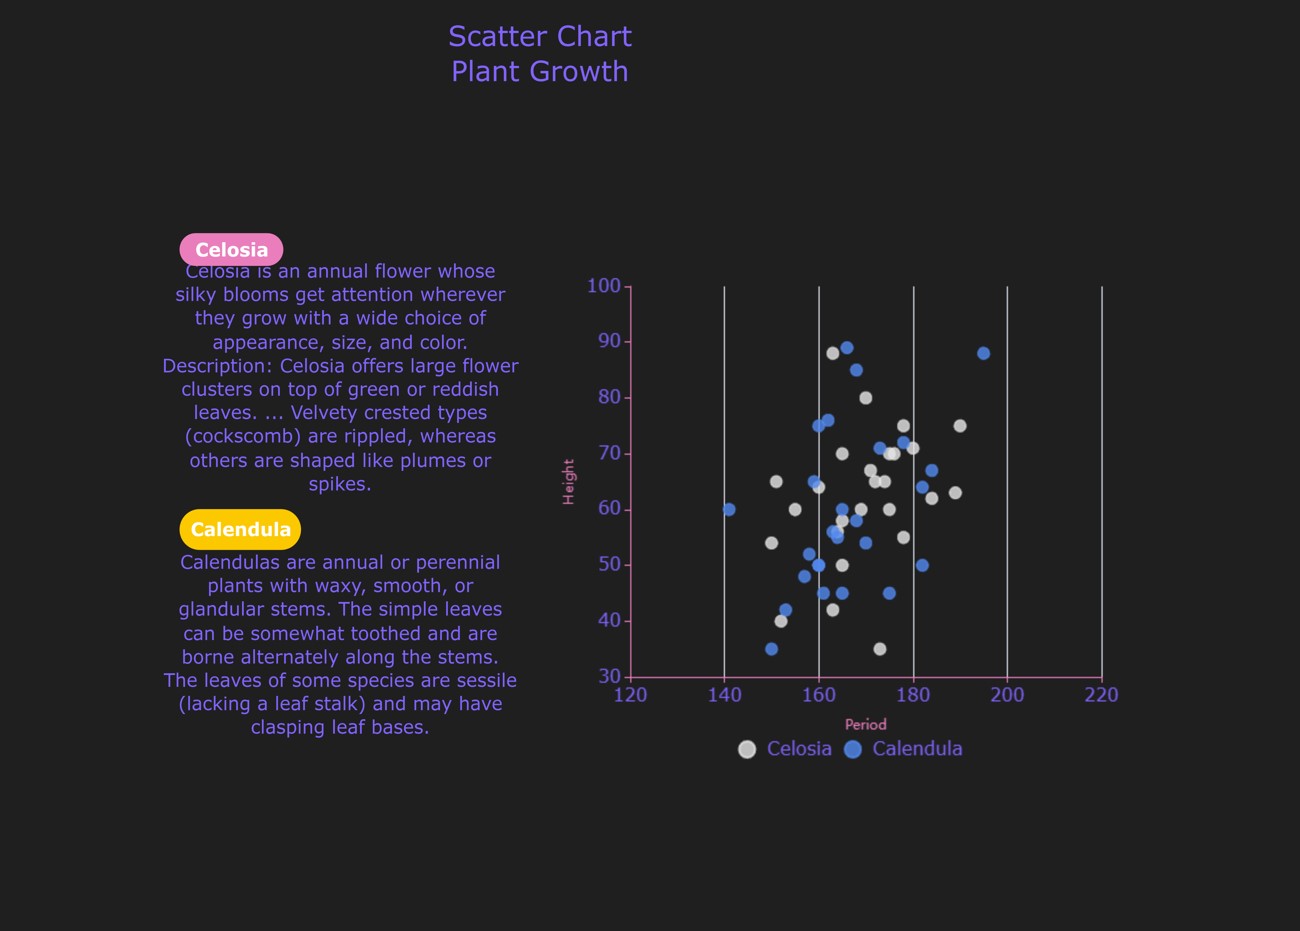
Open your scatter plot diagram in the Edraw.AI canvas. From here, you can add symbols from the left sidebar and customize page/theme settings from the right. Select your diagram to customize font details, text labels, and more from the floating menu.