
It does not matter how important information you are going to present in front of the target audience, they will not take any special interest or understand it completely until it is well-organized. This is where a table lends you a helping hand.
For example, a table helps you present complex and more detailed data in an organized manner so that each viewer can see the results quickly. In addition, this diagram assists you in removing numeric data from your document or presentation and highlights patterns or trends to make the stuff more readable and understandable for viewers.
Various tools are available in the market that can help you create tables, but PowerPoint has a special place among them all. Several reasons are associated with this fact, such as PowerPoint is free to use, offers easy navigation, makes the diagram fully customizable, and most importantly, it is an open-source program, so you can seek help online easily at any time you want.
If you are searching for how to make a table in Microsoft PowerPoint, in this article, we present a comprehensive guide on creating and formatting a table in PowerPoint.
In this article
How to Make and Format a Basic Table in Microsoft PowerPoint?
Let’s divide this part into two sections:
In this article
How to Create a Table in PowerPoint
There are seven different methods to add a table to your PowerPoint presentation. Let’s look at how each method helps you insert a table in the presentation. But before we proceed, let’s launch PowerPoint and open a blank presentation.
A Quick Overview
Method 1: Move Your Cursor to Choose Rows & Columns
It is a 3-step simple process.
Step 1
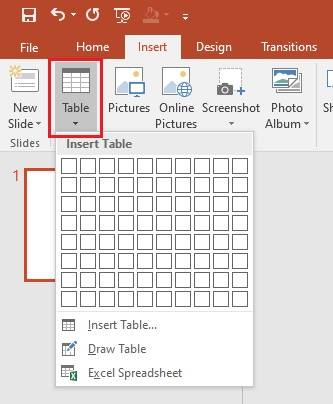
Go to the Insert menu and open the Table dropdown list, as shown below.
Step 2
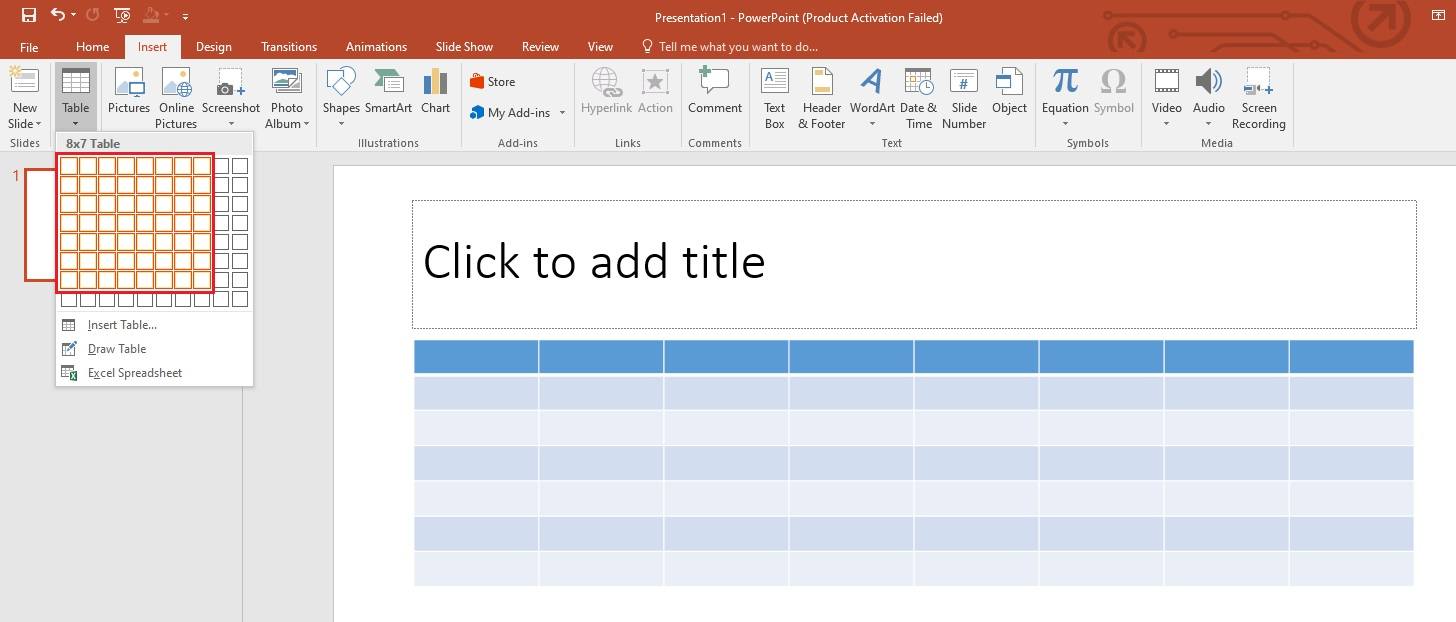
Now, move your cursor to select the desired number of rows and columns and click. Doing this will add a table instantly to your PowerPoint slide.
Step 3
Now, you can add data to the rows and columns of the table.
Method 2: Specify Rows and Columns
Follow the steps listed below.
Step 1
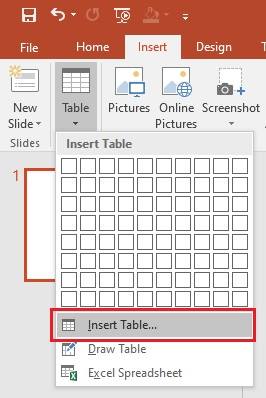
Go to Insert and tap on Insert Table.
Step 2
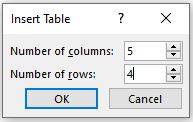
A new pop up - Insert Table - will appear on the window, as shown below. Here, enter the number of columns and rows you need for a table.
Step 3
Click OK and the table will be added to your slide, according to the rows and columns you have chosen in the previous step. We have chosen five columns and four rows in this example.

Method 3: Draw a Table
All you need to do is follow the steps below.
Step 1
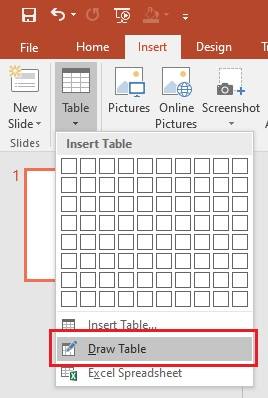
Inside the Insert tab and Table dropdown menu, click Draw Table, as shown below.
Step 2
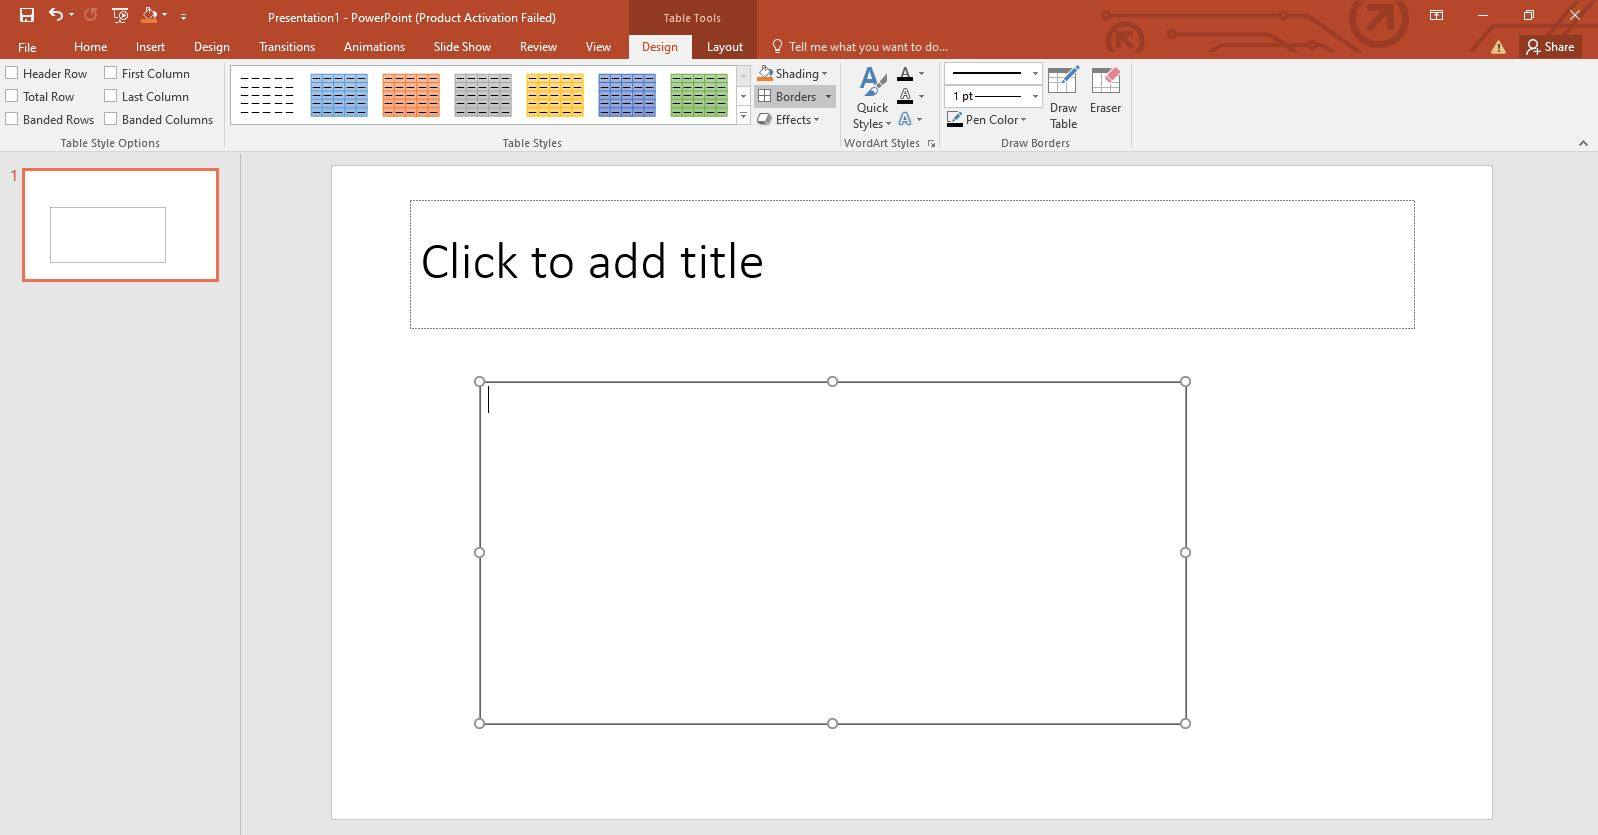
Now, press and hold the left-click button from the keyboard and drag the cursor to draw a single-cell table on the slide, as shown below.
Step 3
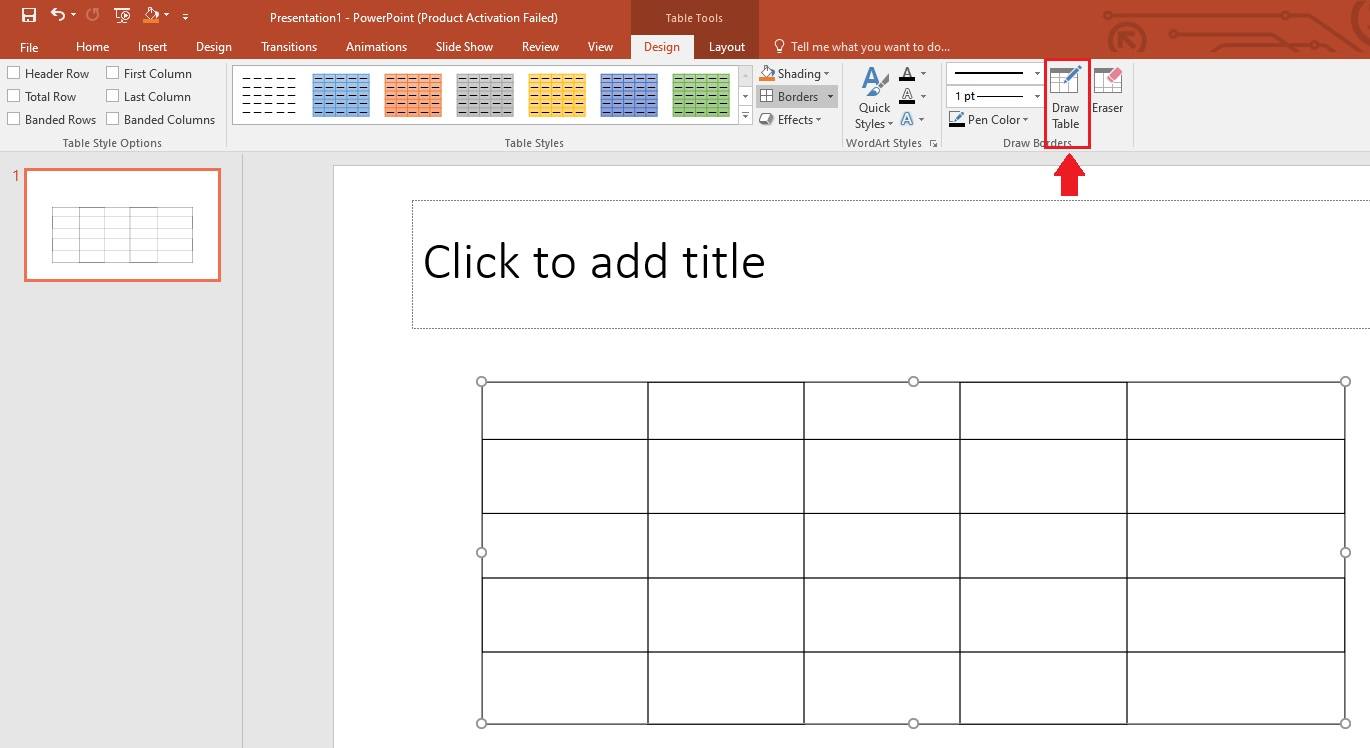
Tap on the Draw Table option inside the Design tab. Then, draw rows and columns with the help of the pencil.
Method 4: Make a Table from Spreadsheet
To make a table with this method, you only need to follow the two steps.
Step 1
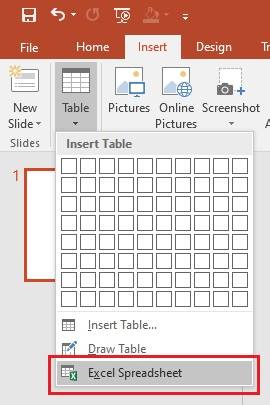
Choose Excel Spreadsheet after clicking on Insert>Table.
Step 2
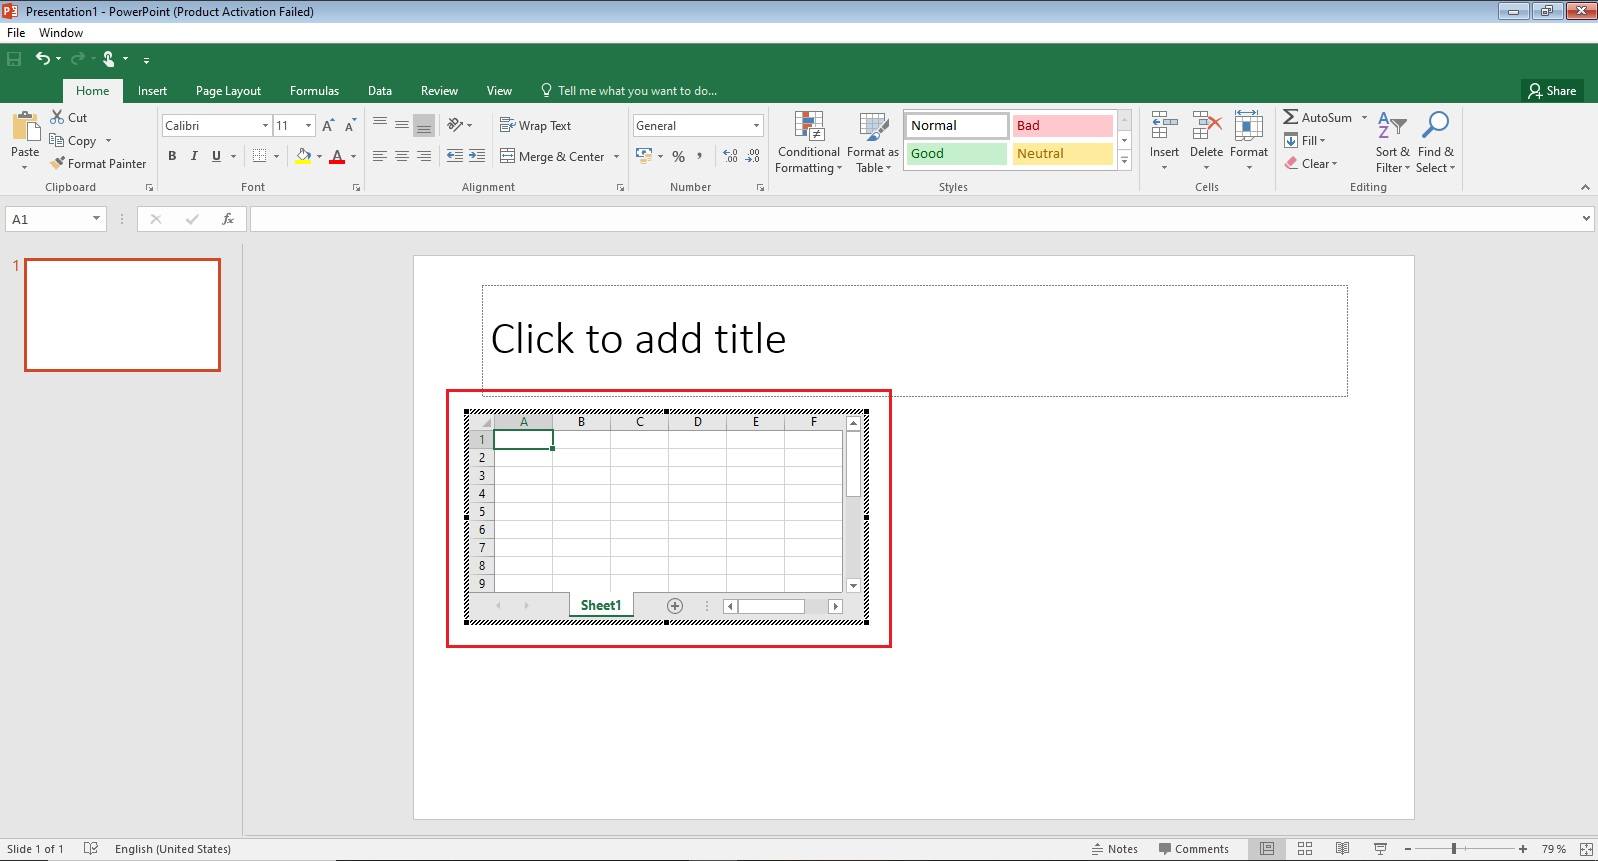
A new Excel spreadsheet will pop up in PowerPoint, as shown below. Enter the data in the sheet that you want to display or use in PowerPoint.
Method 5: Use the Table Icon on the Blank Slide
This method takes only 3 steps to insert a table.
Step 1
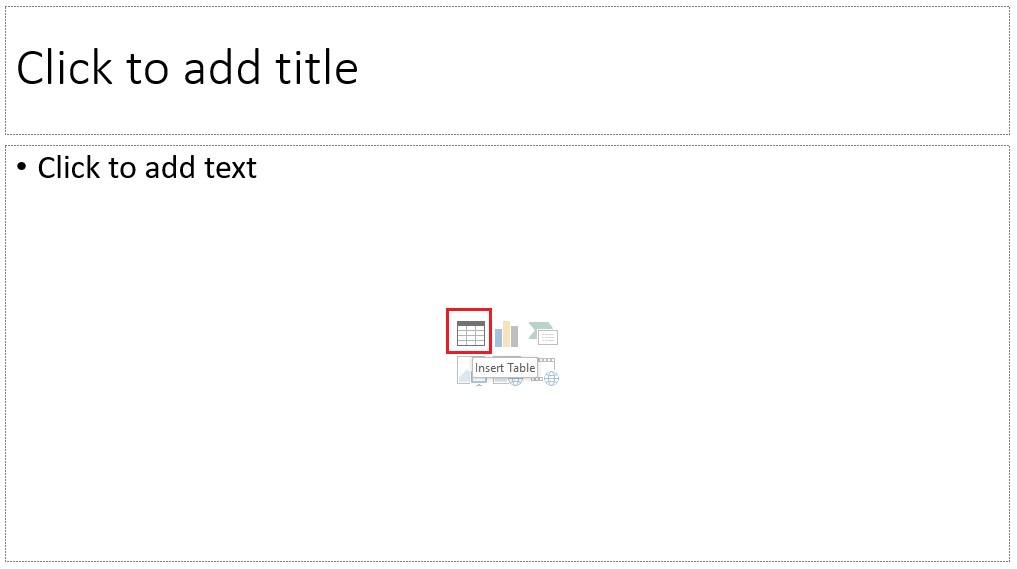
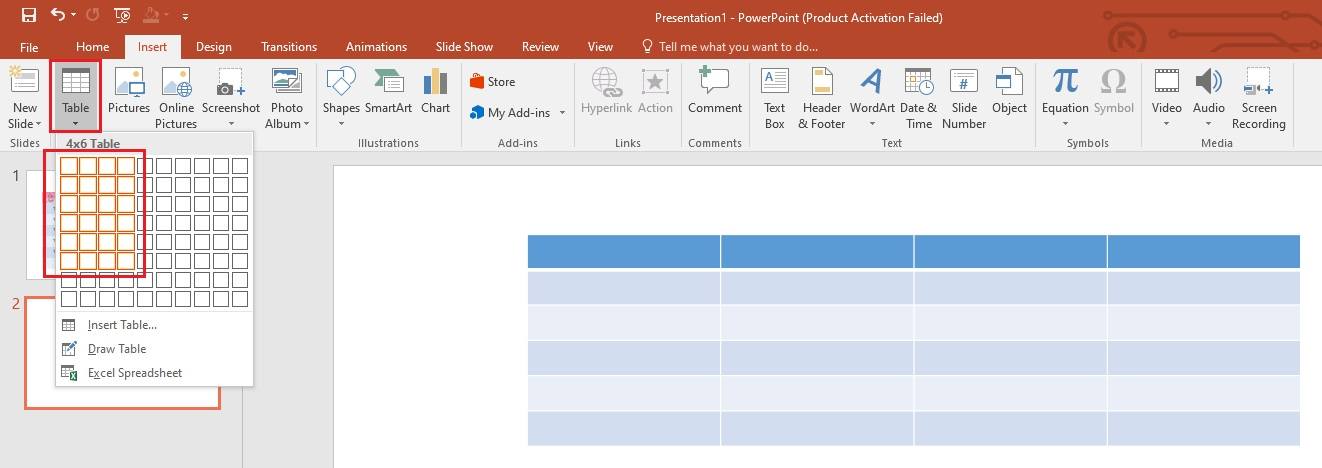
Click on the table icon displayed at the center of the slide, as shown below to create a table in PowerPoint.
Step 2
Now, PowerPoint will ask you to enter the number of rows and columns in the box. We have entered 5 columns and 6 rows in the image below.

Step 3
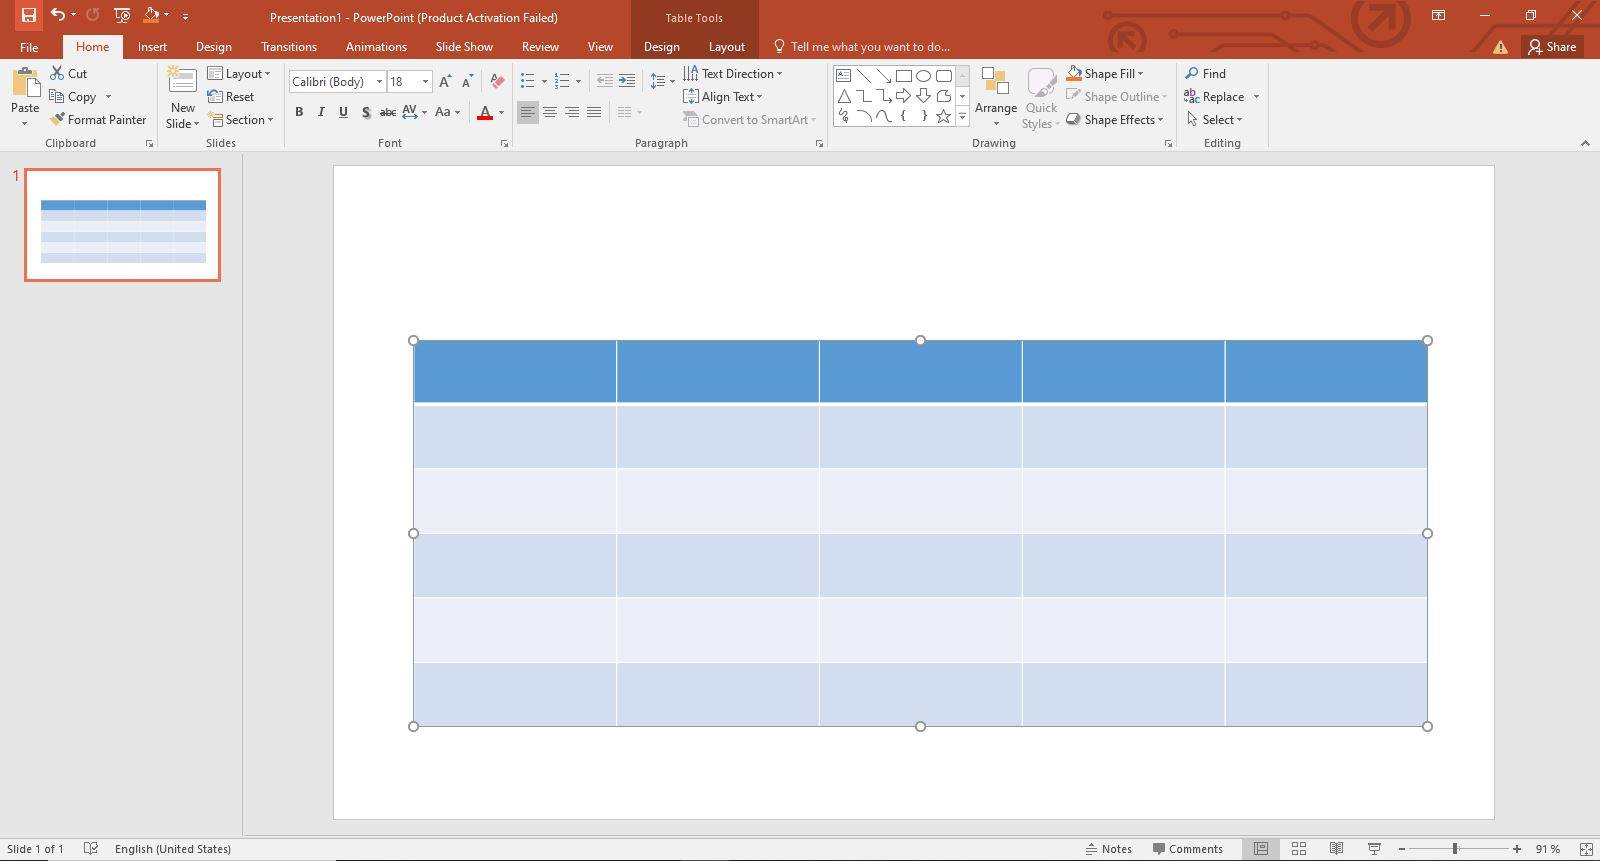
Press OK and the table will appear on your PowerPoint slide, as shown below.
Method 6: Copy and Paste the Table in PowerPoint
The two steps included in this method are as follows.
Step 1
Copy the table from Microsoft Word, Excel, or another PPT file.
Step 2
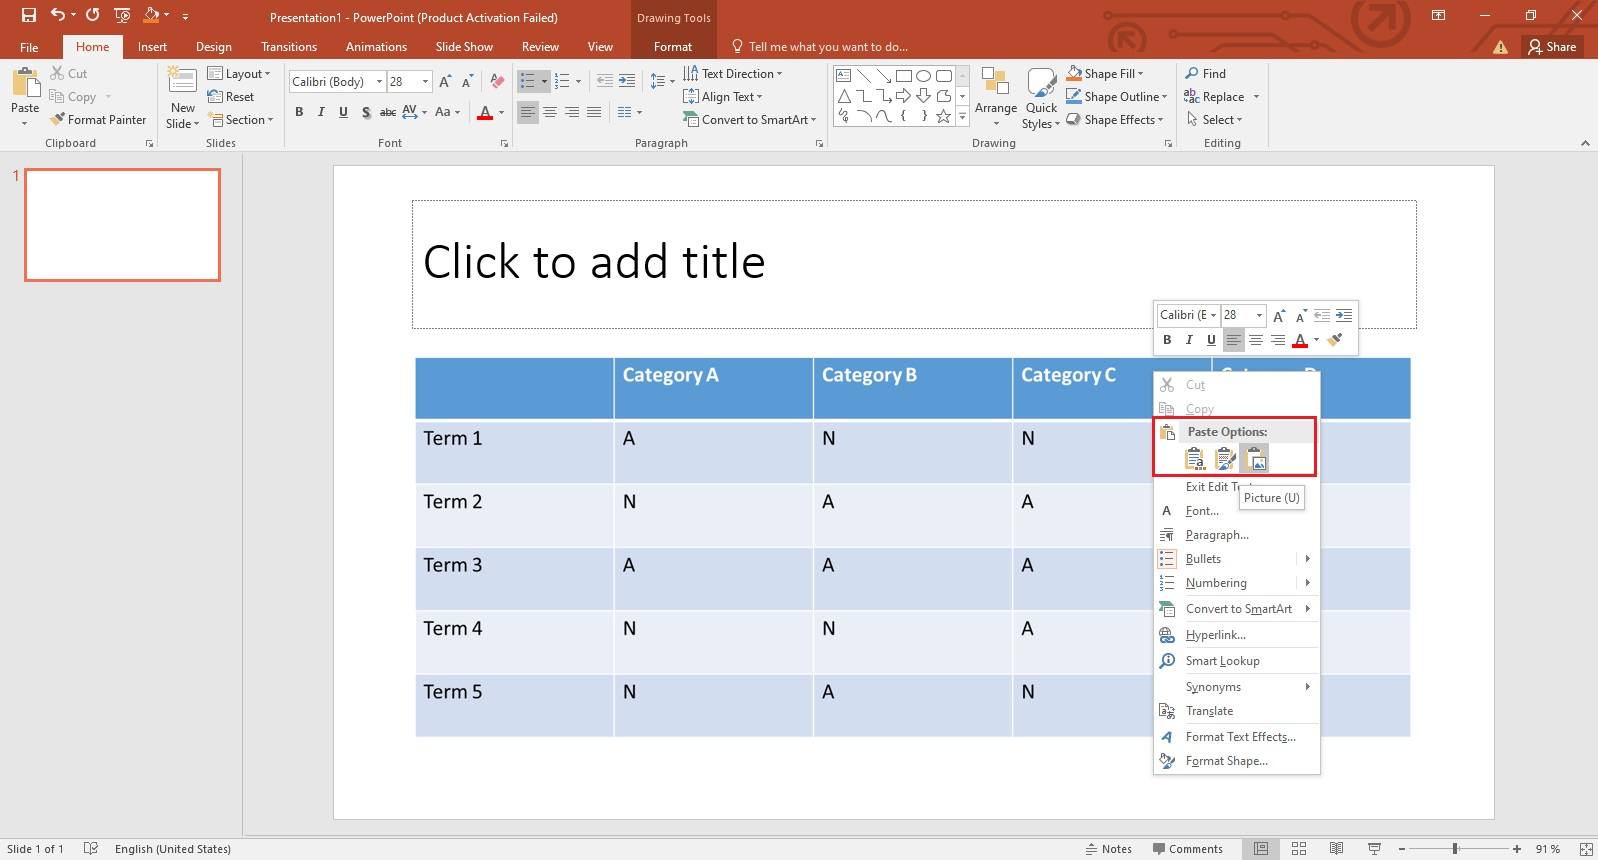
Now, right-click on the slide and paste the copied table into your PowerPoint presentation. Alternatively, you can press the CTRL+V keys from the keyboard.
Method 7: Make a Table with Ready-Made Templates
You can explore various online sources (such as SlideModel, Powerslides, Slides, and SlideUpLift) to find PowerPoint table templates. Using ready-made templates saves you a lot of time and helps you make effective tables to grab your audiences’ attention.
In this article
How to Format a Table in PowerPoint
In this article
Now that you are well familiar with how to make a table in Microsoft PowerPoint with different methods. It is time to learn how you can format a table once it is added to the PPT presentation.
How to Add Data to the Table?
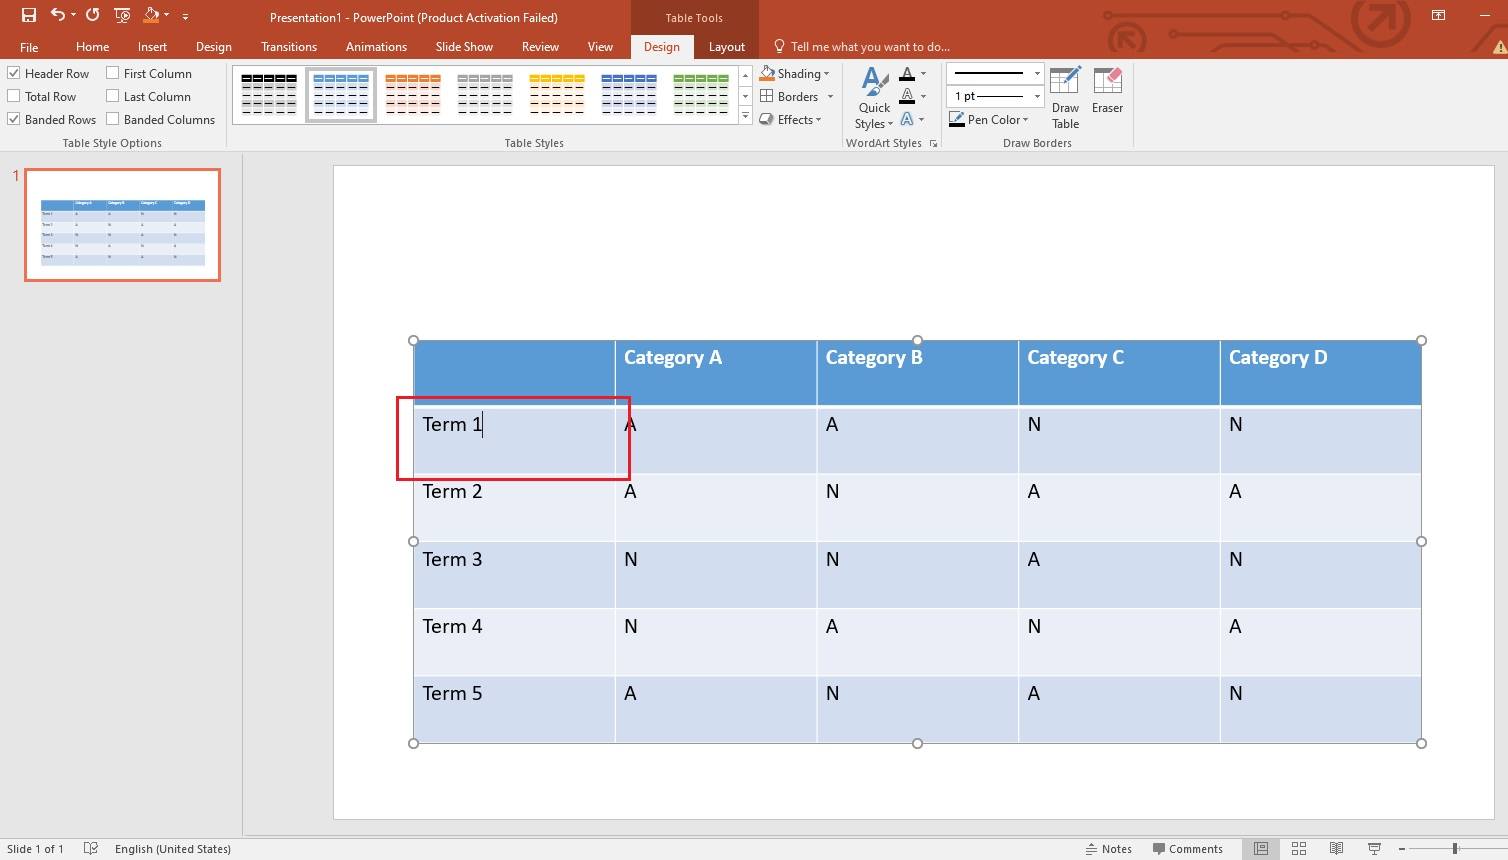
To enter the information or add data into the PowerPoint table, click on any cell, and start entering whatever you want, as shown below.
How to Add and Remove Rows and Columns to the Existing Table in PowerPoint?
While adding data to the table, you may need to add or remove columns and rows to meet your requirements. Let’s learn how you can add and remove both of them in the existing table.
i) Add a Row or Column
Follow the steps below to quickly add columns or rows to the table.
Step 1
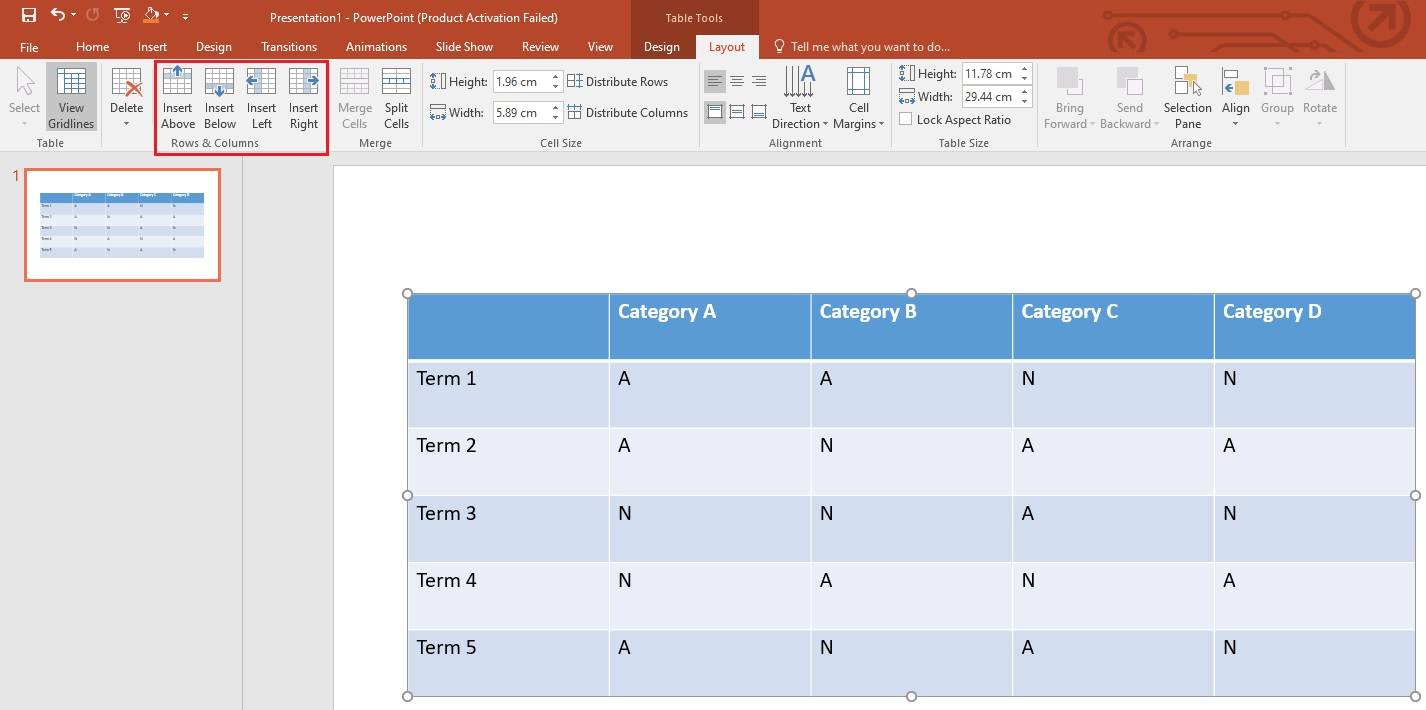
Select the table and go to the Layout tab from the top ribbon.
Step 2
Now, inside the Rows and Columns section, you can choose any of the four options: Insert Above, Inset Below, Insert Left, and Insert Right.
Step 3
To add a new row above or below the existing row, select the row in the table, and tap on Insert Above or Insert Below, accordingly.
Step 4
To add a new column to the left or right of the existing column, select the column in the table, and choose Insert Left or Insert right from the top bar.
ii) Delete a Row or Column
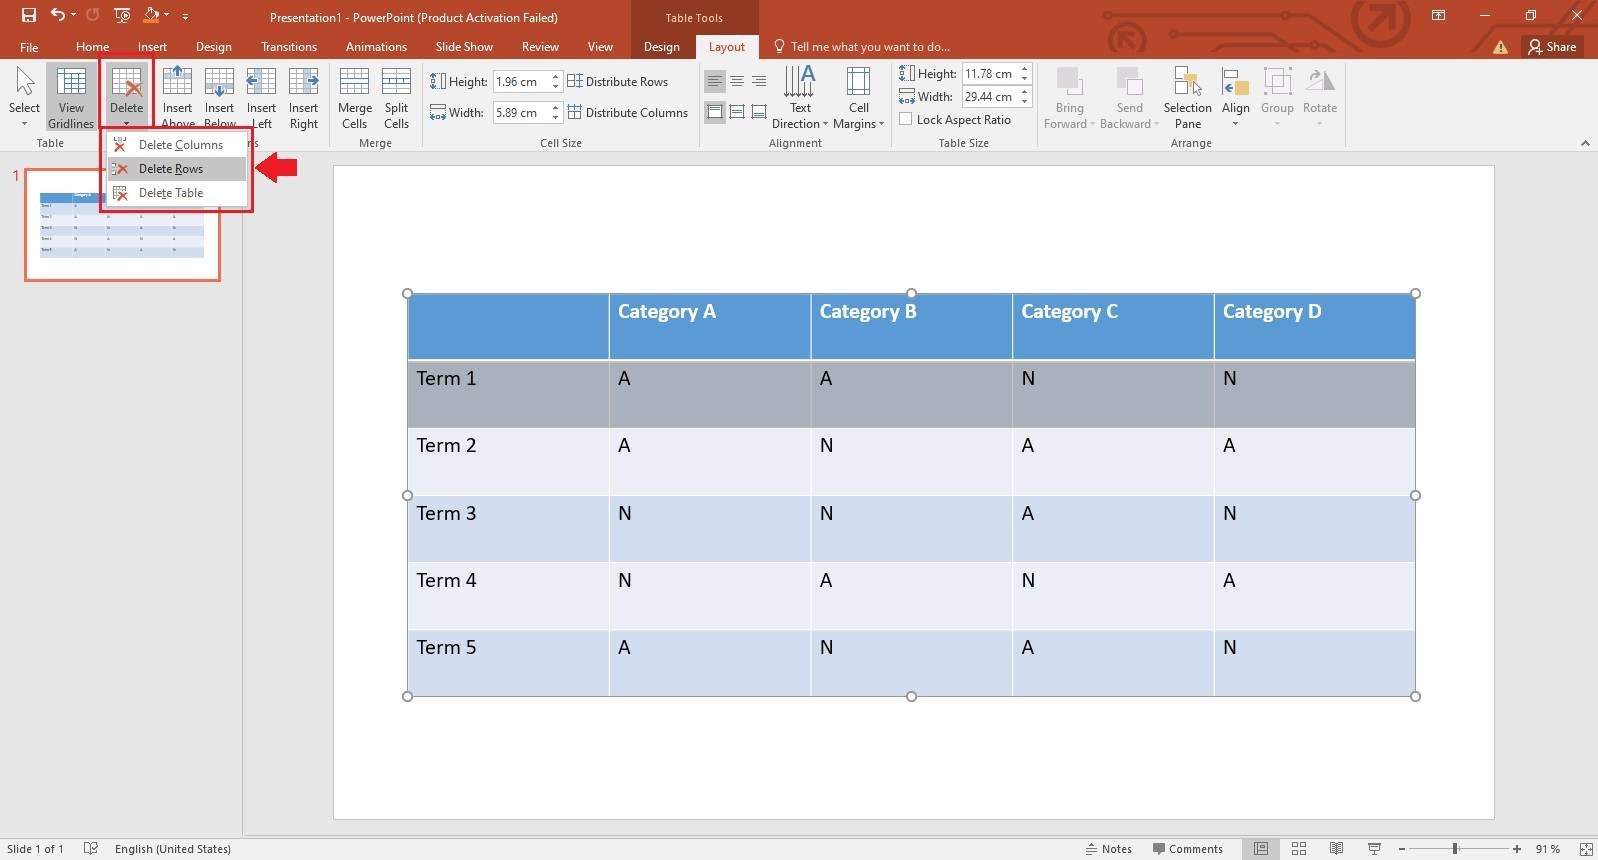
Simply select a specific row or column in the table and open the Delete dropdown menu from the top ribbon, as shown below. Then, choose the suitable option from the list, keeping your requirements in mind. You can delete a row, a column, or even the entire table.
How to Adjust the Table Size and the Cell Size?
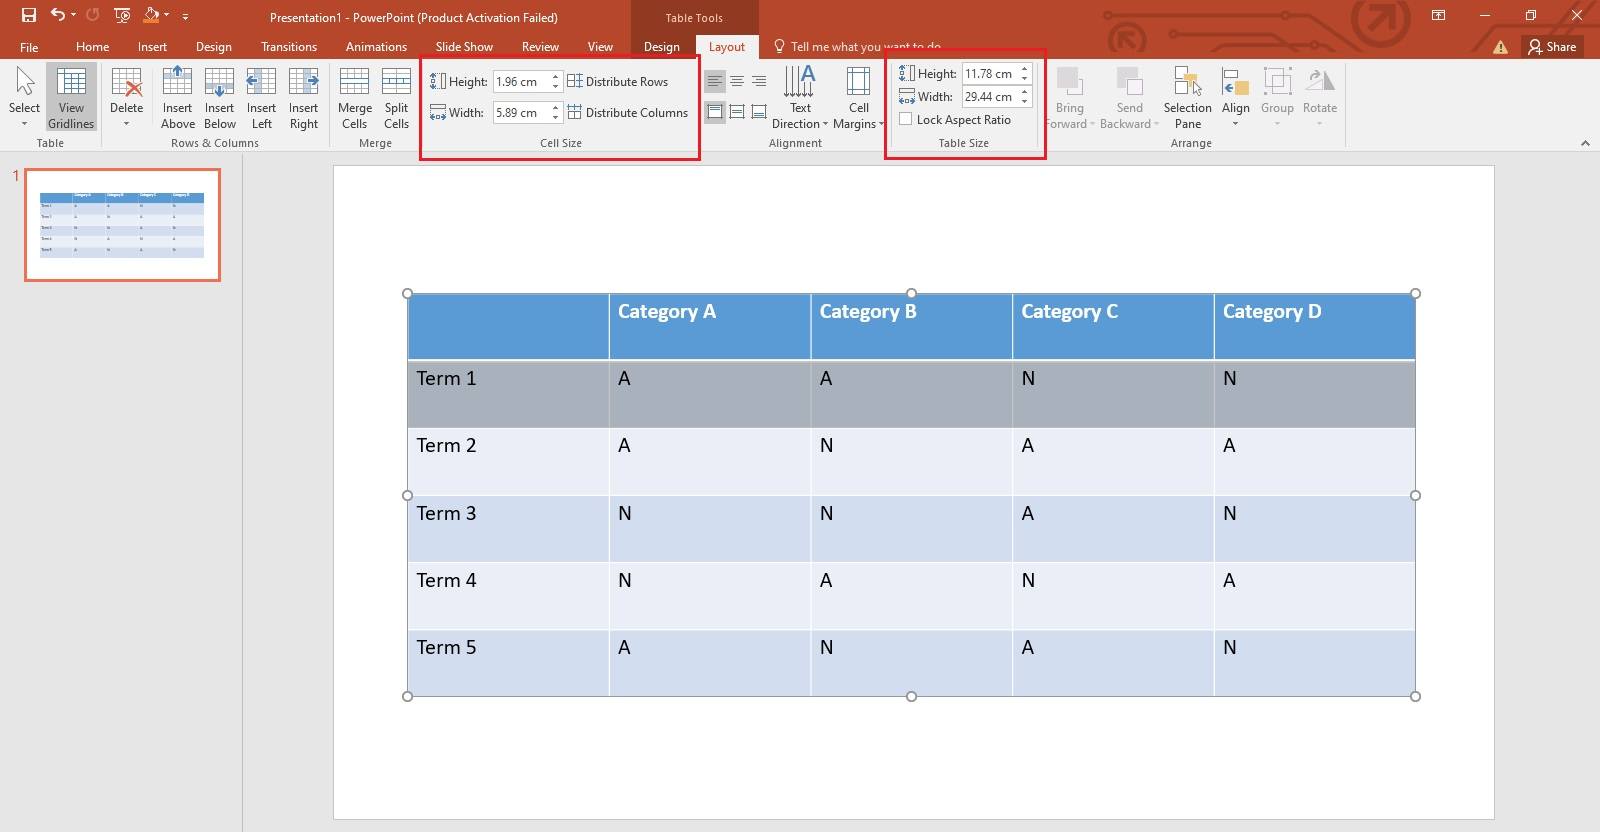
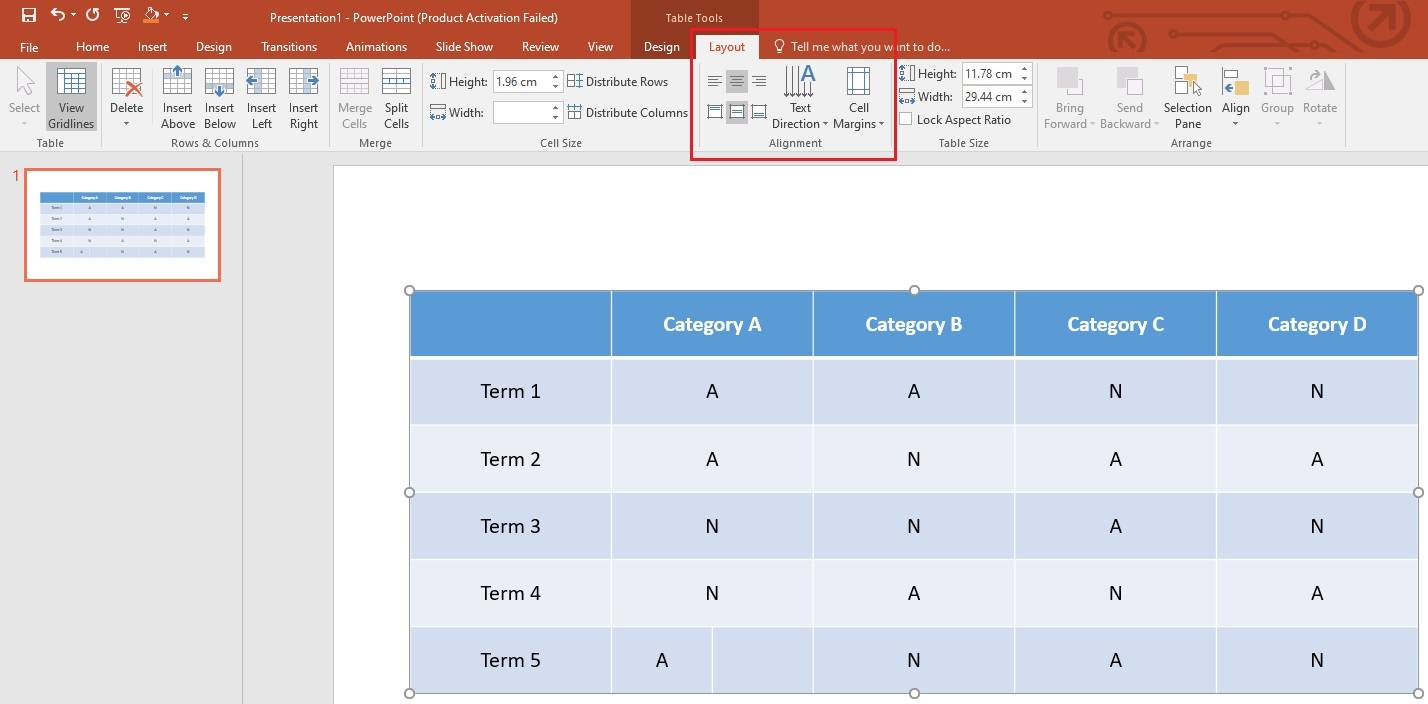
Inside the Layout tab, you will see sections: Cell Size and Table Size, as shown with the highlighted regions in the image below. With the Cell Size section, you can distribute rows and columns of the table. On the other hand, the Table Size section enables you to adjust the height and width of the PowerPoint table.
How to Split a Cell in the PowerPoint Table?
There are two ways to split a cell, as listed below.
Method 1: Use a Floating Toolbar
It is a simple 2-step process.
Step 1
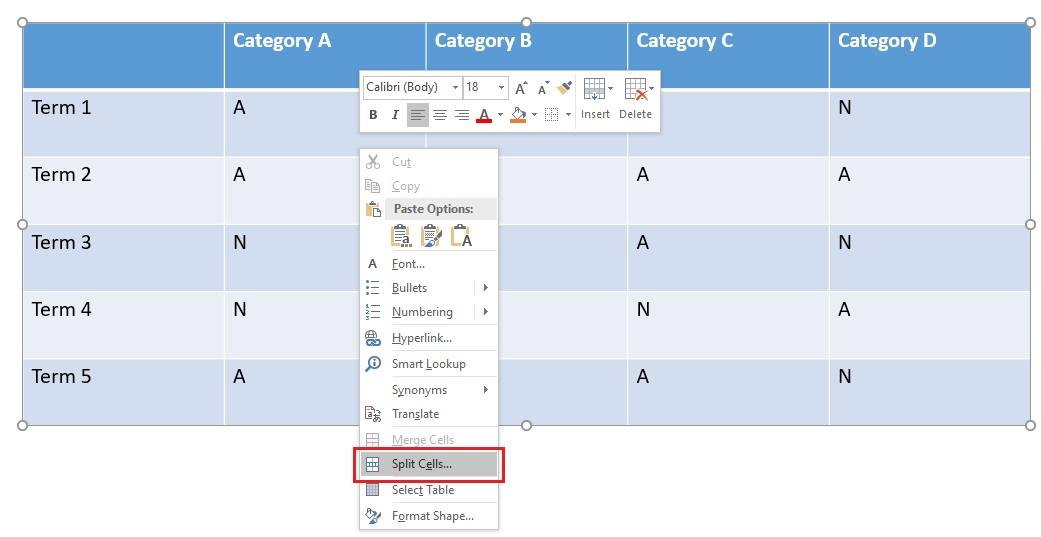
Right-click on a cell you want to split into different rows and columns and tap on Split Cells, as shown below.
Step 2
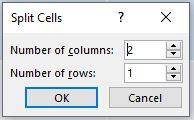
Now, it will ask you to enter the number of rows and columns to split a cell into. Once you enter the desired rows and columns in the pop up, press OK. In this case they are 2 columns and 1 row.
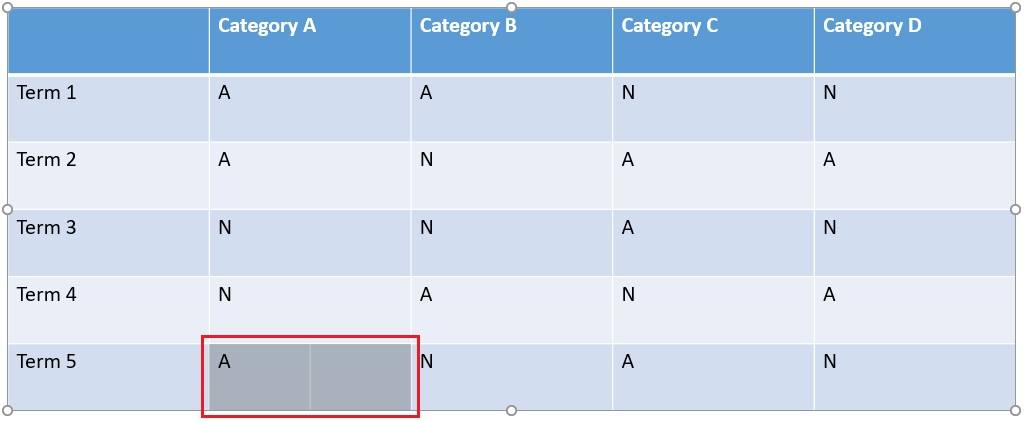
You will now see a cell splitted into the chosen number of columns and rows.
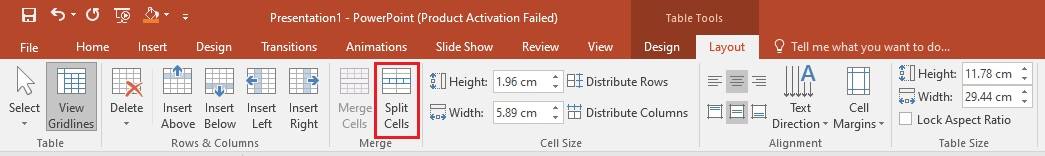
Method 2: Use the Layout Tab
Click on the table, go to the Layout tab, and tap on Split in the Merge section, as shown below. A pop up will appear on the screen. It will ask you to enter the number of rows and columns and will split the chosen cell accordingly.
How to Merge Cells in the PowerPoint Table?
You can merge cells in two different ways, as given below.
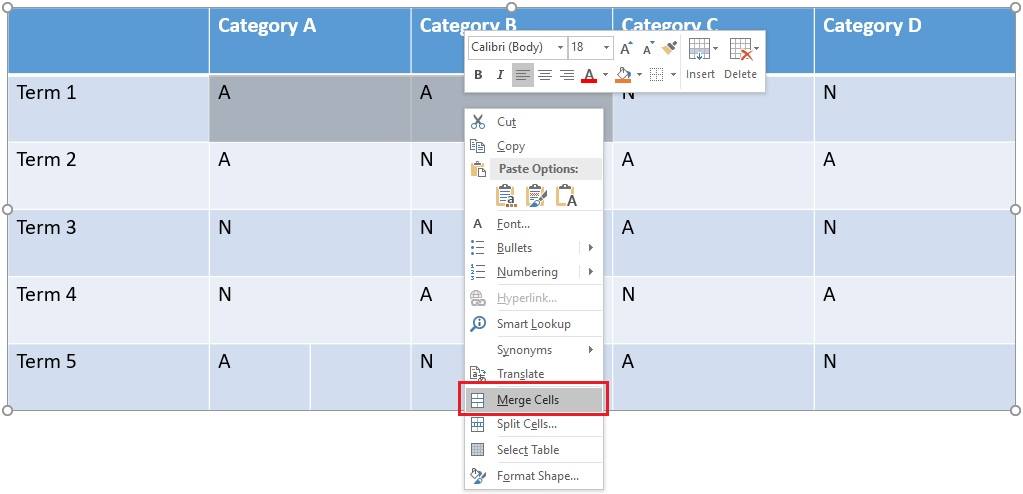
Method 1: Use a Floating Toolbar
Select two or more cells that you want to merge and choose Merge Cells.
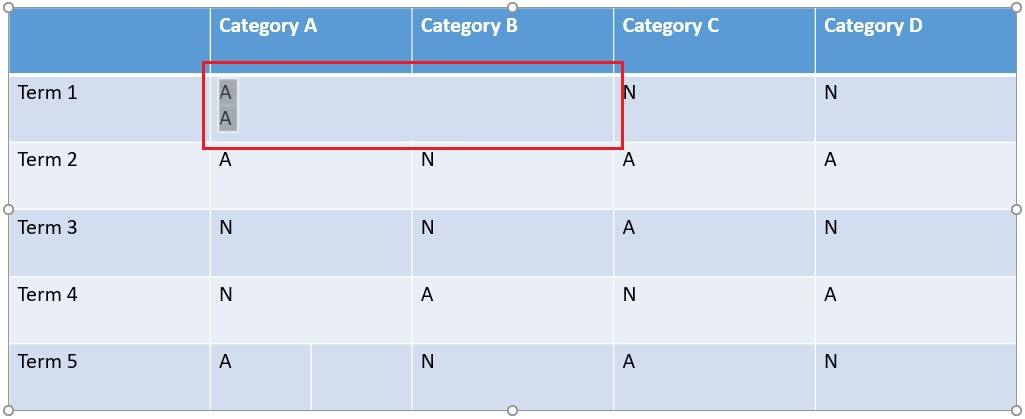
You will now see multiple cells merged into a single one, as shown below.
Method 2: Use the Layout Tab
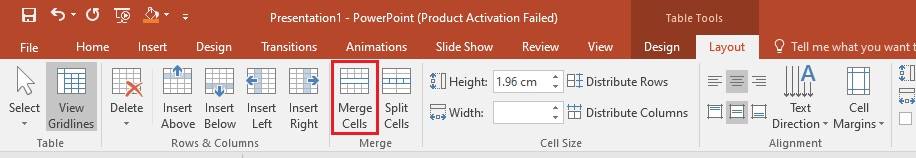
Select two or more cells, go to the Layout tab, and click on Merge, as shown below.
How to Arrange and Align the Table on a PPT Slide?
The Arrange and Alignment sections in the top ribbon allows you to arrange the table and align the text or data within the table.
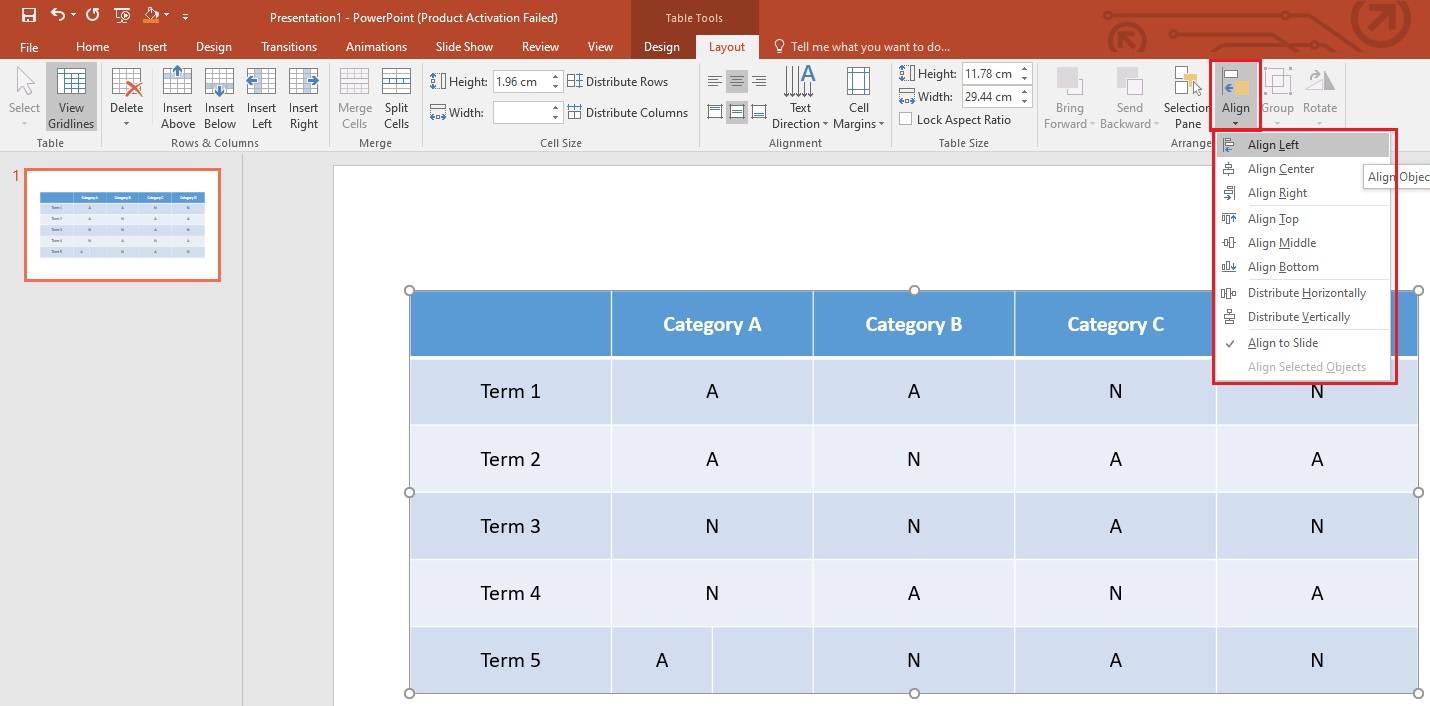
i) Arrange the Table
Go to the Layout tab and open the Align dropdown list in the Arrange section, as shown below. You will see different options in the list to move the table on the slide, such as Align Left, Align Center, Alight Right, Align Top, and more.
ii) Align the Table
If you want to move the text within the cells of the table (top, bottom, left, or right), go to the Layout tab and explore the options available in the Alignment tab. You can also change the text direction and cells margin from this section, as shown below.
How to Change the Table Style, Colors, Borders, and Effects in PowerPoint?
We have listed each function separately for a better understanding.
i) Change the Table Style
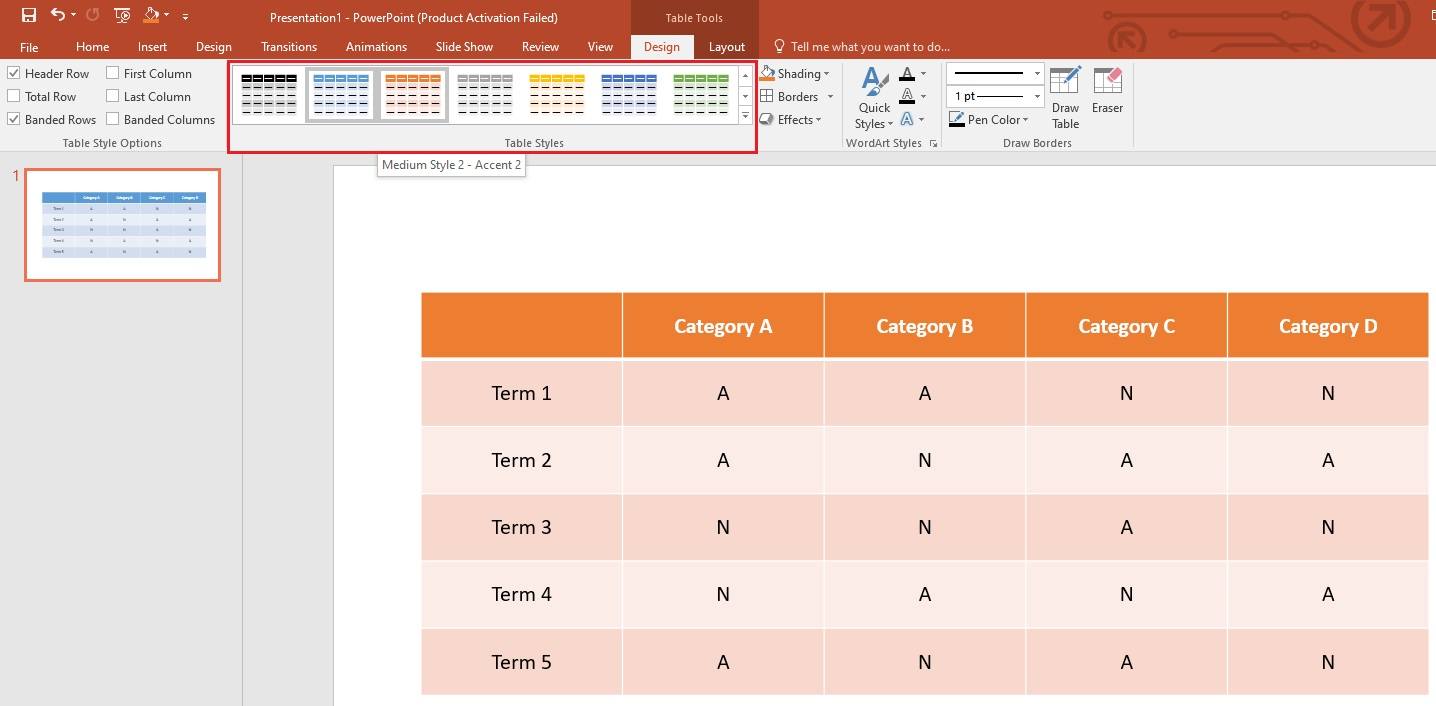
Select the table, enter the Design tab, and choose the style you want. In the image below, we have chosen the “Medium Style 2 - Accent 2”, as shown below.
ii) Change the Colors
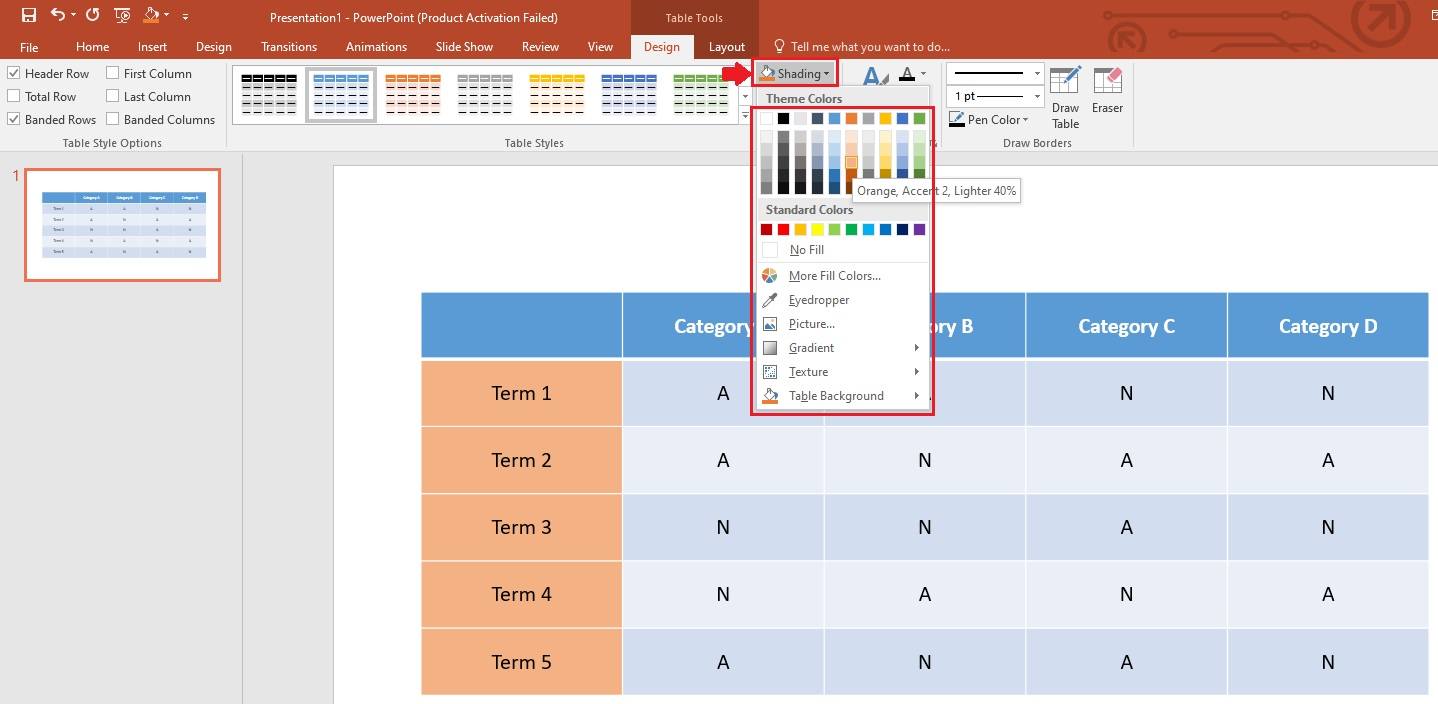
Go to the Design tab, open the Shading dropdown menu, and choose the desired colors for the table.
iii) Adjust the Borders
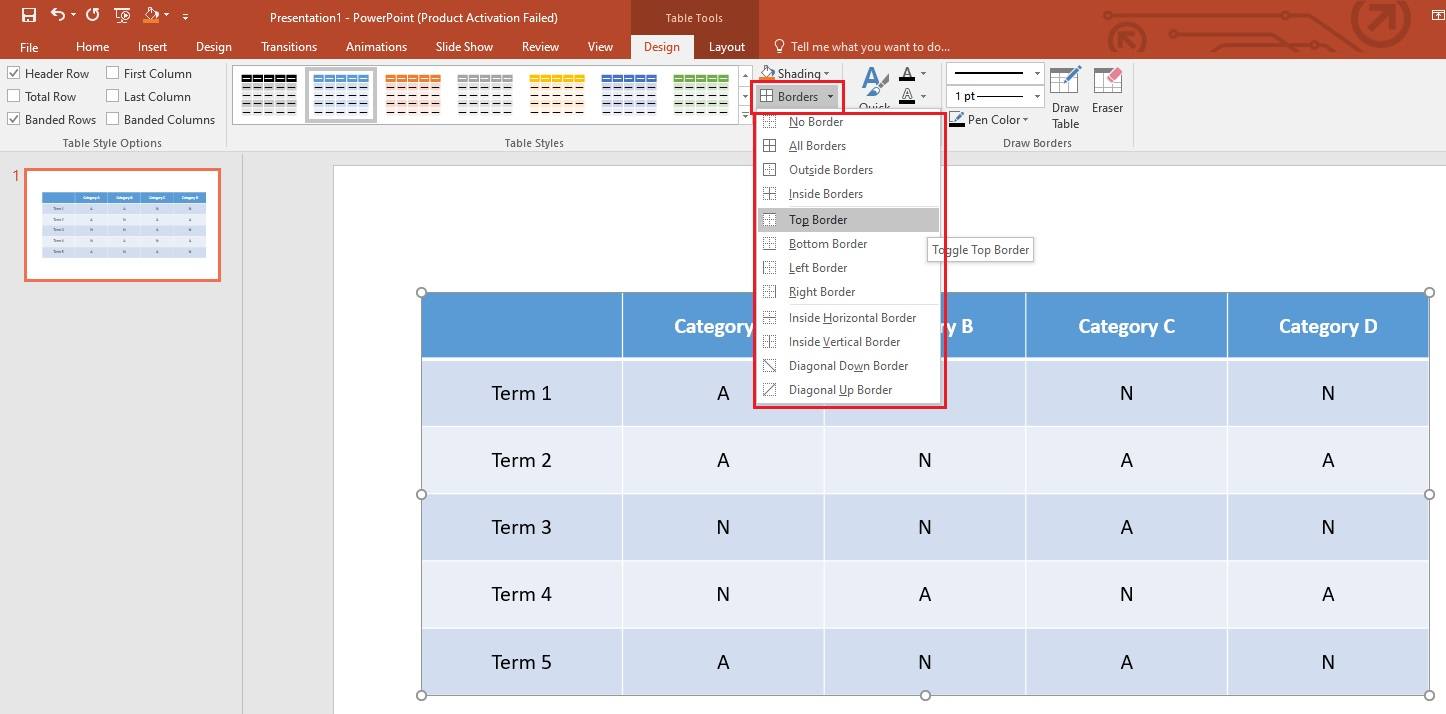
Inside the Design tab, open the Borders dropdown list, and click on All Borders if you want to place border lines around the whole table. Similarly, you can choose Top Border, Bottom Border, Left Border, and Right Border, considering your requirements.
If you want to remove the table borders, click on the No Borders option. In addition, some other options are also available, as you can see in the list shown below.
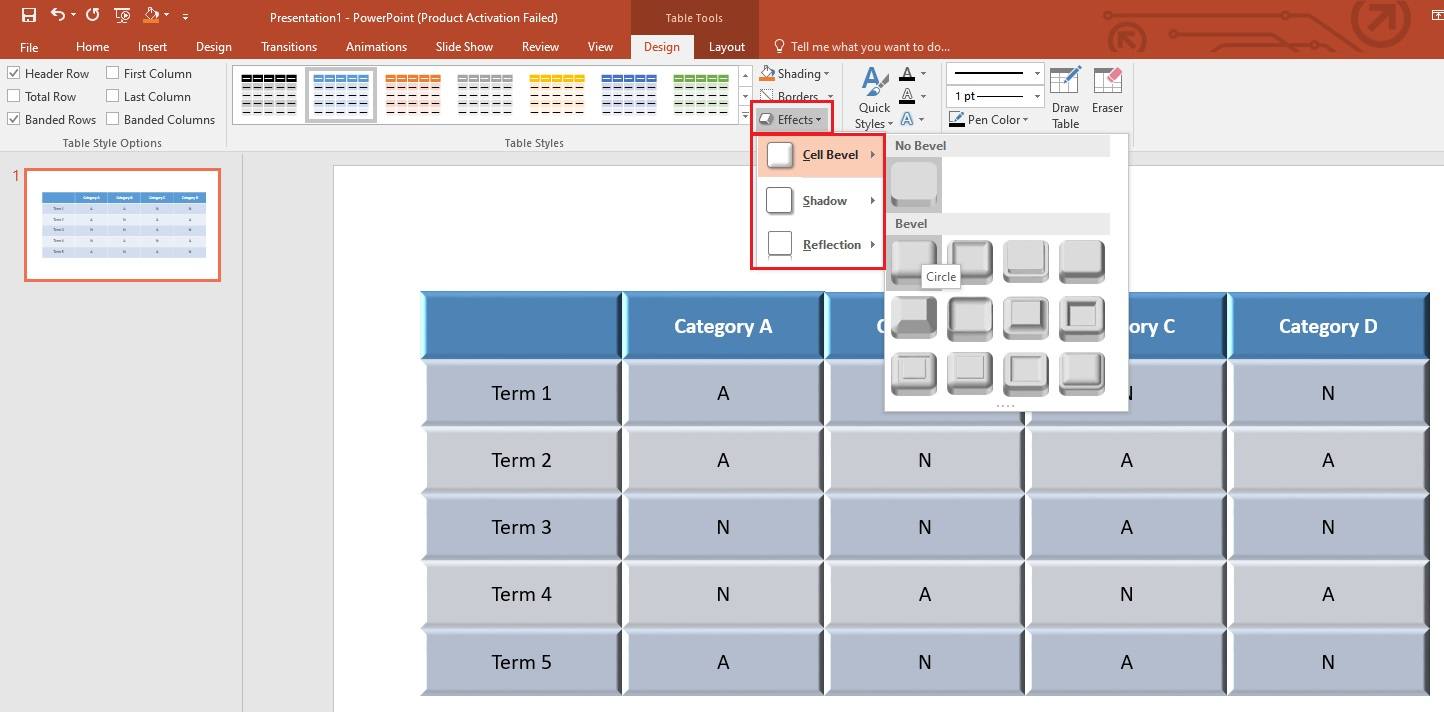
iv) Change Table Effects
Open the Effects dropdown menu inside the Design tab and choose an effect you think is most suitable for your table.
How to Insert a Picture in the Table?
There are two ways to insert an image into a specific cell of the PowerPoint table.
Method 1: Use the Floating Bar
It requires only 3 steps to insert an image to the table.
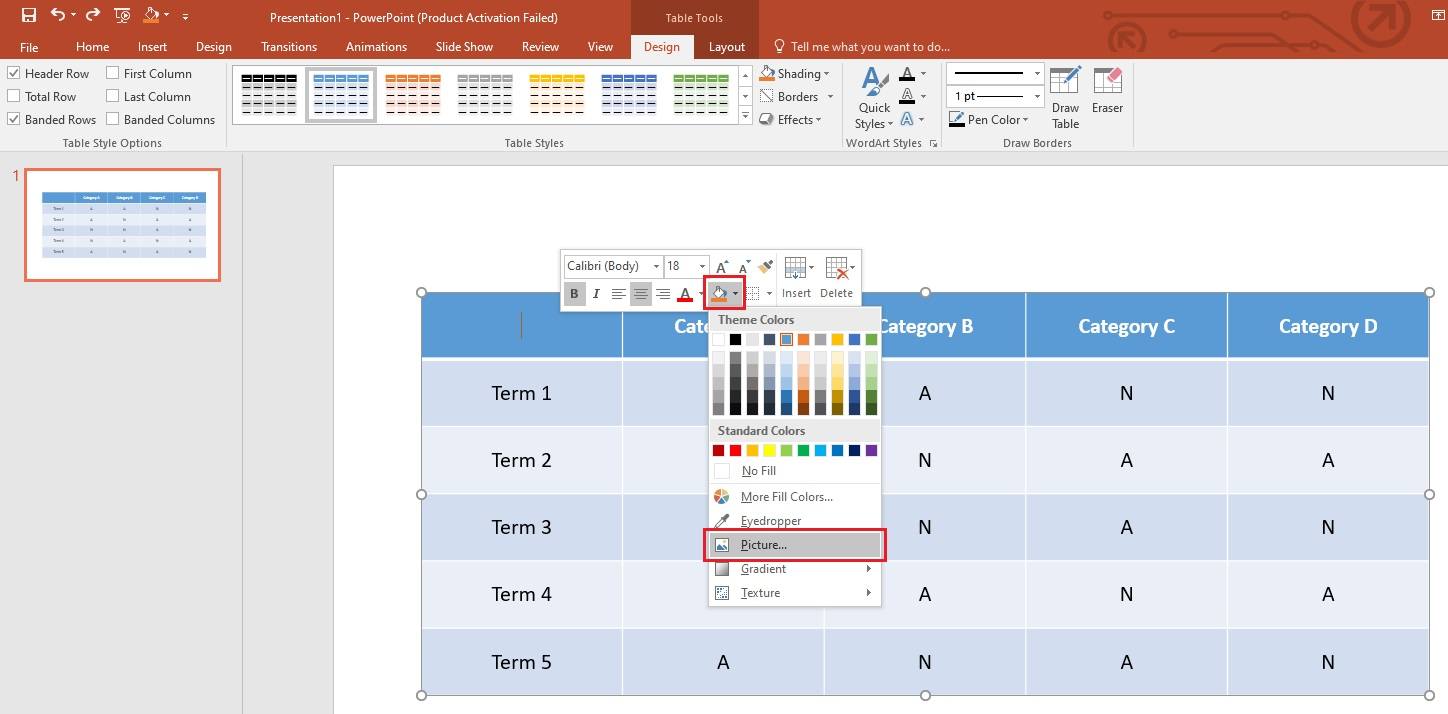
Step 1
Right-click on a cell and open the dropdown list denoted by the color bucket. Then, tap on the Picture option.
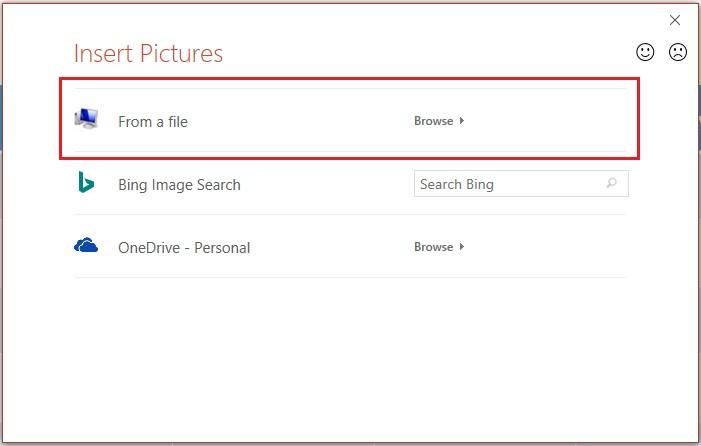
Step 2
Now, search for the picture in your computer that you want to use in the table. Click on the From a file option, as highlighted below. It will help you load a picture from your computer to the PowerPoint table. You can also choose a picture from Bing Search or OneDrive.
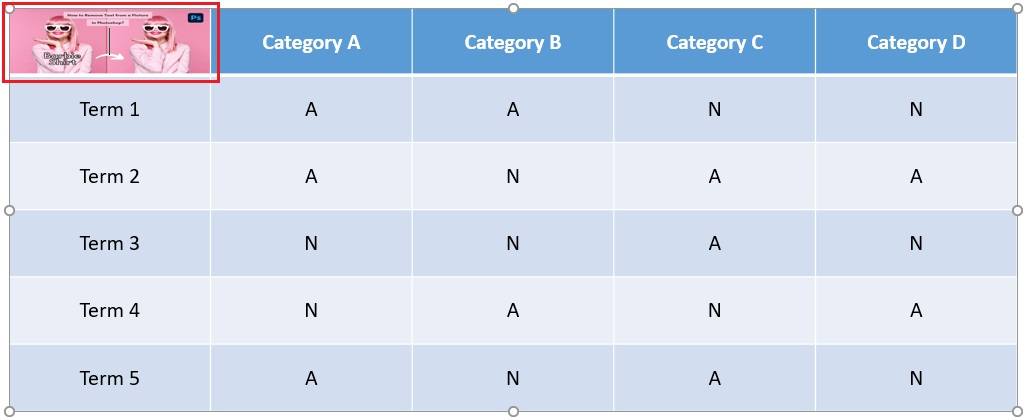
Step 3
Once you choose the picture, press Open, and it will appear in the selected cell of the table, as shown below.
Method 2: Use the Design Tab
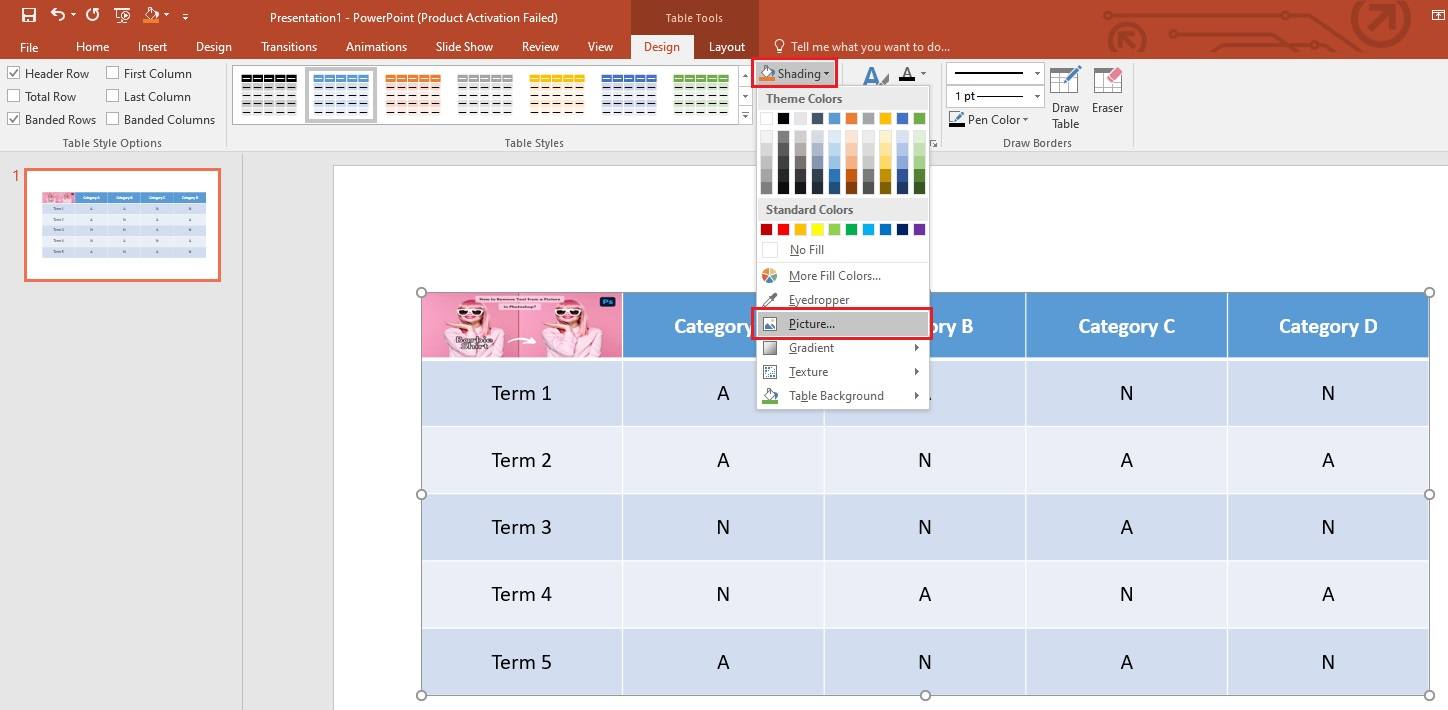
In the Design tab, open the Shading dropdown list and click on the Picture option. Load the picture from your device and you are done.
How to Make a Professional Table in PowerPoint?
Here is how you can create a professional table in Microsoft PowerPoint within minutes.
Step 1
Go to the Insert tab, open the Table dropdown list, and move the cursor to choose four columns and six rows (for the example below) for the table, as shown below.
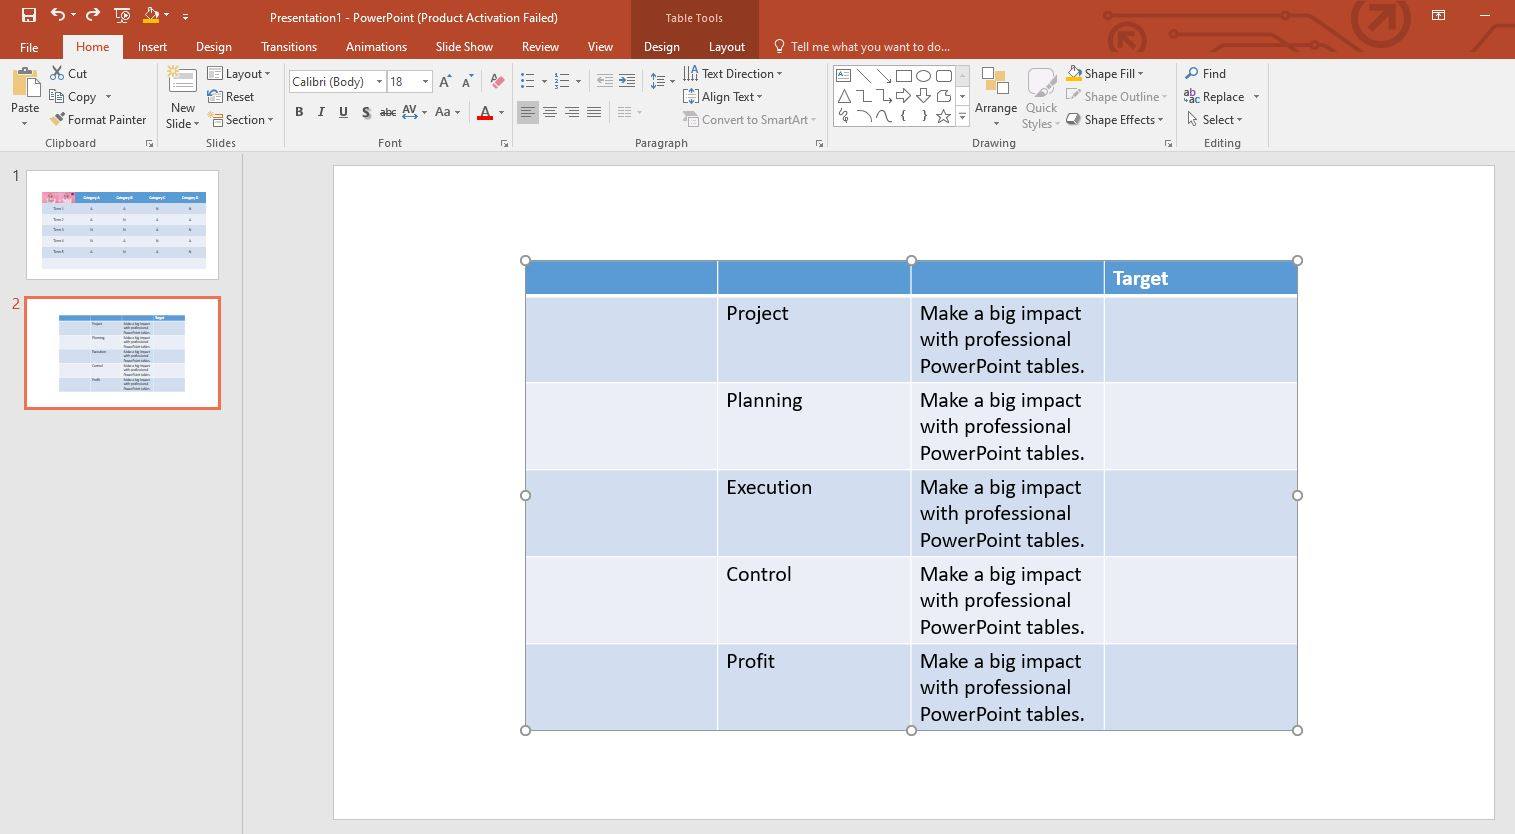
Step 2
Now, enter the text to the table wherever needed.
Step 3
It is time to download icons for each category: project, planning, execution, control, and profit. Once done, add them one by one to the left-most column, according to their respective categories.
You can simply copy the icon and paste it into the desired cell. However, you might need to adjust their sizes according to the cell size, as shown below.
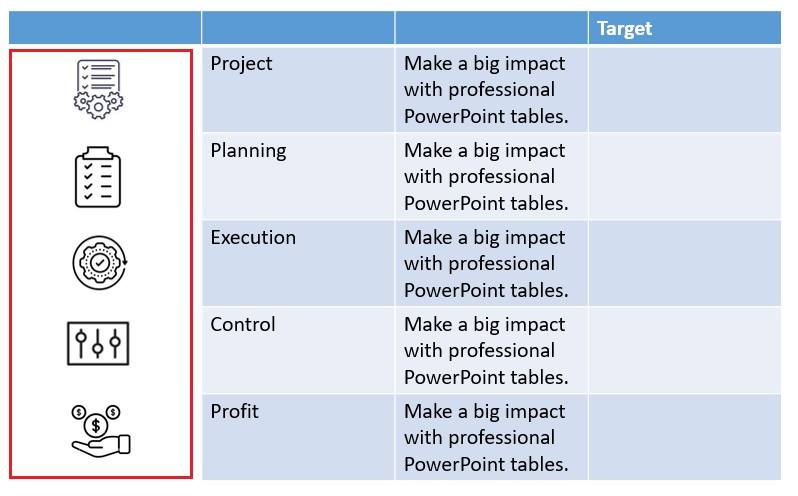
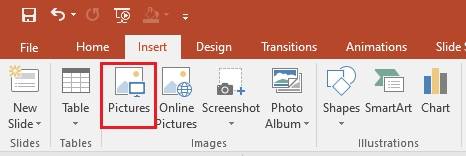
Alternatively, you can go to Insert>Pictures to upload icon images into the PowerPoint slide and place them in the desired cells.
Step 4
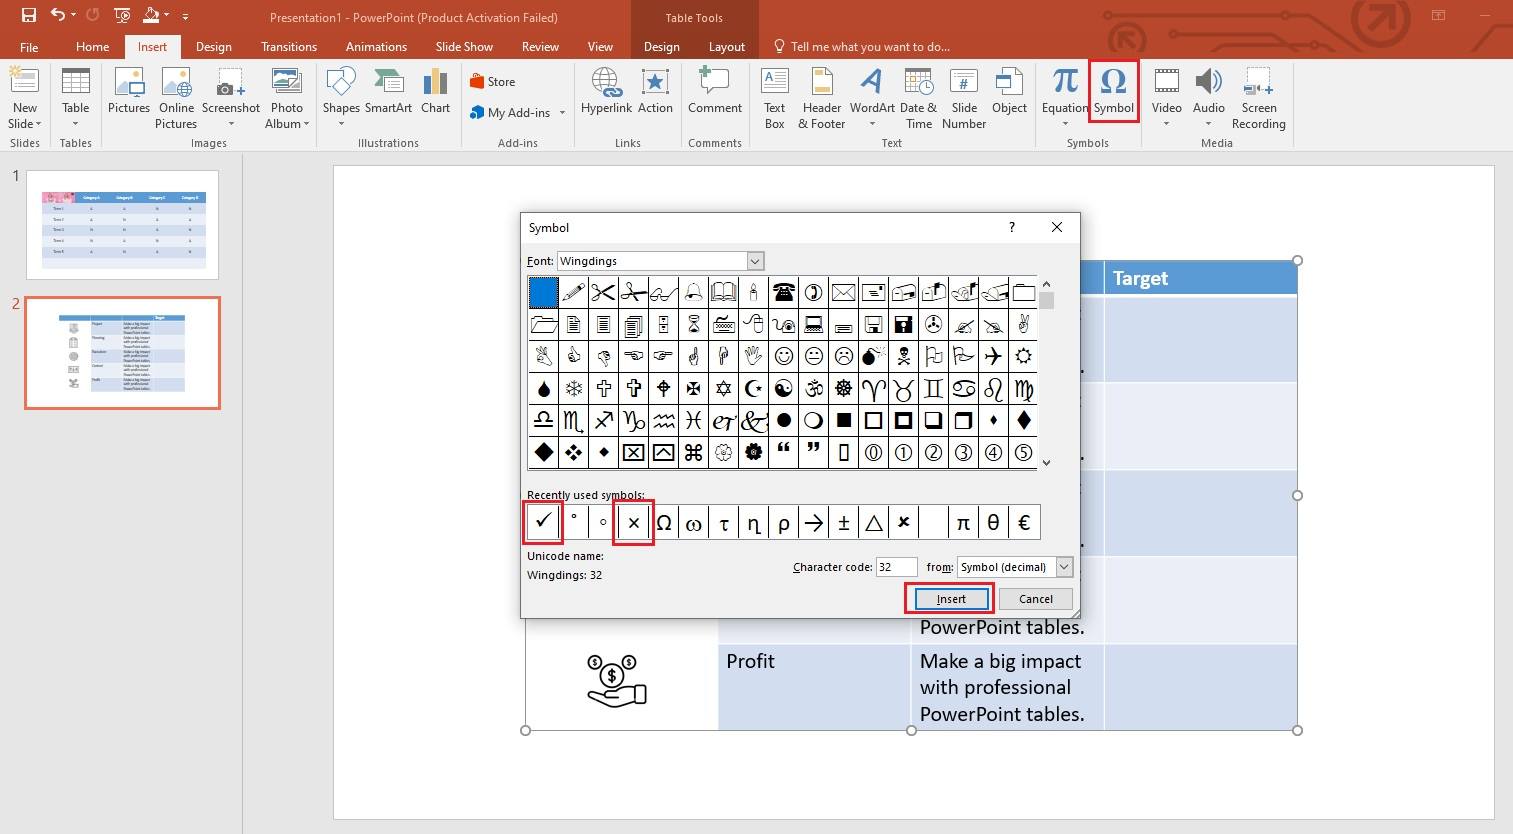
Now, enter the Tick and Cross symbols in the right-most column to show whether or not a specific project development phase is completed. To do this, go to the Insert tab and click on Symbols. A new window will pop up on your screen. Choose the tick and cross symbols from the library and hit the Insert button.
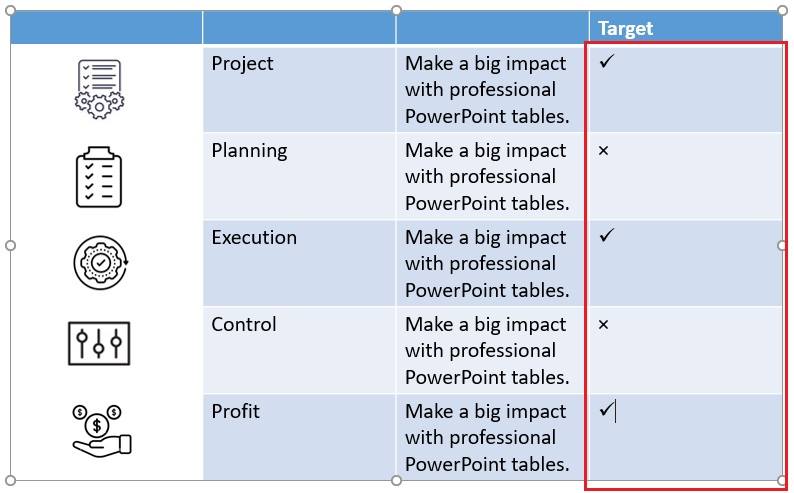
You will now see the symbols placed in the table.
Step 5
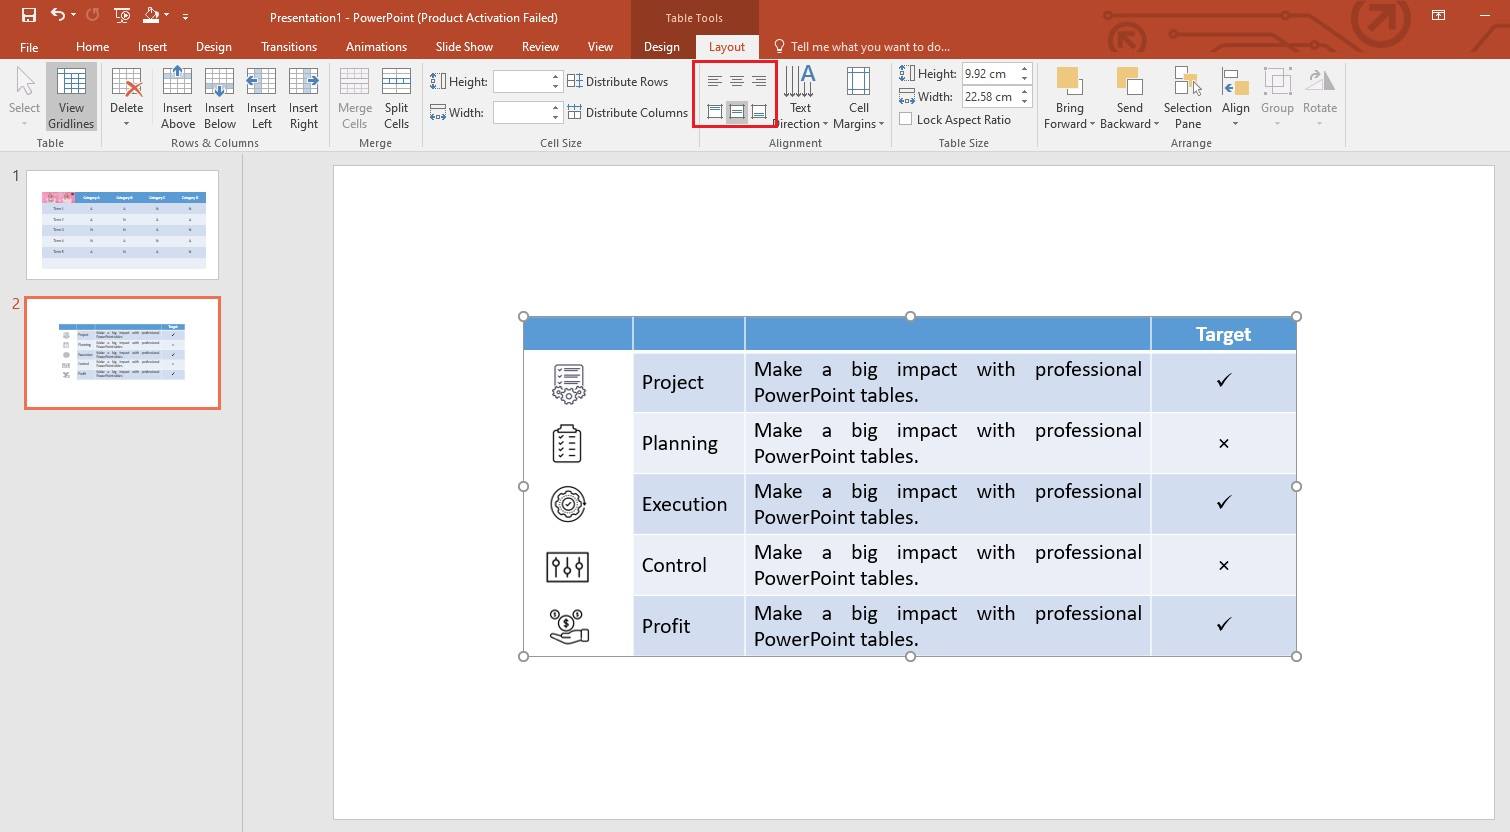
It is time to align the text in the table. To do this, go to the Layout tab, and adjust the text position with the controls, as highlighted in the image below.
Step 6
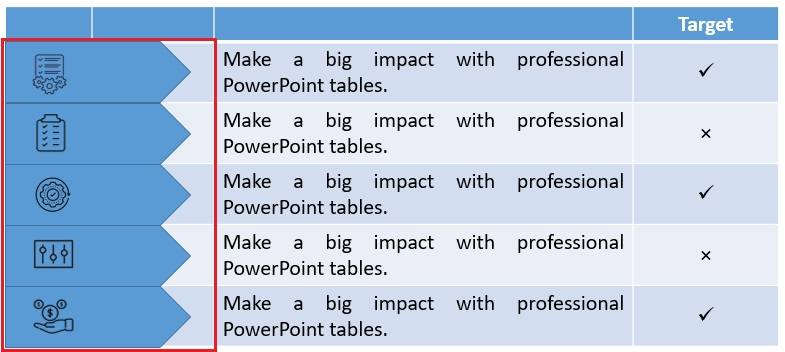
Now, enter the Insert tab, go to Shapes, and choose the encircled shape type. Once done, place it behind all the icons in the left-most column, as shown below.
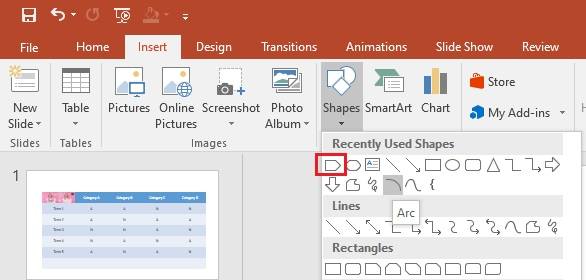
Once all the shapes are placed correctly behind the icons, the table will look like the image below.
Step 7
Click on any icon, go to the Format tab, open the Color menu, and choose a white-colored scheme for all icons.
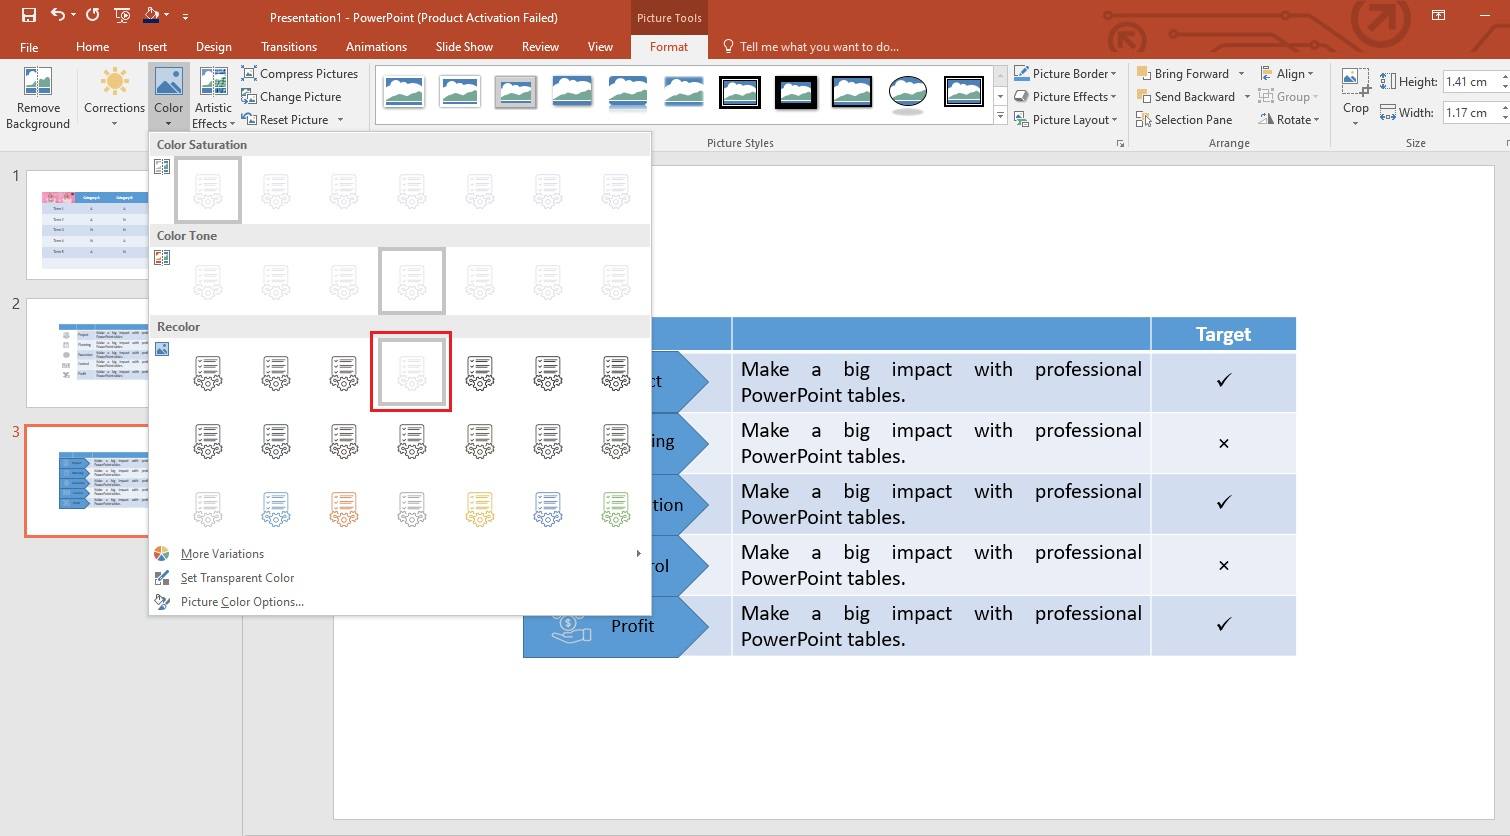
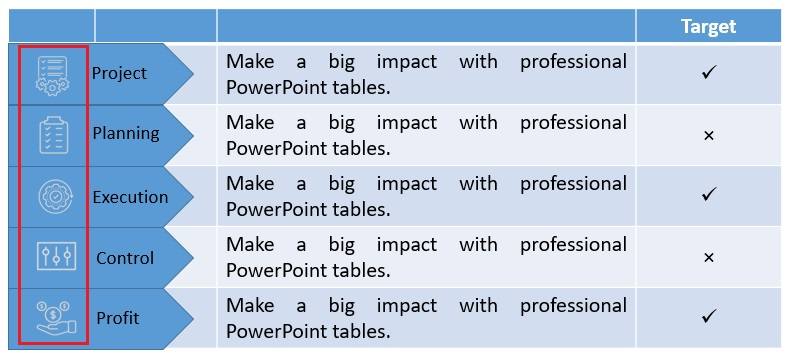
The updated icons will look like the ones shown below.
Step 8
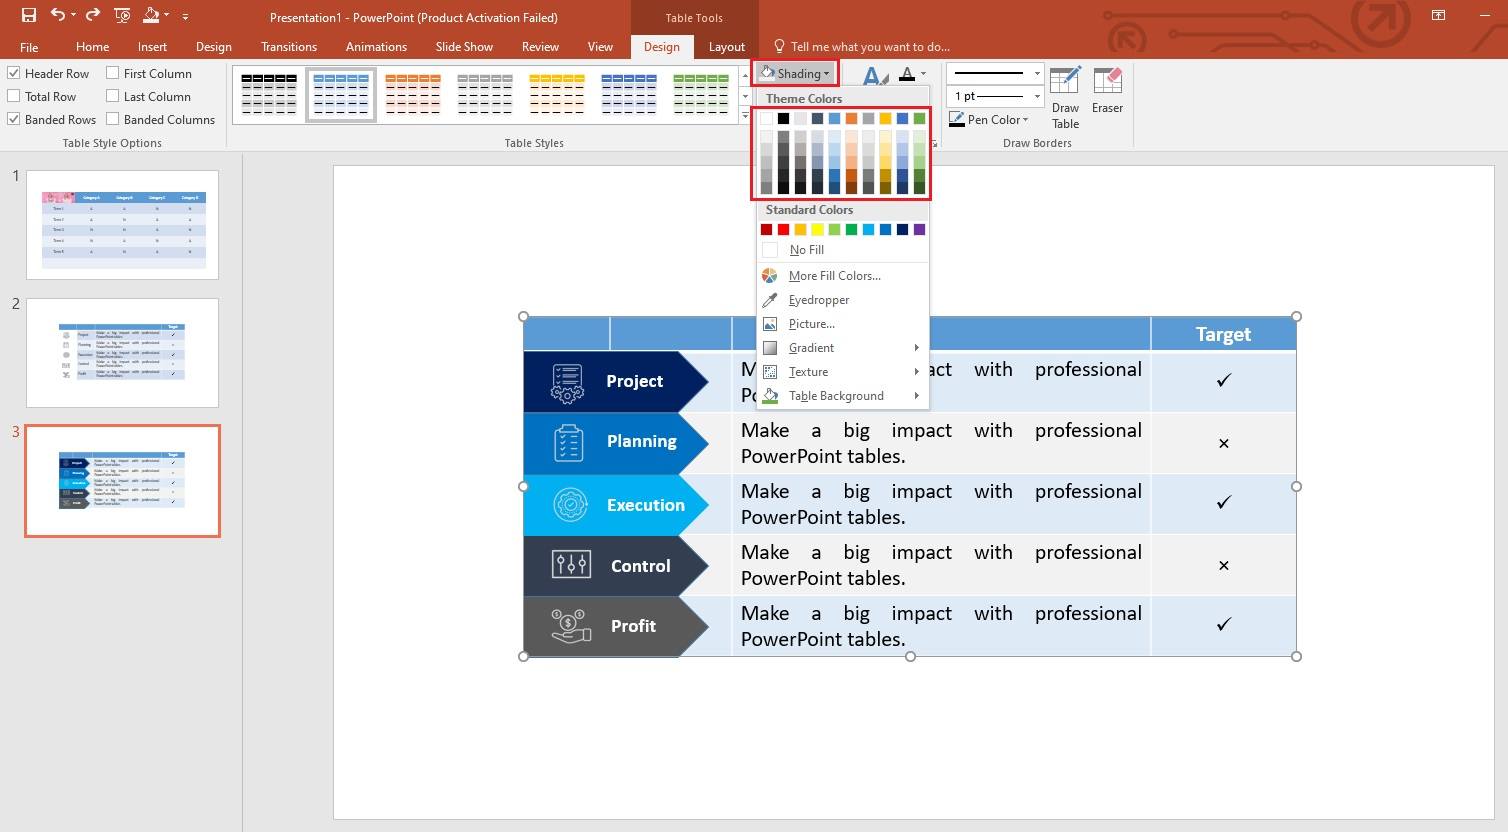
Change the color of the shapes and table. To do this, go to the Design tab, open the Shading dropdown list, and choose the colors you want.
Step 9
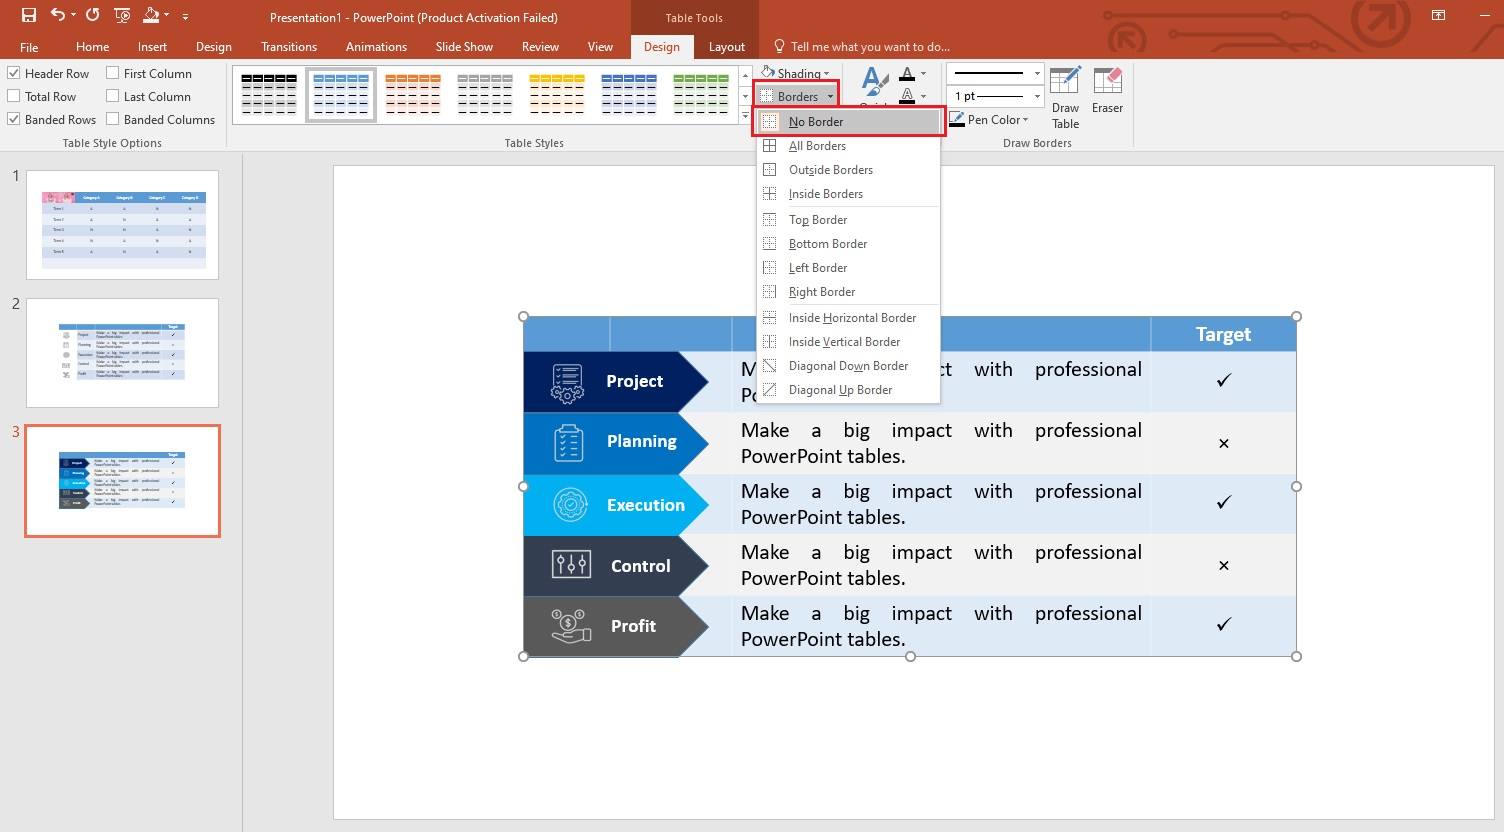
Now, remove the table borders to make it more appealing. Go to the Design tab, open the Borders dropdown list, and choose No Border.
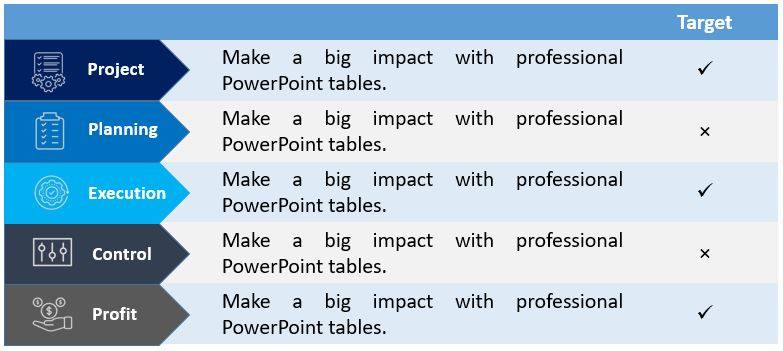
The new look of the table will look like the one shown below.
Step 10
Now, change the color of the first row (except the right-most cell) to white to make it disappear from the table, as shown below.
Step 11
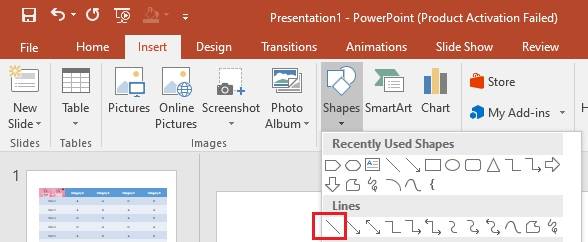
Place lines with different colors on the left side of the right-most column to give the table a more professional look. Choose the Line symbol from the Shapes list inside the Insert tab.
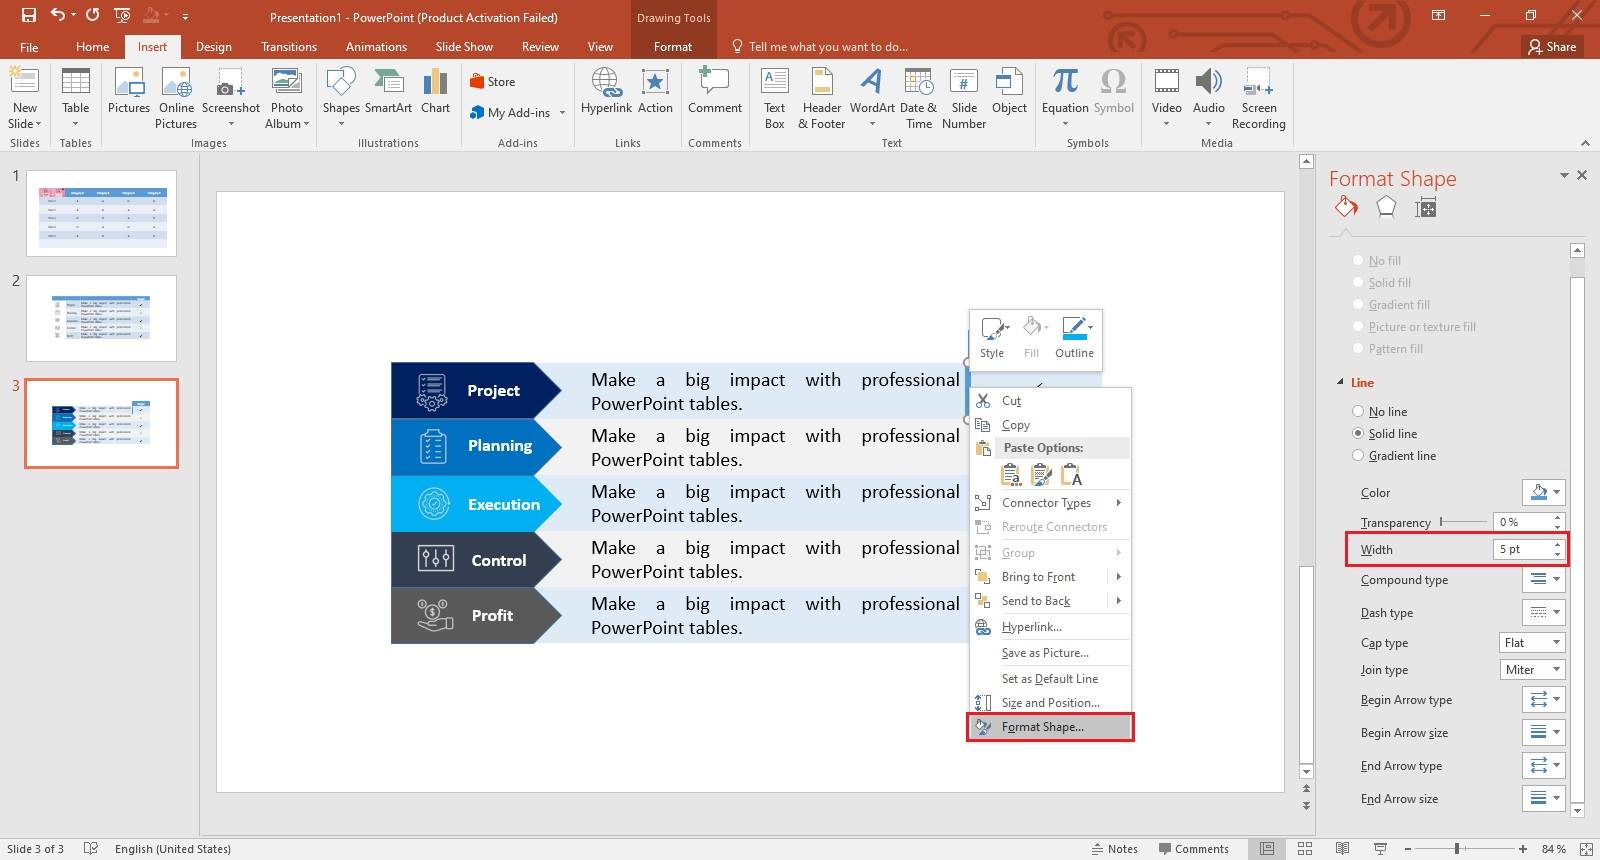
Right-click on the Line, choose Format Shape, and increase its width to 5, as shown below.
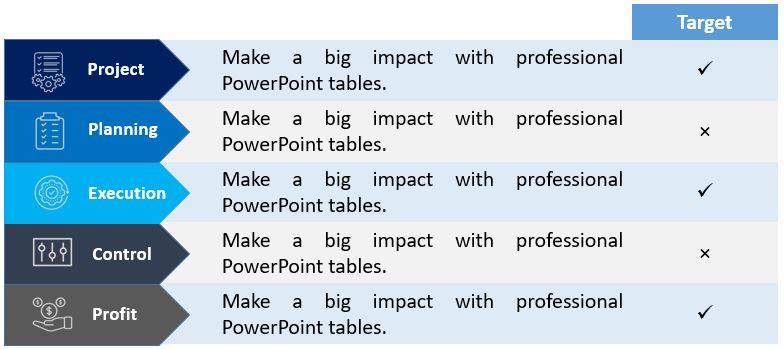
Now, place the lines in each row and adjust their color according to the shapes placed in the left-most column.
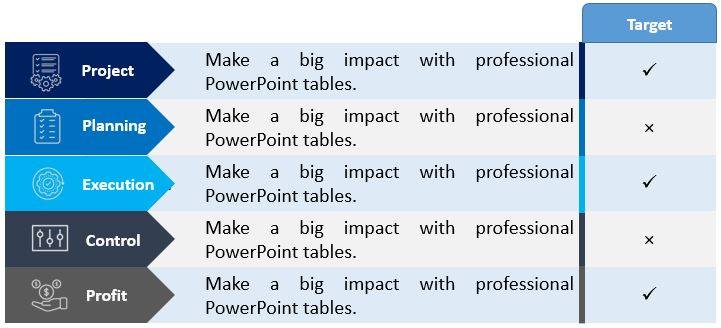
Here, we have made a professional table from scratch in PowerPoint.
Best Practices for Making a More Appealing and Effective Table
A table is a powerful tool for visualizing data but its effectiveness largely depends on how you design, arrange, or align it. Below is a list of the best practices you should follow while making a table in PowerPoint or any other tool.
- Structure: Define the purpose of the table clearly and use visual cues for a better understanding. In addition, use consistent formatting style to make it eye-catching.
- Headers: Make headers relevant, descriptive, and short.
- Row Style: Remember, the row style enables users to scan information available in the table. Remove zebra stripes and row lines to reduce visual noise for smaller datasets. In comparison, row lines help users scan data easily for larger datasets.
- Alignment: It plays a key role in making your table look appealing and more professional. For example, all information in rows and columns must be in line. They should also line up with their respective headings.
- Resizable Columns: Keep the columns resizable as it helps viewers see the complete data without scrolling.
- Pagination: If there are hundreds of rows in the table, use pagination. It will help users control the number of rows that they want to see at one time.
- Number Alignment: Readers can compare values more easily when the numbers are right-aligned than when they are left-aligned or placed at the center.
- Filtering: Add the filtering function while making a table. It helps users find any type of data in no time.
Easily Make a Better One with Edraw.AI
Edraw.AI is a wonderful online visual collaboration tool that you can use for free to make hundreds of diagrams including tables. It offers more than 700 pre-built templates designed by professionals and over 26,000 symbols to make the diagrams more appealing. Plus, you can star (★) your own work to save it for future use.
Method 1: Create a Table in Edraw.AI
With four simple and easy steps, you can make a stunning table within seconds using Edraw.AI.
Step 1
Enter your Wondershare ID or social media credentials to login to Edraw.AI.
Step 2
From the main interface, tap on Show All, and choose AI Diagram, as shown below.

Step 3
Now, explore the Select Diagram Type section for Table and select it. Then, enter the prompt to create the table you need. Once done, tap on the Start button, and Edraw.AI will create a table according to the prompt given.

Step 4
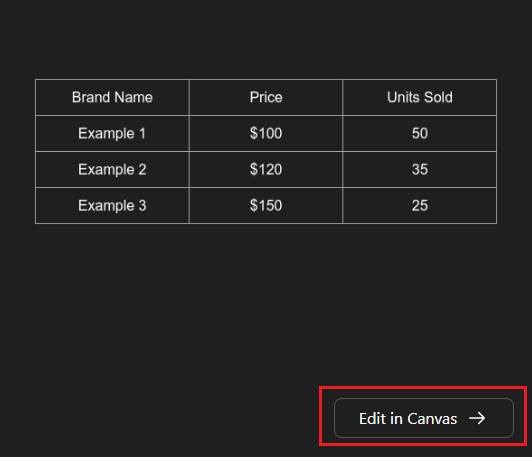
Click on the Edit in Canvas button to start editing the table that Edraw.AI created for you in the step above.
Method 2 Create a Table with a Template in Edraw.AI
This method is even more efficient than creating a table from scratch. It provides you with a built-in template to get the job done more quickly.
Step 1
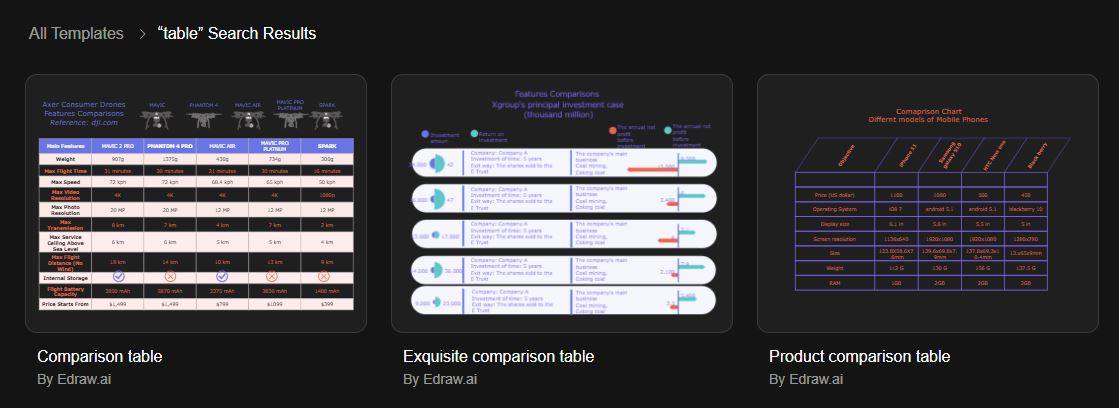
Go to the template library, search for the table using the search bar. It will find you the templates, as shown below.
Step 2
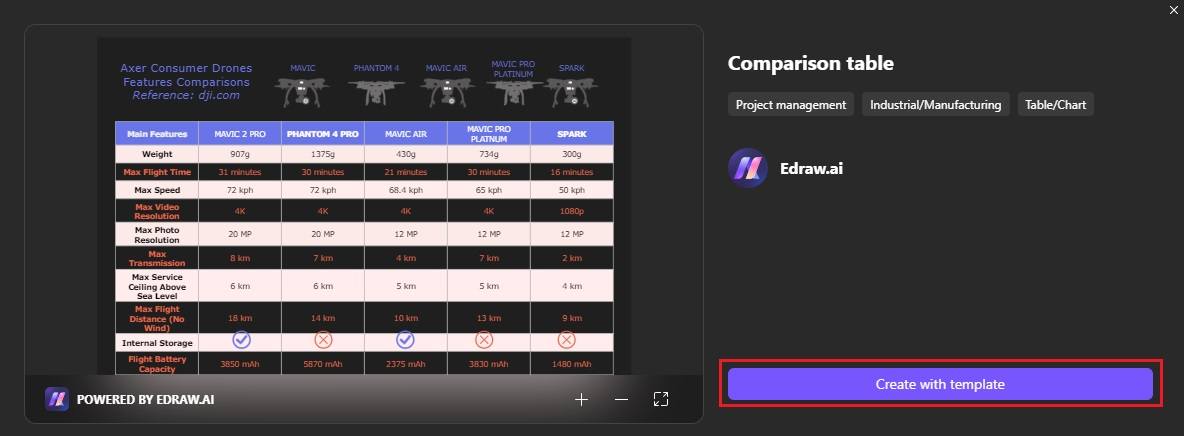
Choose the suitable template by clicking on it and tap on the Create with template button. It will allow you to make changes to the template and make it according to your needs.
Export the Diagram/Chart to PowerPoint
Once the table is ready, you can export it to PowerPoint with Edraw.AI by following the steps given below.
Step 1
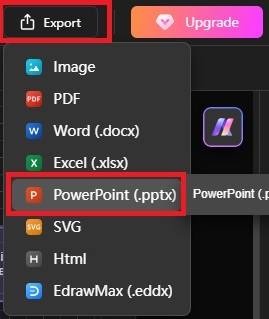
Tap on the Export button (you will find it in the upper-right corner). Then, choose PowerPoint (.pptx).
Step 2
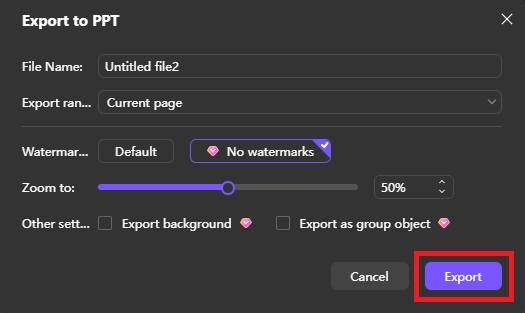
From the window that appears on your screen, you can set the File Name and Export Range. Once done, hit the Export button.
Alternatively, you can export the table in PNG format and import it into Microsoft PowerPoint later.
To sum up, PowerPoint is an amazing tool for creating tables with different options: insert table, draw table, create table with spreadsheet, make a table with ready-to-use templates, and more, as we have discussed above. If you want to make a better table efficiently, try Edraw.AI. It is an online collaboration tool that comes with the ability to make hundreds of diagrams, including tables, within seconds, as explained in the discussion above.
FAQ
-
Why choose PowerPoint to make tables over other similar tools?
PowerPoint is a free, simple, easy-to-use, and efficient tool to make several diagrams including tables. In addition, it allows you to share documents with others and track changes when others edit it. -
What is the quickest way to add a table in PowerPoint?
To create a table in PowerPoint quickly, go to the Insert tab, choose the number of rows and columns with the cursor, and click. It will help you create the table with the desired rows and columns. -
Can I insert a picture in the PowerPoint table?
Yes, you can insert a photo in a specific cell of the table to make it more professional and appealing.

Prefer working locally?
Make 210 types of diagrams: flowcharts, blueprints, UML, etc
AI Mind Map, AI PPT, real-time
collaborative brainstorming
