Drawing timelines in PowerPoint may appear slightly tricky, especially for persons who are new to it, but it is such a strong tool when understood. In fact, it offers all the features you need to create effective and visually appealing timelines, from pre-designed timeline templates and shapes to customizable styles and formatting options.
In this guide, I’ll explain in easy-to-understand language how to make a timeline in PowerPoint in a minute or two and how to spend a longer time making a professional one
Also, if you're looking for an alternative to Microsoft, check Edraw.AI. I have used the diagram maker for various projects and found it highly user-friendly. I’ll also cover how to create a timeline using Edraw.AI in simple steps to help you learn about the tool.
In this article
How to Make a Basic Timeline in Microsoft PowerPoint (2024 Updated)
Creating a simple timeline in PowerPoint is easy; you don’t have to develop everything from scratch, but instead, you can choose a pre-built template, and your work is half-done. Here’s how you can do it:
Step 1: Open a Template
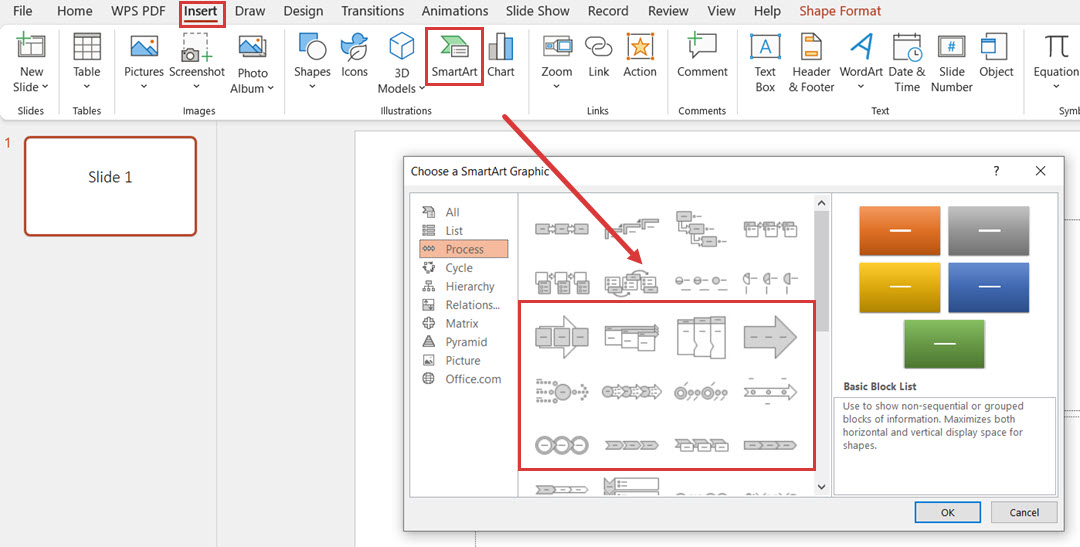
Open Microsoft PowerPoint and create a new slide. From the navigation bar, choose the Insert segment and click on SmartArt or a Chart. Click the appropriate timeline template from the options, and PowerPoint inserts it into the chosen slide accordingly.
Step 2: Edit Text/Data
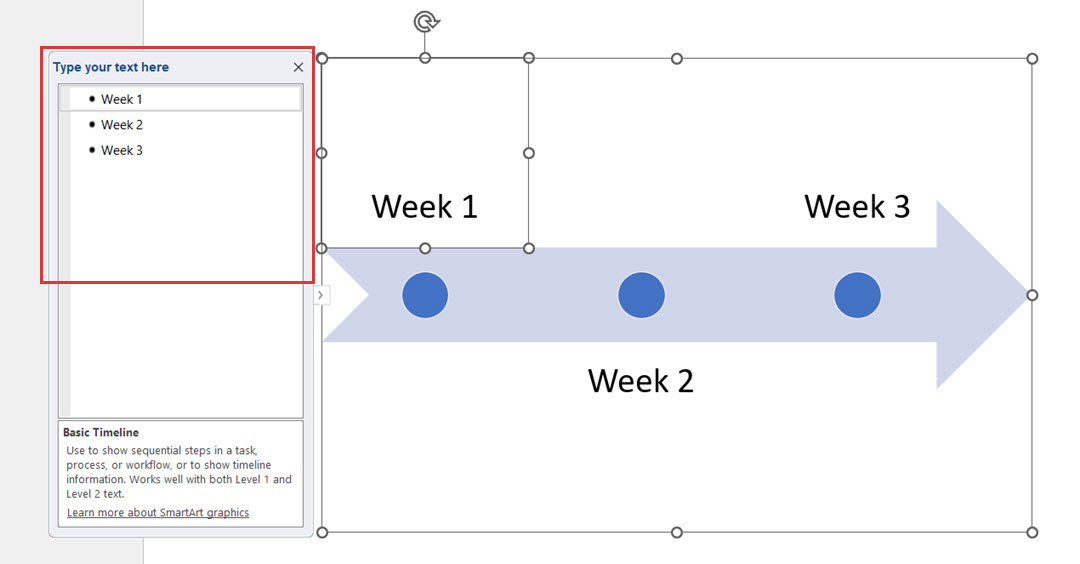
To edit the text or data in your diagram, click on the placeholders indicated inside the diagram above. A text box displays where you can type your text.
If you use a chart, you can type the data in the Excel window displayed on the right side of the working chart. You can change the values to correspond with the data you wish to display.
Step 3: Insert or Reduce Shapes
When drawing diagrams, you are required to include new shapes or even remove some existing shapes. Here is how PowerPoint enables this to be achieved:
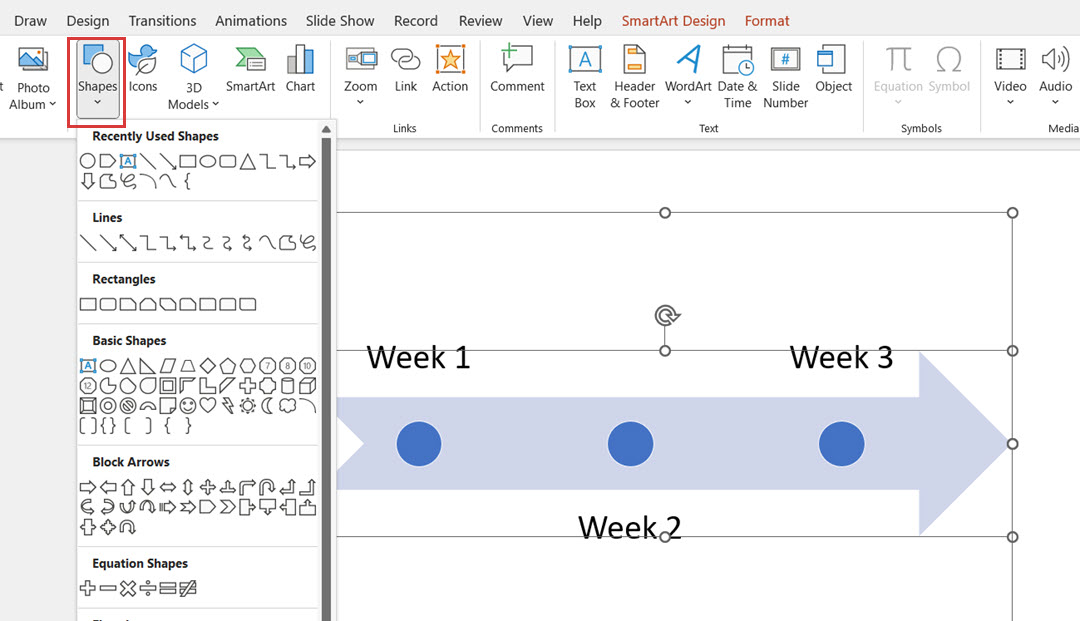
Adding a Shape: To manually add a shape, go to the Insert tab and select the Shapes option. Insert new elements using a text box so that each item is placed individually. To duplicate a shape or text box, simply double-click the desired shape or text box.
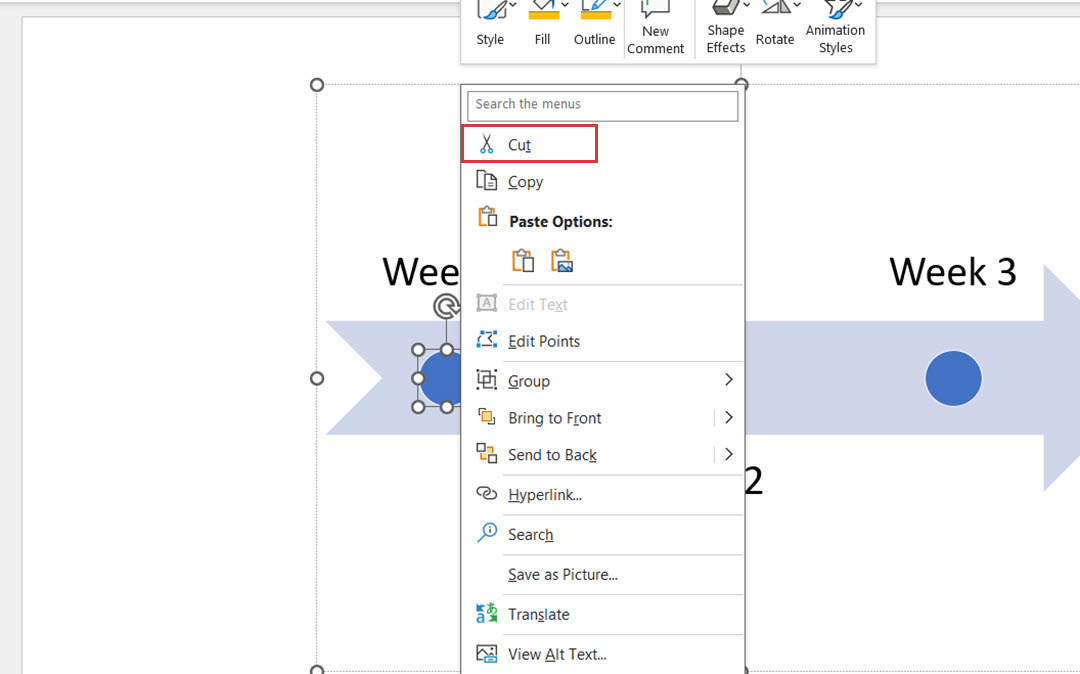
Removing a Shape: To remove the shape from the diagram, right-click the shape and choose Cut.
Step 4: Change Style
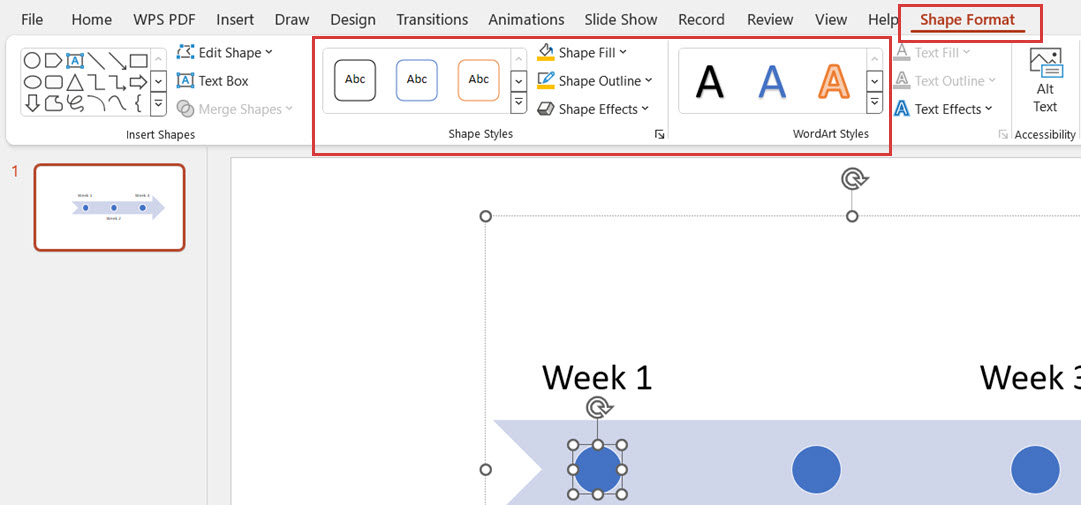
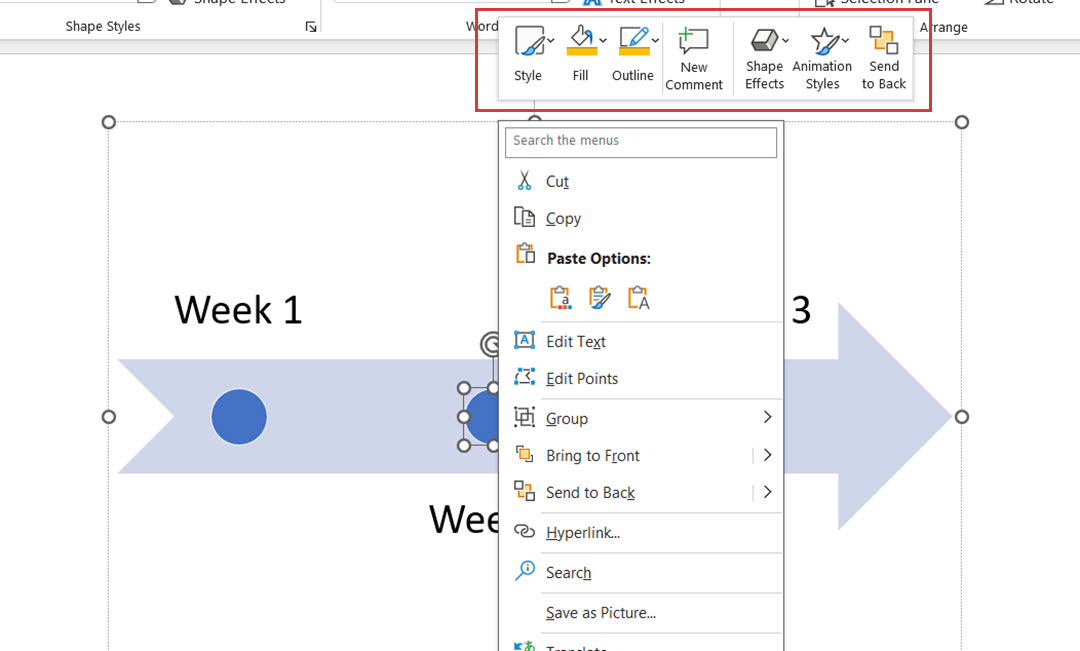
You can use three methods to change the layout, text, or shape of the diagram: from the format menu, from the floating bar, and with one click.
Method 1:
Click on the Format option and change the colors, borders, and the appearance of your text on the diagram.
Method 2:
select the diagram, and you’ll see a floating toolbar that you can use for easy formatting, such as making text bold, changing the font size, and even adjusting the alignment.
Method 3:
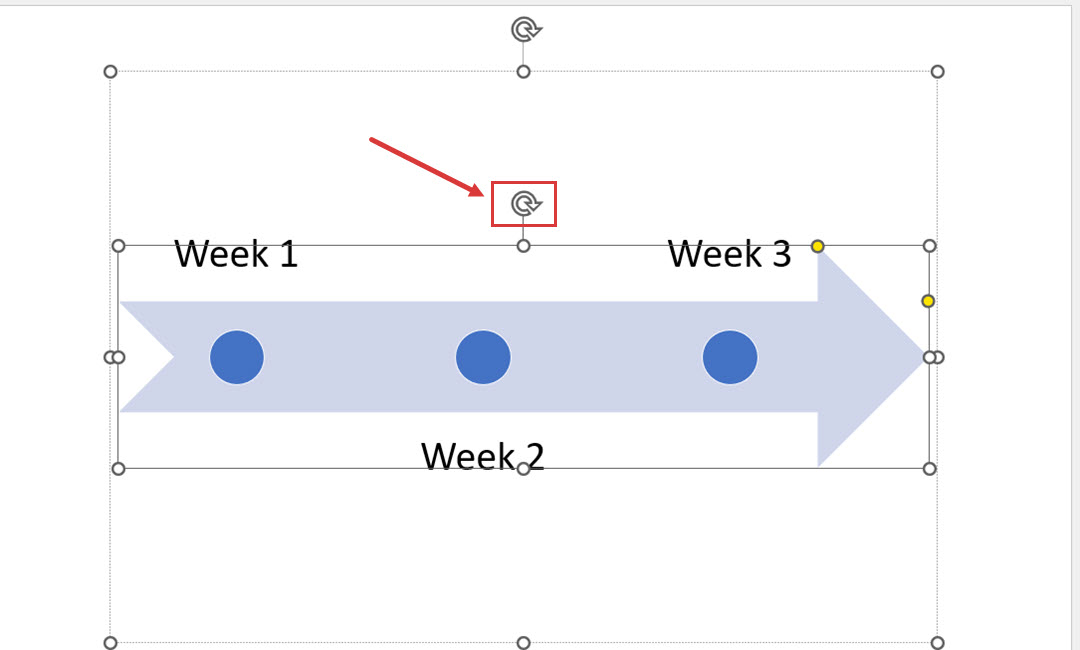
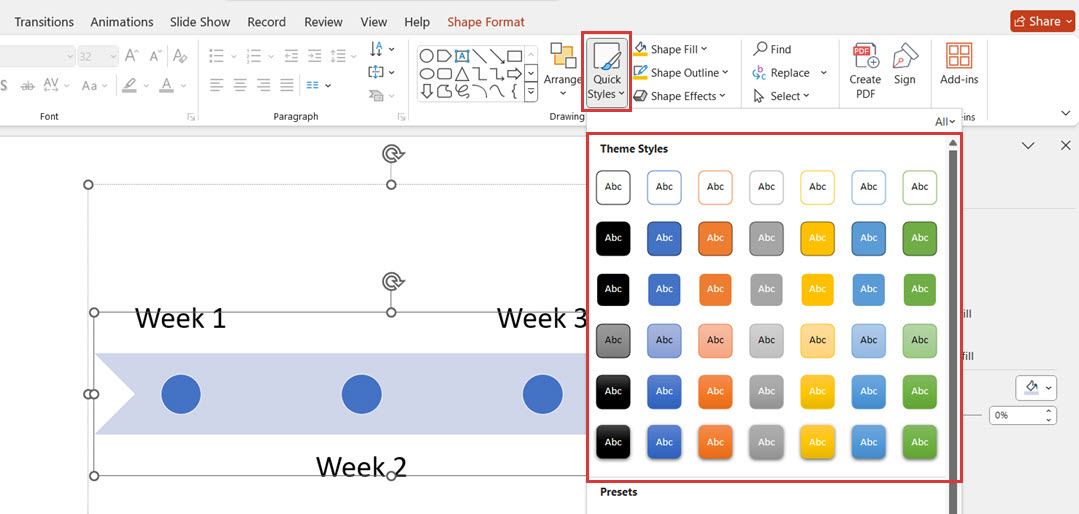
PowerPoint includes several one-click tools that can help you easily change the appearance of your diagram:
One-click layout change: Rotate the entire diagram layout to a new position with just a click on the mouse.
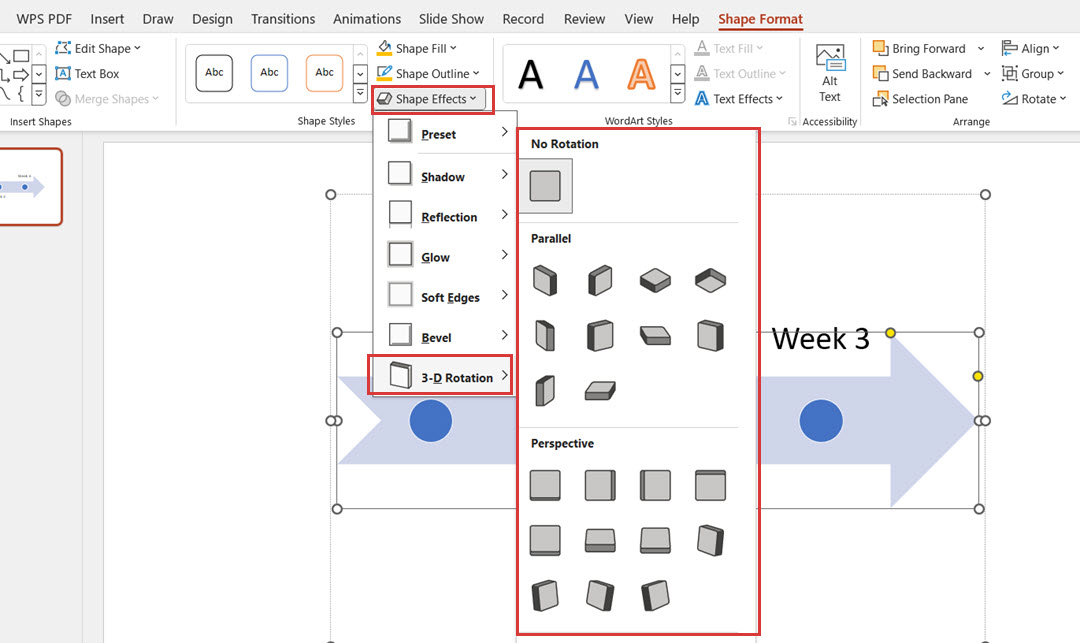
One-click style change: Switch to a different style, including 3D options, through the format panel that will appear on the screen.
One-click color change: Use this option to change color and to make your drawing more attractive.
How to Make a Professional Timeline in PowerPoint
If you want to create a more professional and customized timeline in PowerPoint, follow the given steps. This process will provide you with full control over your design, from data entry to styling:
Step 1:
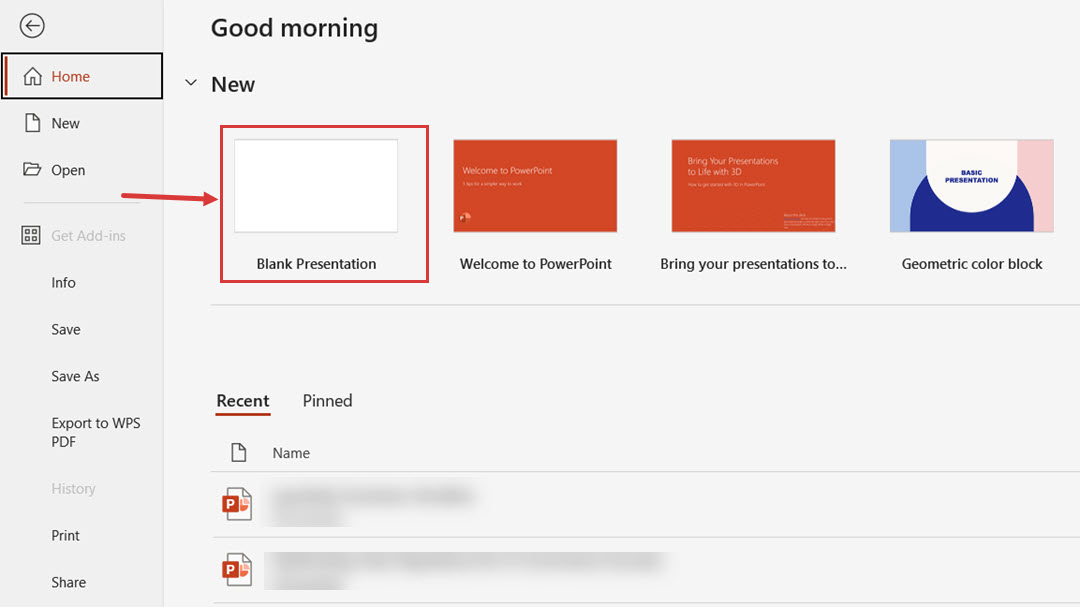
Open PowerPoint and create a new presentation by clicking Blank Presentation.
Step 2:
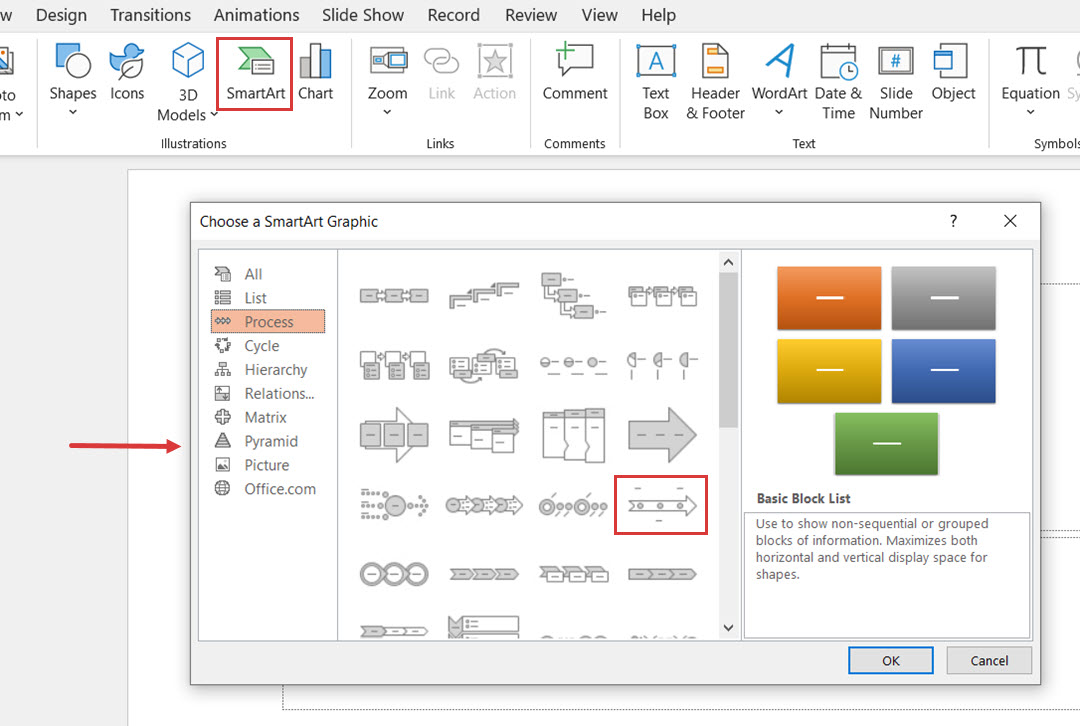
Click the Insert option on Powerpoint’s top navigation, and under the Illustration section, click the SmartArt button from Process options and select Powerpoint basic timeline as a graphic option.
Step 3:
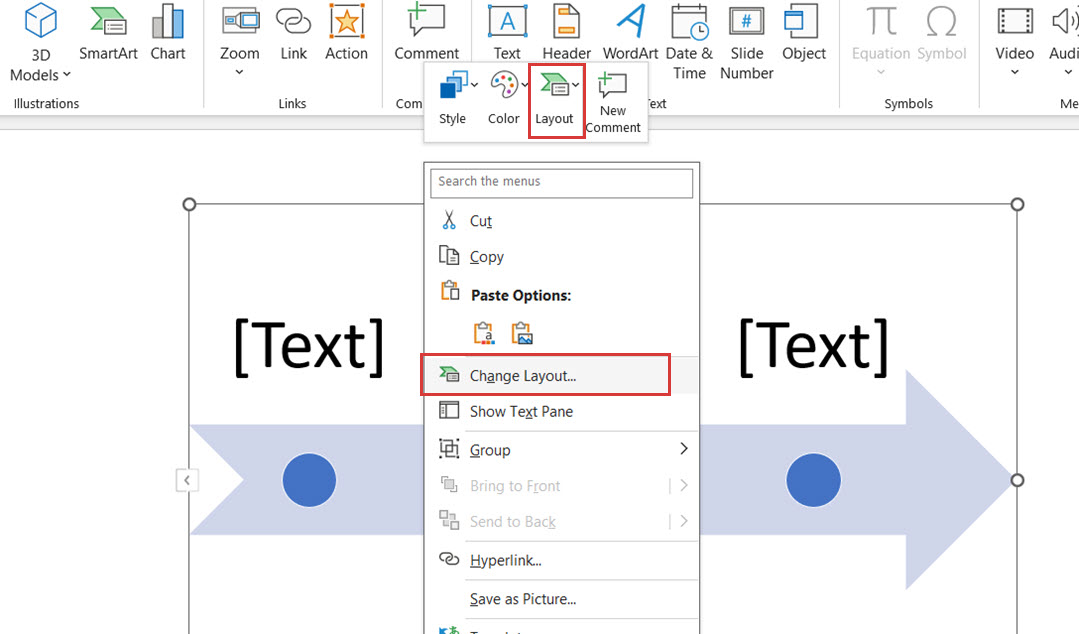
This basic timeline clearly shows the key events or milestones of the project you’re working on. However, you can change the layout design according to your project requirements through the Layouts option.
Step 4:
You can copy the shapes and add as many as you need for your project. Add the text to each shape; ensure that the text aligns with the related milestone.
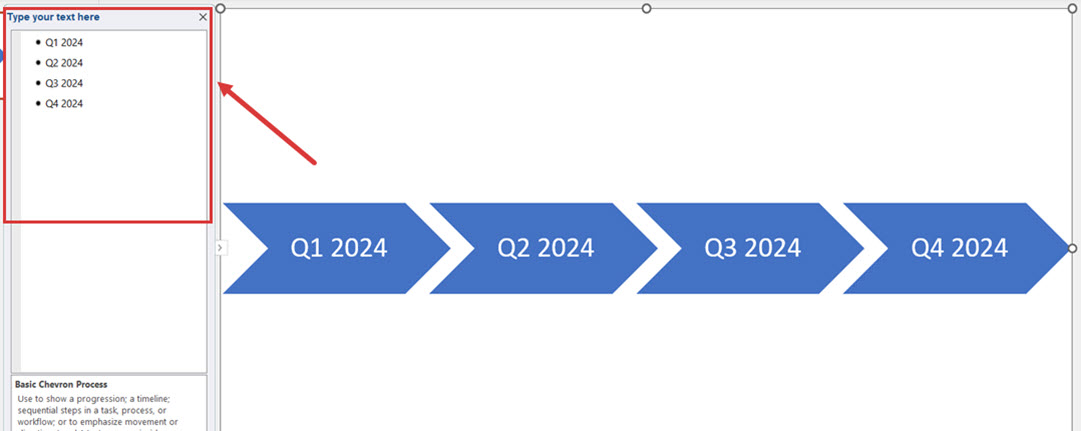
Step 5:
Write a description for each milestone below each shape, keeping a certain distance. This adds much depth to your diagram and allows you to add more details.
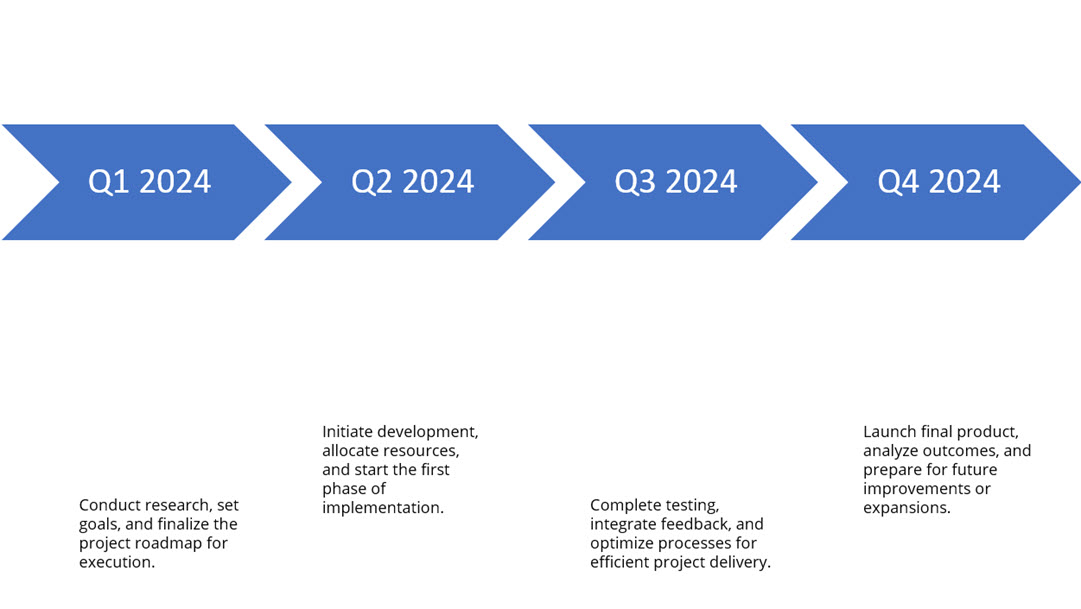
Step 6:
Use the line tool to connect these descriptions to the shapes. This keeps your diagram from looking messy and can make it creative at the same time.
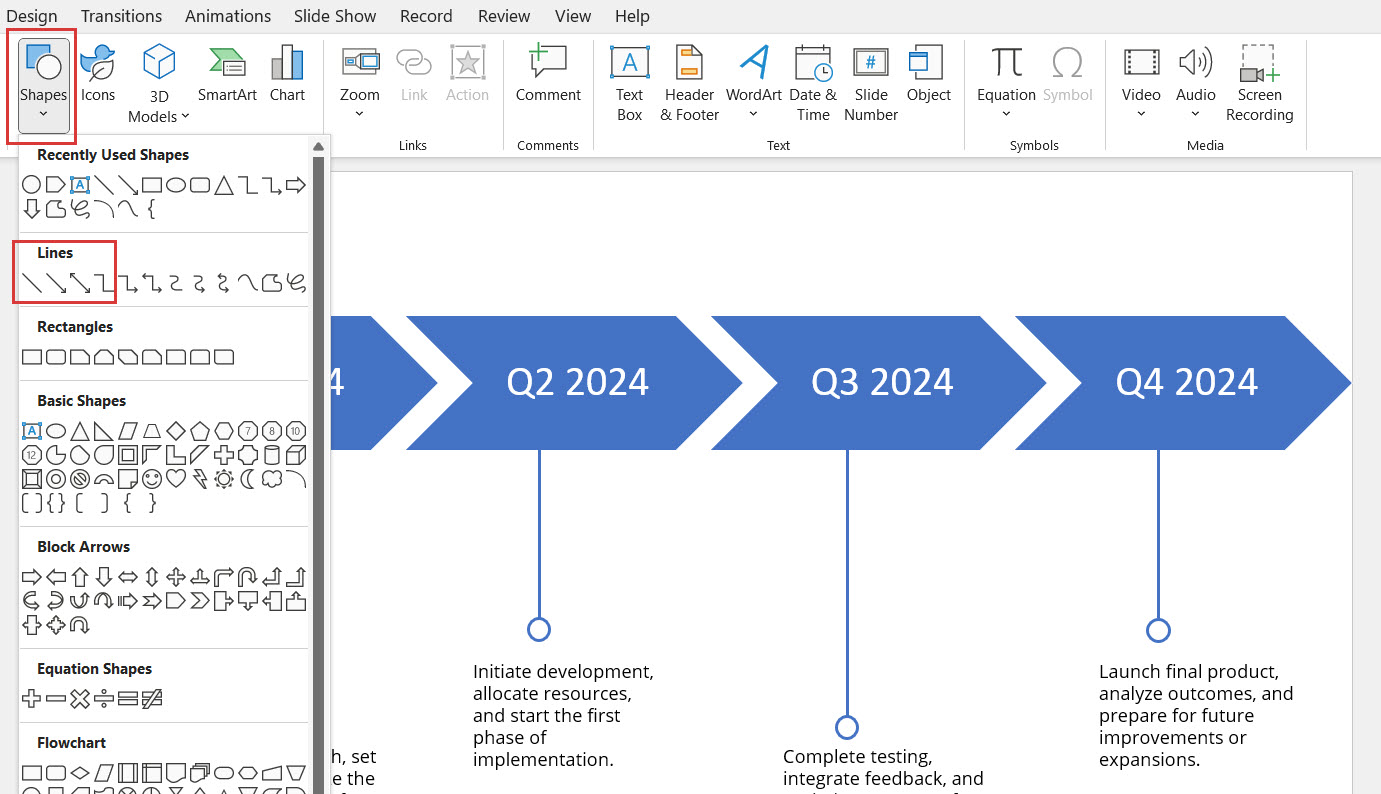
Step 7:
Format the overall look of your timeline by changing the color for the base shapes, line connectors, and text. To do it, right-click on the item you want to change the color of and choose the color you want to add.
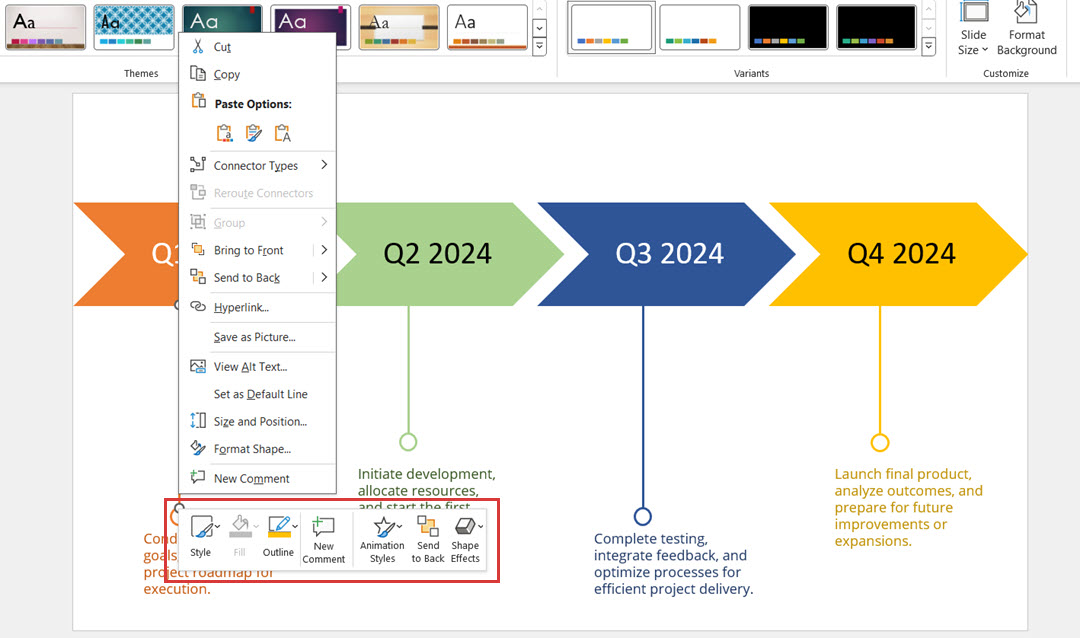
Step 8:
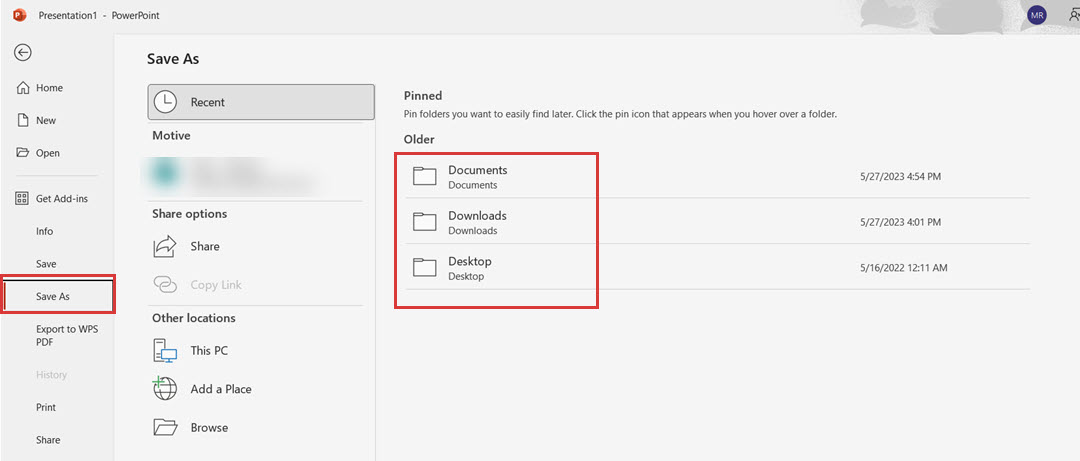
Once you’re done making all the changes to your timeline, Click on the File option in the top left corner and click Save As or Export.
Click the Save As option, name it, and save the file in your desired personal drive documents.
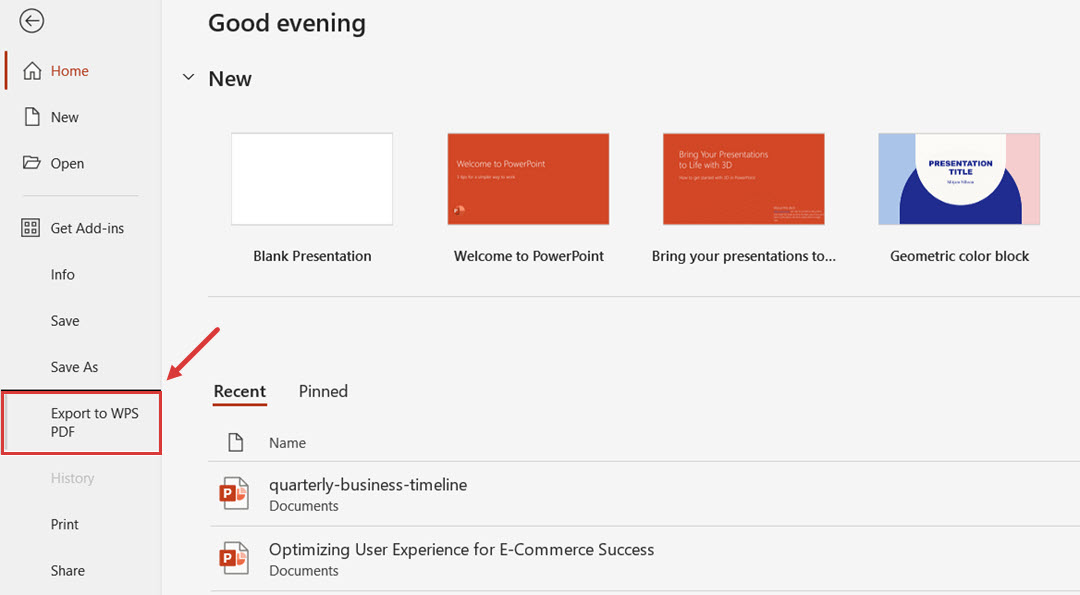
When you click Export, you get the option to export the timeline in WPS or PDF format. However, you must save the document before converting it to any other format.
Best Practices for Making a More Visually Appealing and Effective Diagram
To make your diagram not only functional but visually appealing, here are some key tips:
Tip 1: Convert Your Written Text to Images
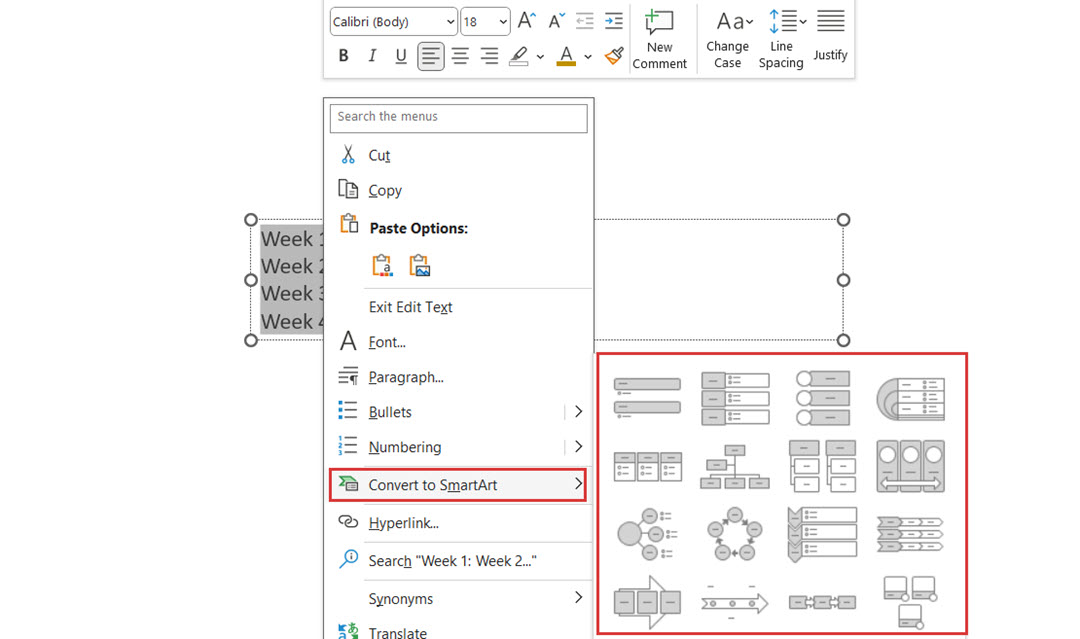
Powerpoint offers a smart feature that converts your text into visually appealing diagrams. Use this feature to save your time. To do this:
- Add the text to your slide.
- Select the text and right-click on it.
- Choose Convert to SmartArt from the options.
- Choose the diagram you want to create out of the text.
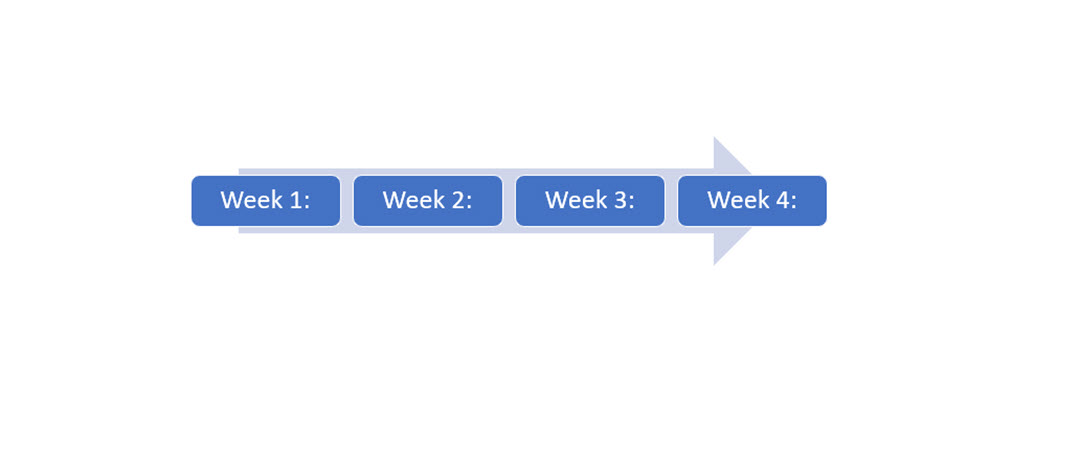
You’ll get a complete diagram created on your slide, which you can use for your projects by making simple edits.
Tip 2: Use PowerPoint's Alignment Options
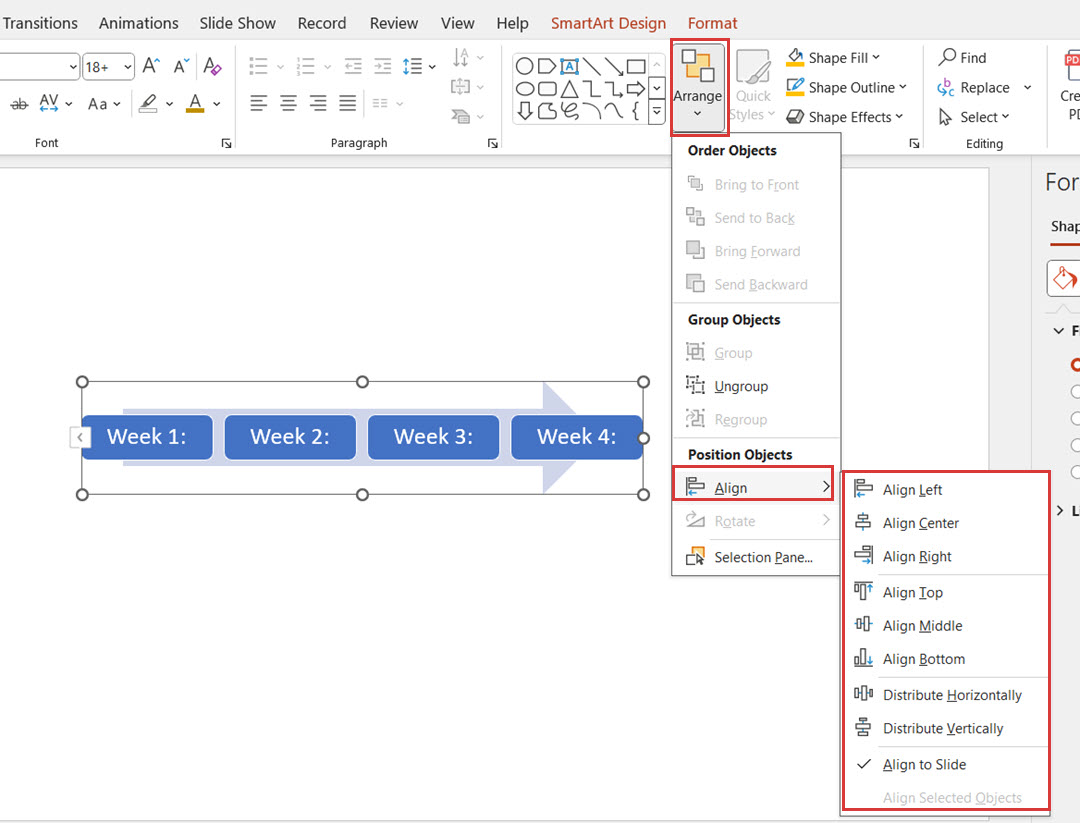
Use PowerPoint’s built-in alignment feature to make your diagram look more polished and professional. This ensures even spacing and proper alignment without manually dragging objects, helping to maintain a neat and consistent layout.
To use this feature, select the diagram and click Home. Then click Arrange and choose Align; you can select Align Left, Align Center, Distribute Horizontally, etc.
Easily Make A Better Diagram With Edraw.AI
Edraw.AI is a free online visual collaboration app offering a rich set of tools designed to simplify the creation of diagrams. With Edraw.AI, you can generate diagrams in just a few clicks by simply inputting prompts into the tool. Additionally, these diagrams are 100% customizable, allowing you to modify or alter them to suit your needs easily.
Follow the steps below to draw a timeline diagram in Edraw.AI:
Step 1:
Open Edraw.AI and log in with your Wondershare ID or through social networks. If you don’t have an account, sign up to create a new one.
Step 2:
Click the Templates option on the left-hand side of the menu.

Step 3:
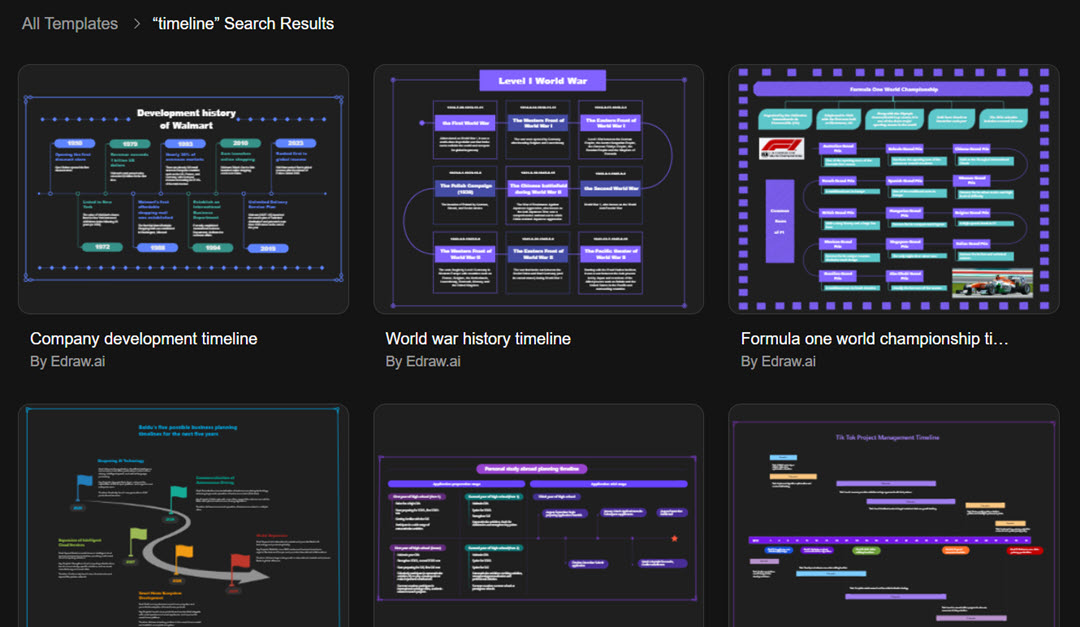
Type “timeline” in the search bar to find or explore the templates directly by scrolling down to the bottom. Choose the template that best suit your project context.
Step 4:
The selected template will be launched in the editor, and you can alter the text, shapes, and positions further.
Step 5:
When you’ve created a diagram using Edraw.AI, click Export and select from the available options.
If you want to use this timeline in PowerPoint, click Export to Image and import the downloaded template to your presentation.
Final Words
Making diagrams and charts in Microsoft PowerPoint can be an effective way to improve your presentations, especially when working on simple or advanced graphics. From the procedure described above, it is quite simple to go through each and every stage and take advantage of PowerPoint functionalities to achieve well-designed and effective graphics.
For those who want to take it a step further, there are softer tools like Edraw. The use of AI provides a convenient and intelligent mode of operation. These techniques can be used to enhance your presentation skills and increase the effectiveness of the content being delivered.
FAQs
FAQ
-
Is it possible to insert a 3D diagram on a PowerPoint?
Yes, you can create 3D diagrams in Microsoft PowerPoint through the Format tab of the Shapes section. -
Can I animate a diagram in PowerPoint?
Yes, there are many animations under the Animations tab in PowerPoint. You can also set animations for the entrances and exits in the diagram and emphasize animations for selected elements. -
What are other applications that can be used instead of PowerPoint in drawing diagrams?
More versatile and popular tools, such as Edraw.AI, Lucidchart, and Canva, provide a larger selection of templates for generating diagrams.

Try Our Products
Now for Free


