Microsoft PowerPoint is an exceptional tool that lets you create effective presentations to present your ideas to your target audience.
A presentation becomes more appealing when you add a visual representation (like a flowchart) of your concept or idea. The reason behind this fact is that the visual data appeals to the audience more than the textual information.
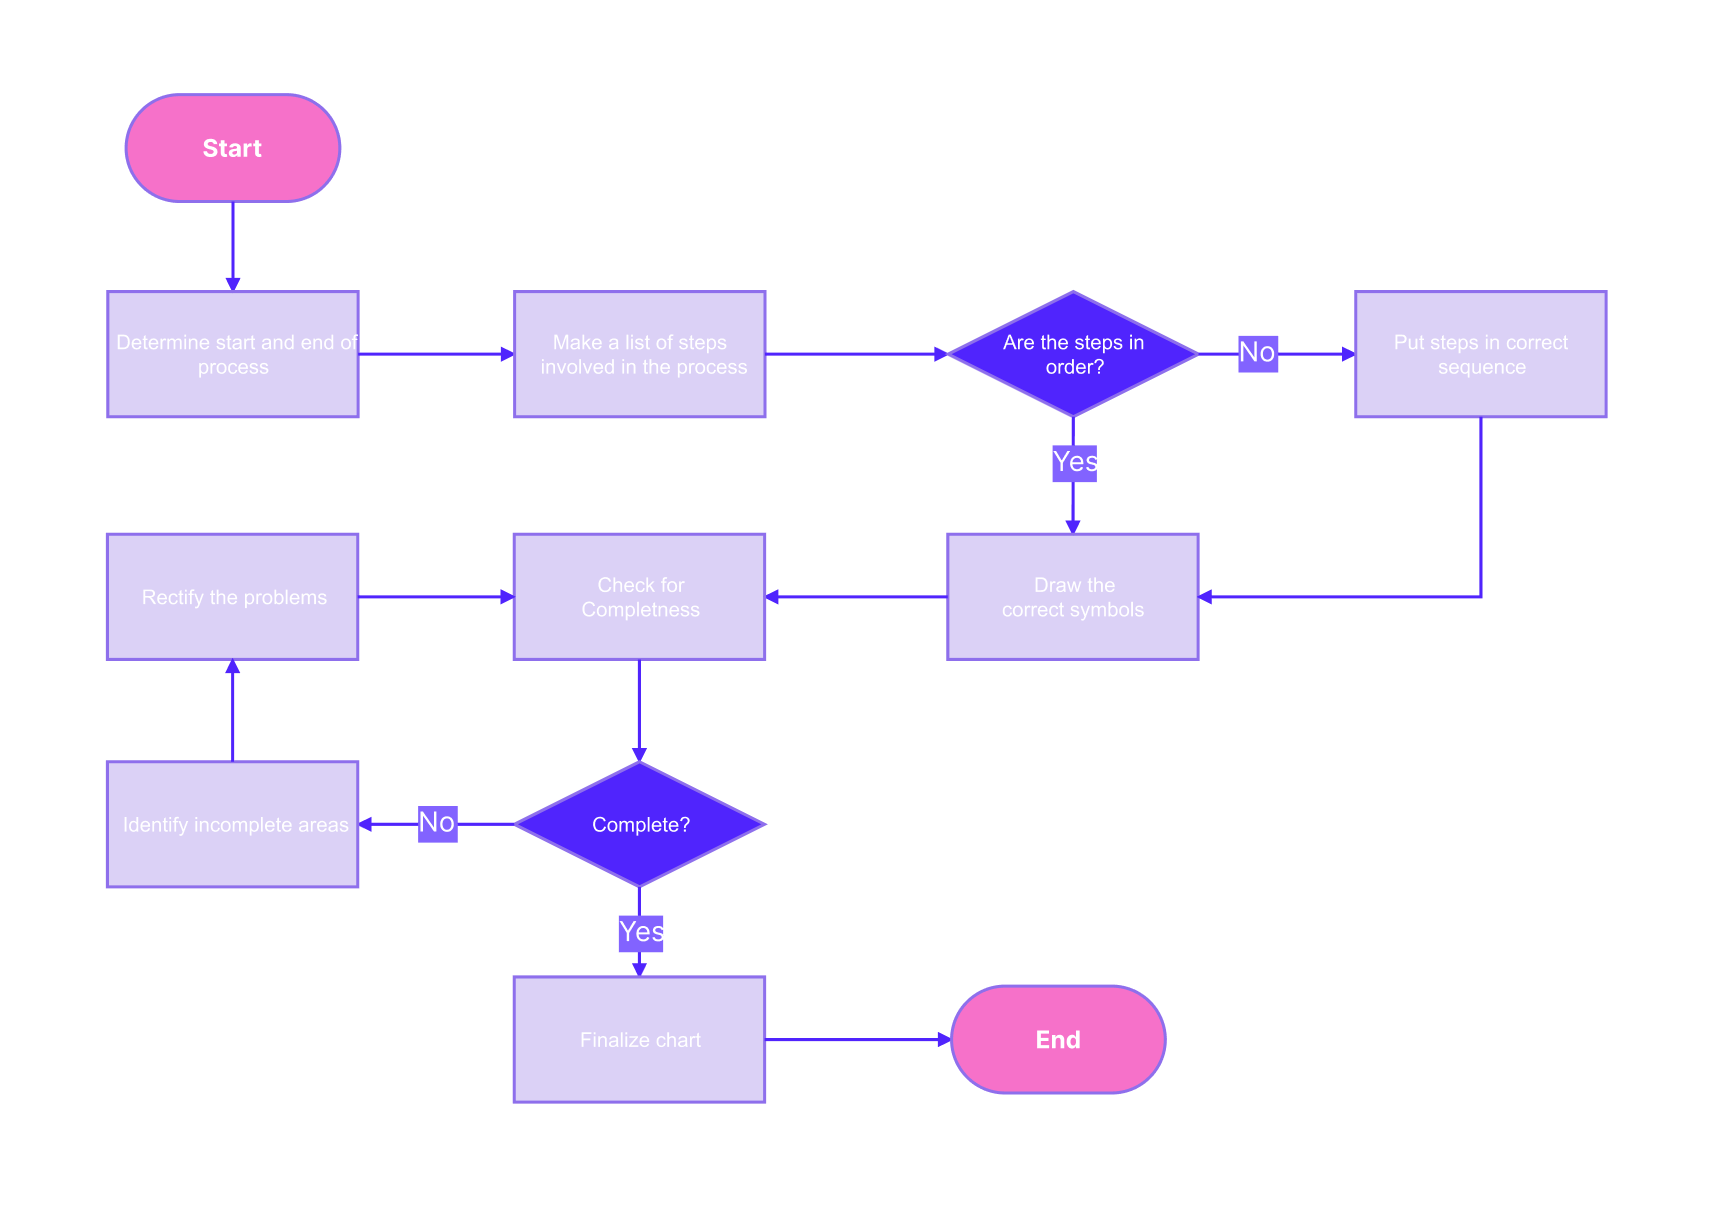
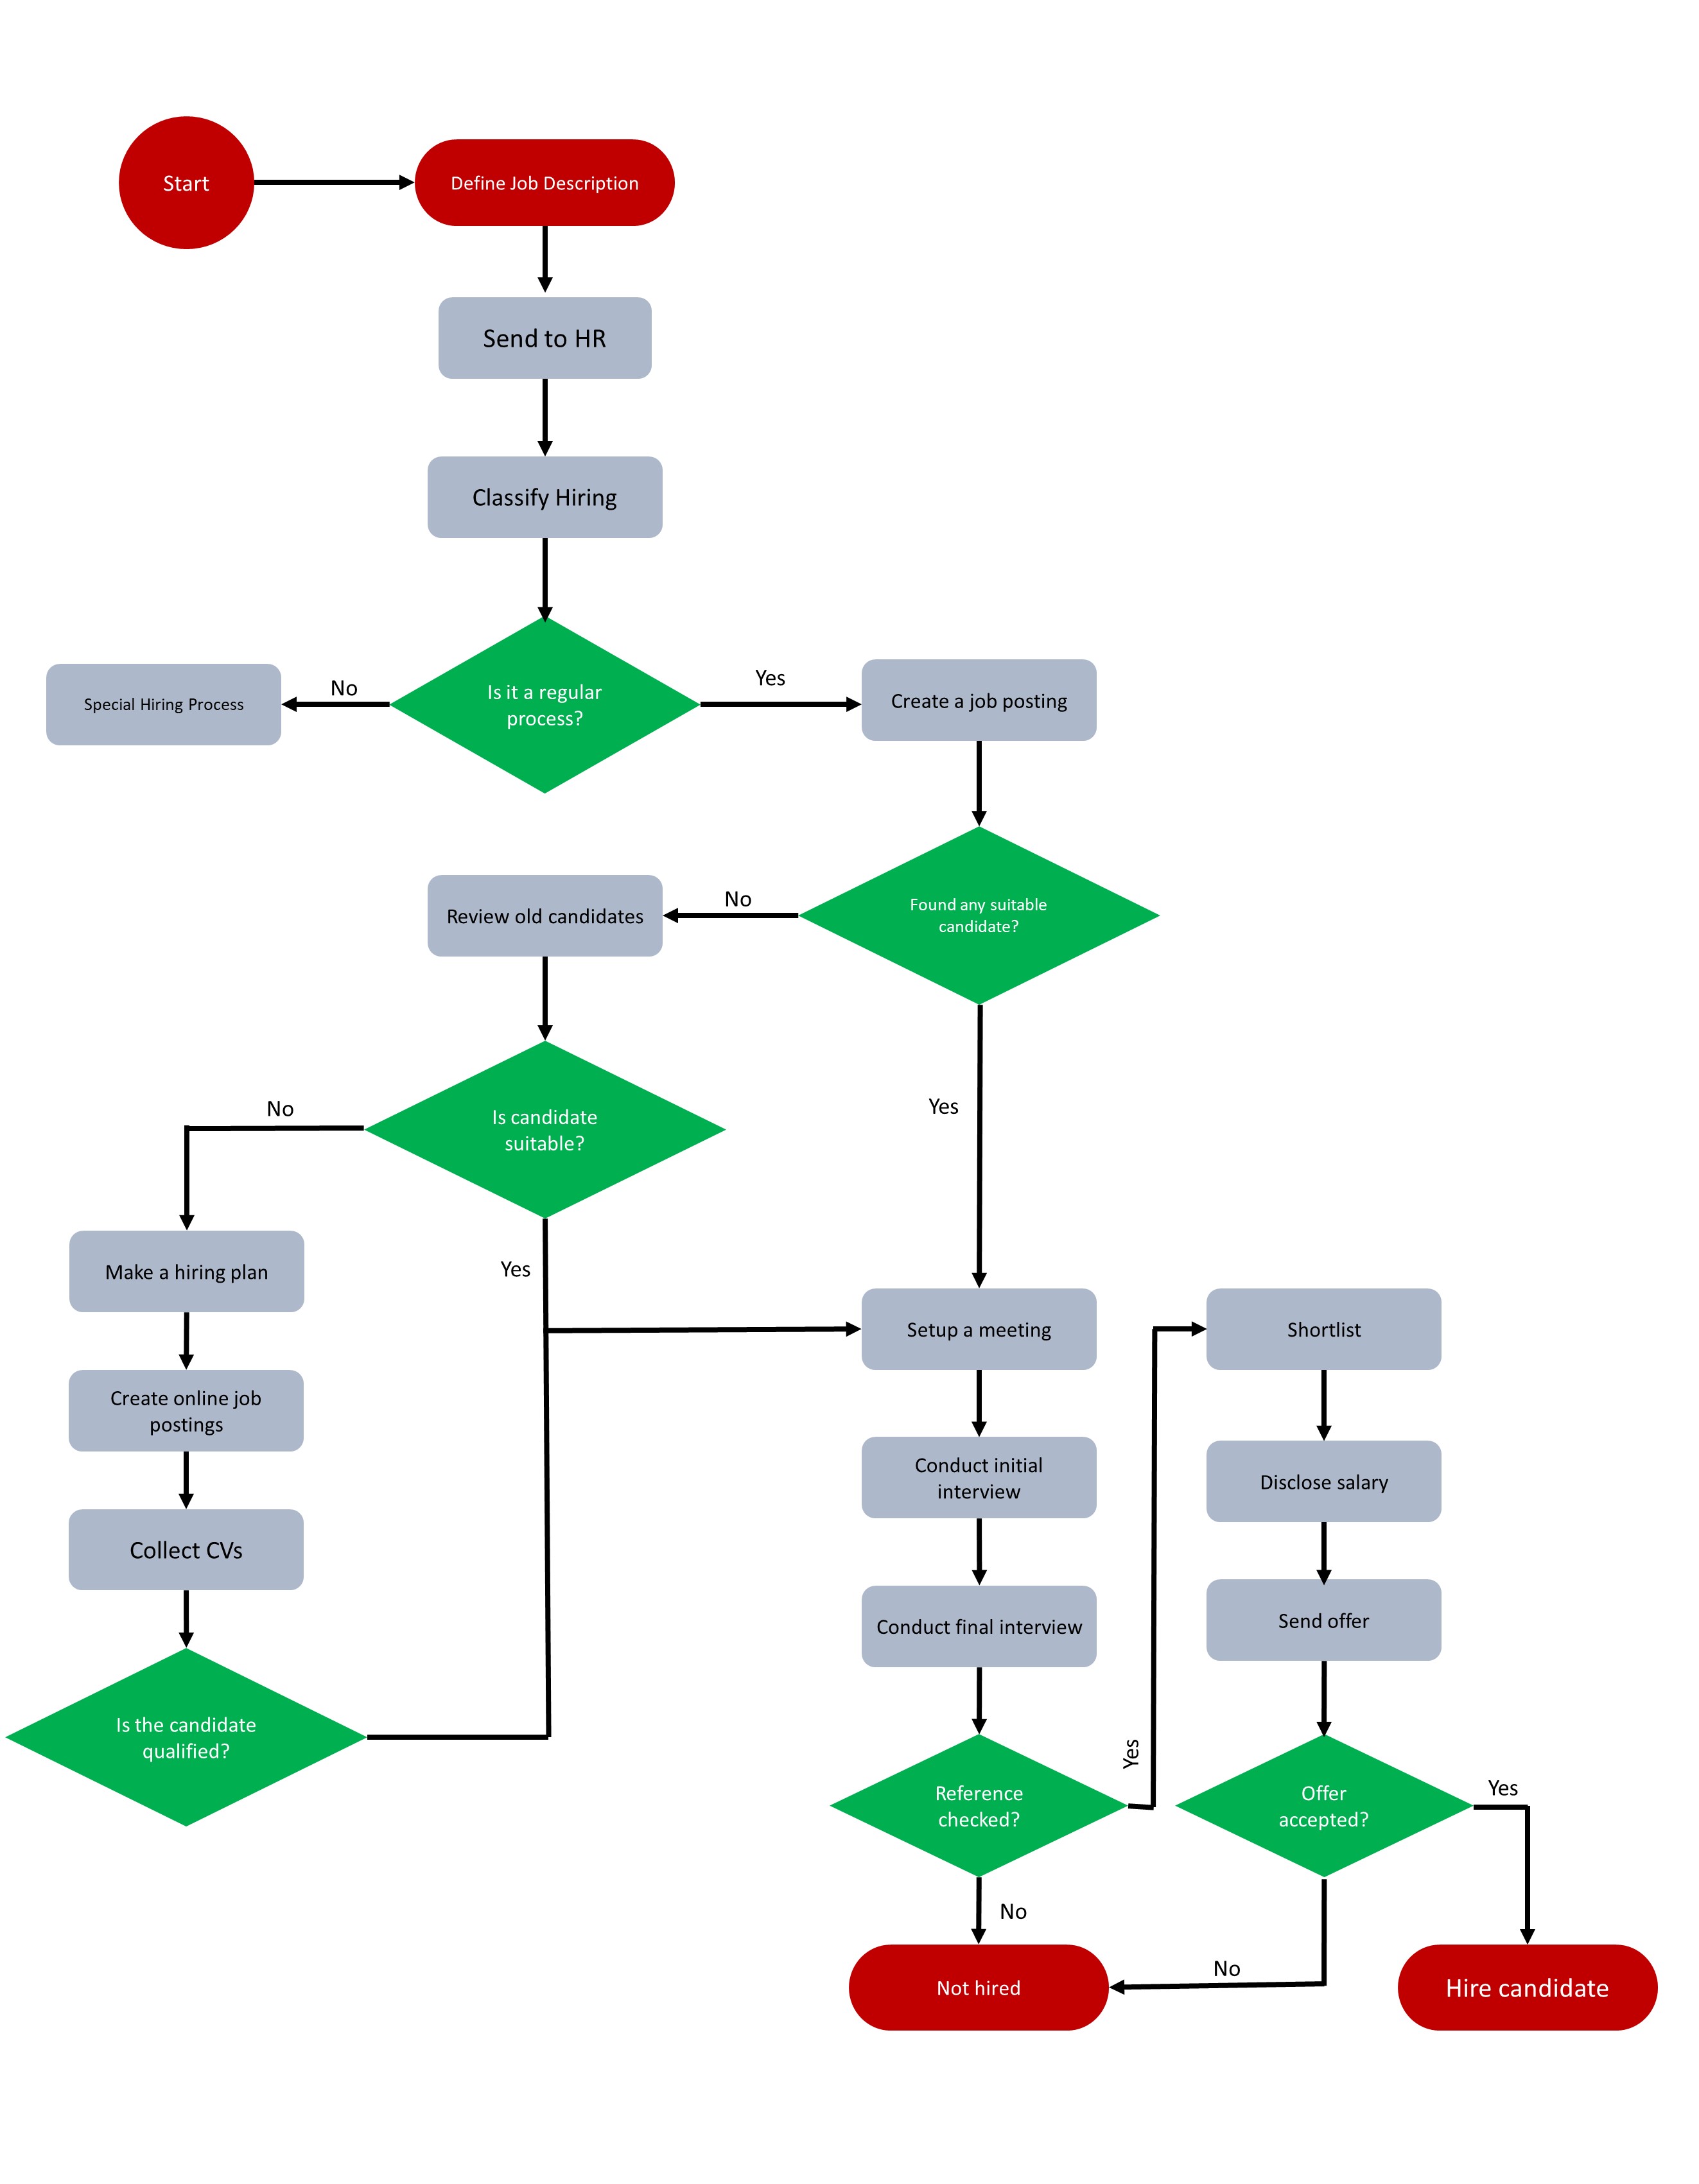
For example, a flowchart helps you describe the whole concept with a simple picture. It divides the process into different steps and organizes them all sequentially to make them easily understandable for every viewer.
You may find it difficult to create this diagram in PowerPoint because you might not have done this before. But don’t be concerned, as we will teach you how to make a flowchart in Microsoft PowerPoint in this read.
In this article
Part 1. How to Make a Basic Flowchart in Microsoft PowerPoint?
There are multiple ways to create a basic flowchart in PowerPoint, such as using a template and making it from scratch. Making this diagram with the pre-built template is the simplest way, so let’s first proceed with this method.
Step 1: Open a Template
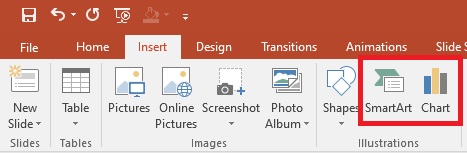
You can find flowchart templates in SmartArt or Chart. There are two ways to access these tools.
Enter the "Insert tab" from the top ribbon and find them in the Illustrations section.
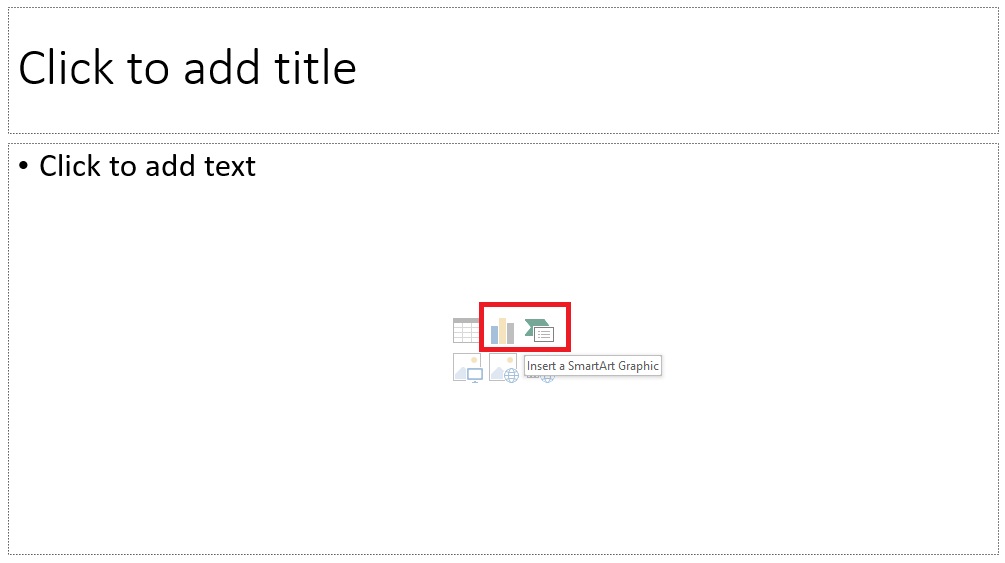
Create a new slide and look at the icons displayed at the center of the slide.
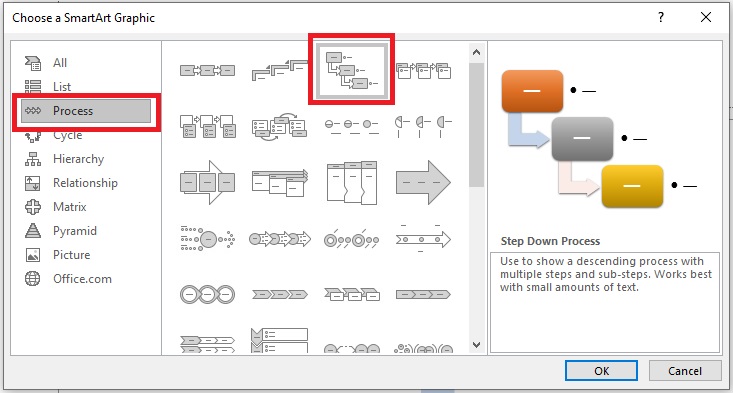
Click "SmartArt", tap on "Process", and choose a template from the list. Then, press "OK".
You will see the template on your screen, as shown below.

Step 2: Edit Text
Click on the center of any shape to add or edit text. You can also add text in the text boxes in the same manner.

Step 3: Remove or Add Shapes
You can add or remove shapes from the chosen flowchart template while keeping your requirements in mind.
Add a Shape
There are four ways to add shape to your template.
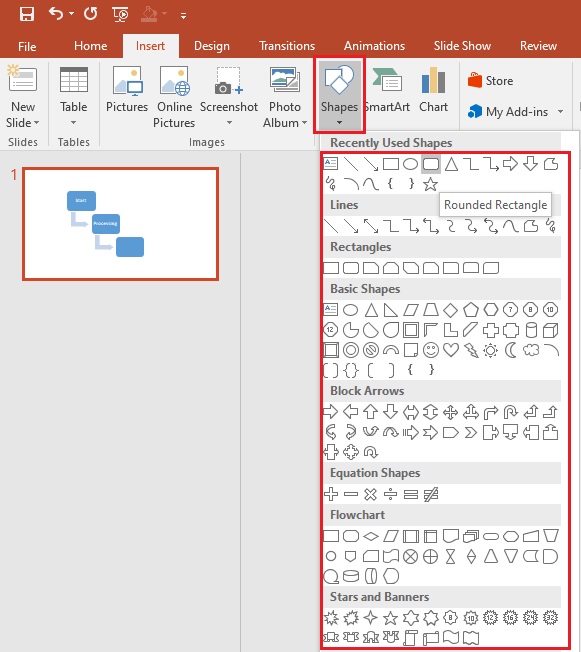
Go to the "Insert" tab from the navigation bar, click "Shapes" to open the collection, and choose the desired shape for your chart. You can drag this shape to the appropriate position in the chart.
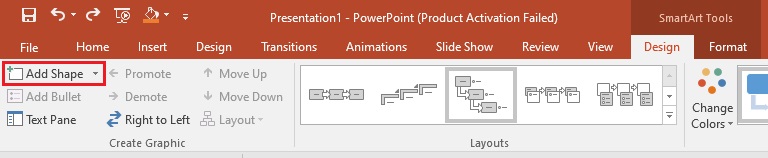
Click on the SmartArt graphics and click "Add Shape" from the top-left corner inside the "Design" tab, as shown below.
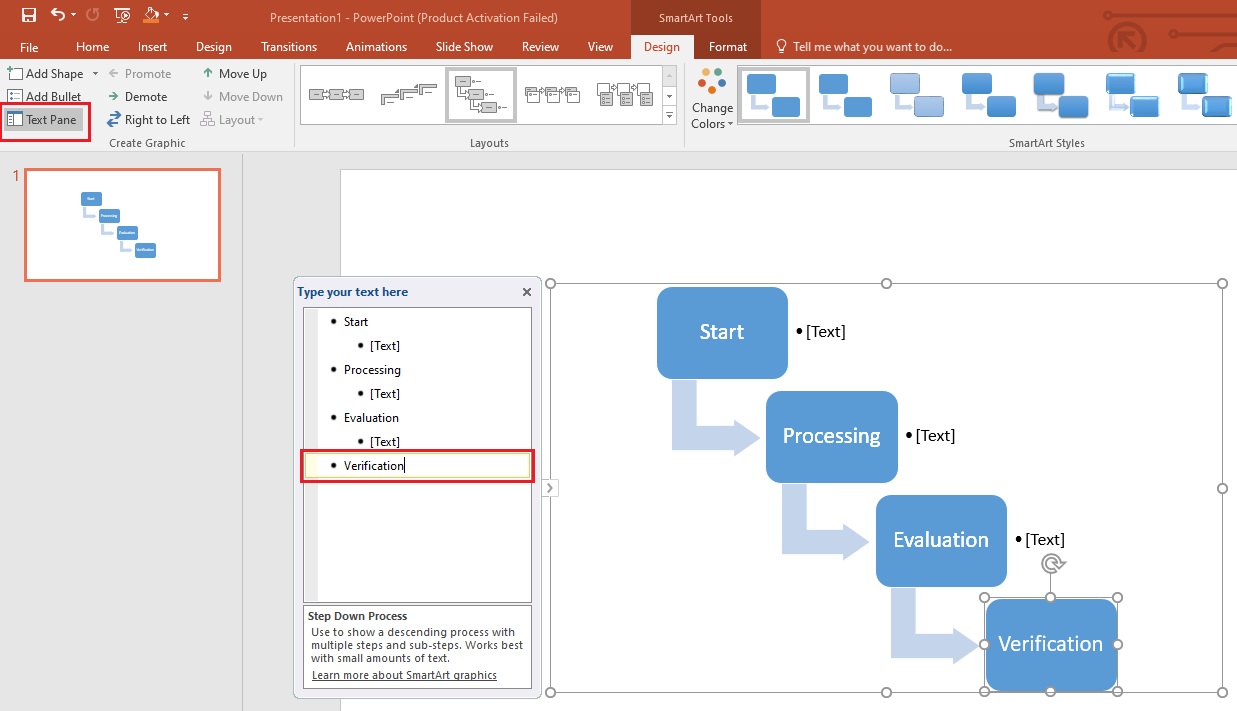
Click "Text Pane" from the navigation bar and add a part.
Copy a shape from the flowchart and paste it using CTRL+Vkeys.
Remove a Shape
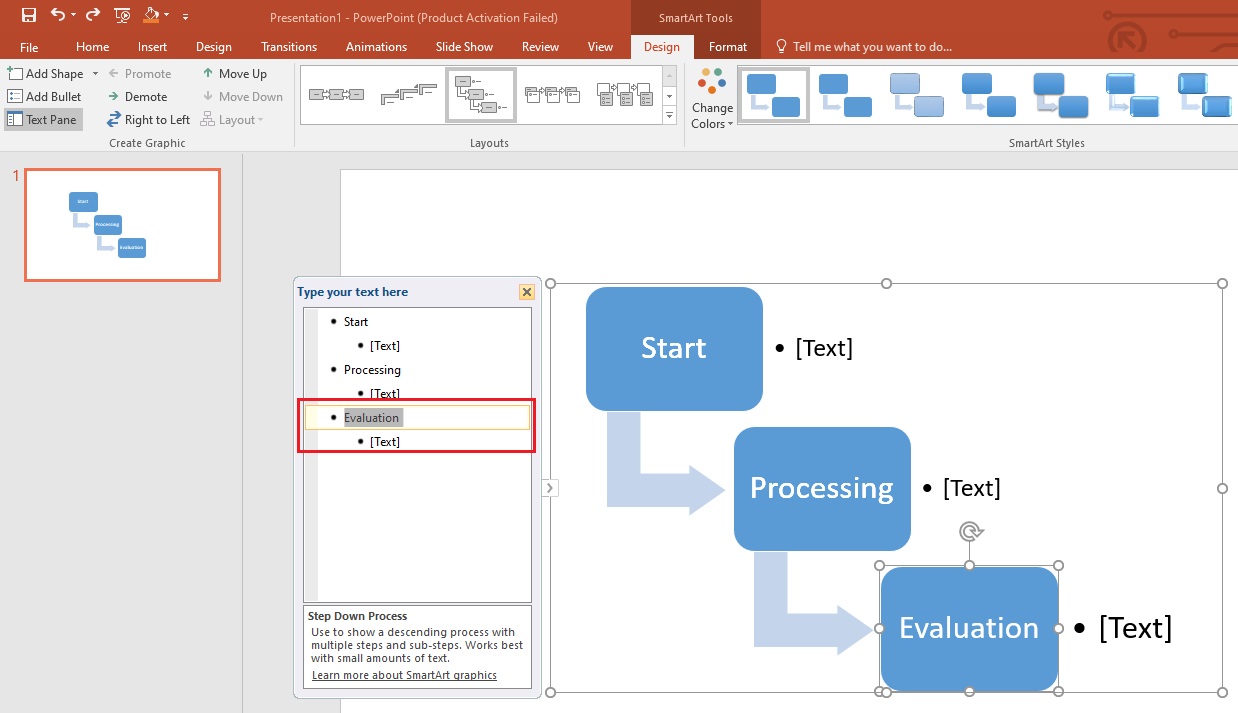
If you want to remove a shape from the chart, you can simply choose the shape and press the "Delete" button from the keyboard to remove it.

Alternatively, you can delete it by deleting a part in the text box.
Step 4: Change Style
PowerPoint enables you to change the layout, text, and shape style in your flowchart. There are three different methods to do this job, as given below.
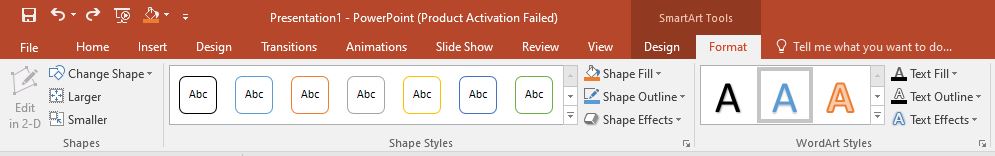
Method 1: Format Menu
Enter the "Format" tab from the top menu. Here, you can change shape style, shape effects, shape colors, text effects, text style, and more.
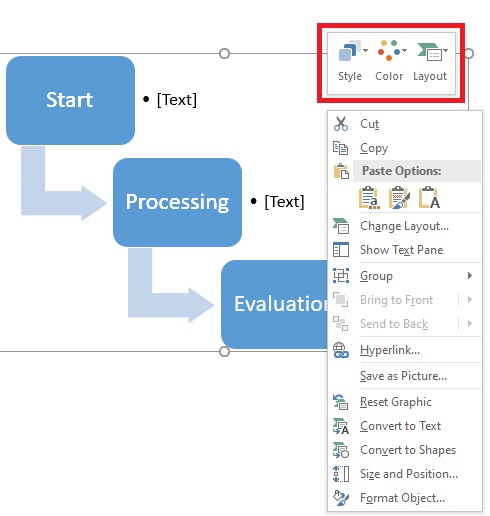
Method 2: Floating Toolbar
Right-click the diagram and you will see a floating toolbar. It allows you to change the style, color, and layout of your flowchart.
Method 3: One-Click Change
PowerPoint's one-click feature provides you with an unmatched experience while creating a flowchart. It helps you style the diagram in no time. You will find this feature inside the "Design" tab.
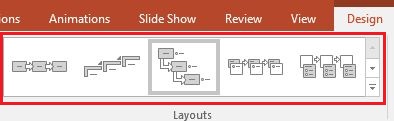
One-Click Layout Change
Click on any style in the Layouts section. The chart will be modified accordingly.
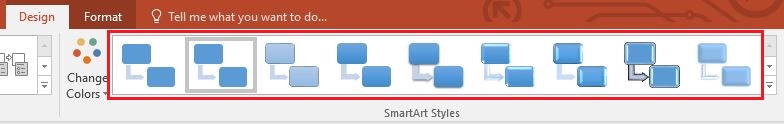
One-Click Style Change
Inside the "SmartArt Styles" section, click on any style you want to modify your flowchart.
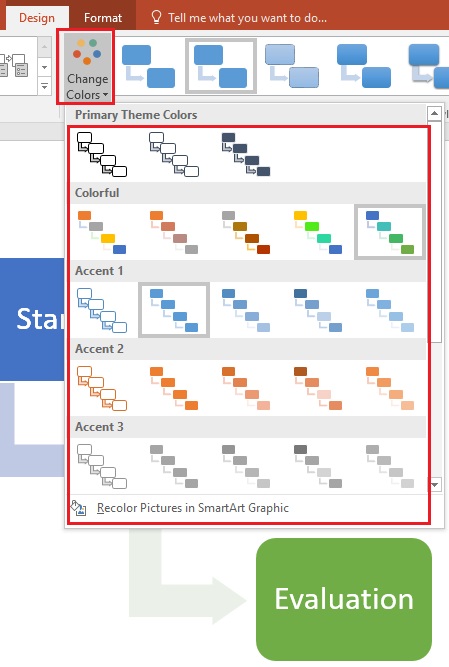
One-Click Color Change
Open the "Change Colors" list and choose your desired color scheme for the chart.
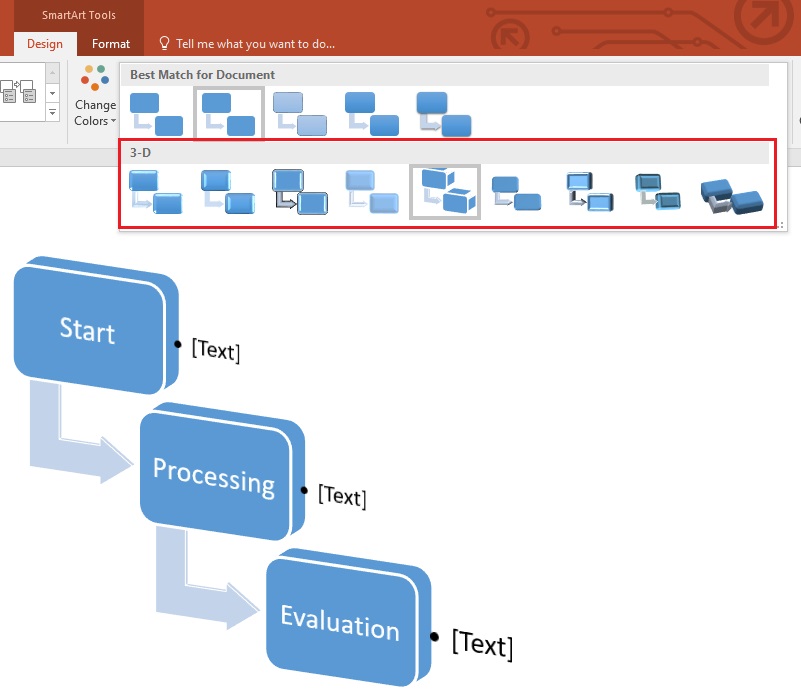
You can also convert your chart into a 3D format by choosing the desired three-dimensional style, as shown below.
Part 2. How to Make a Professional Flowchart in PowerPoint?
Professional flowcharts contain a lot of information, which is why they are bigger than simple charts. Following the steps below will help you create a professional flowchart in PowerPoint.
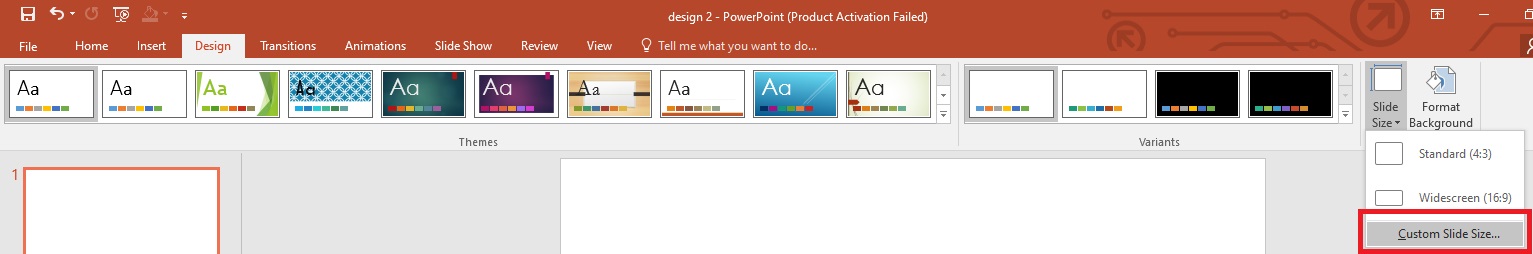
Step 1: Adjust the slide size according to the complexity of your chart. In case of bigger charts, the slide size will also be large. Click "Custom Slide Size".
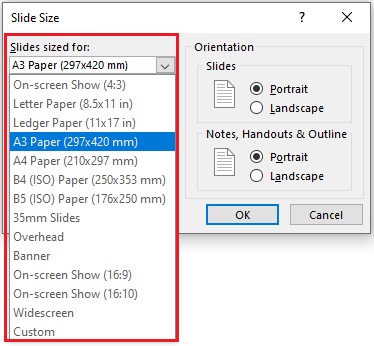
Choose the size from the list or enter your preferred dimensions, considering your requirements.
Step 2: Click on "Shapes", choose the ones you need, and place them on the slide.
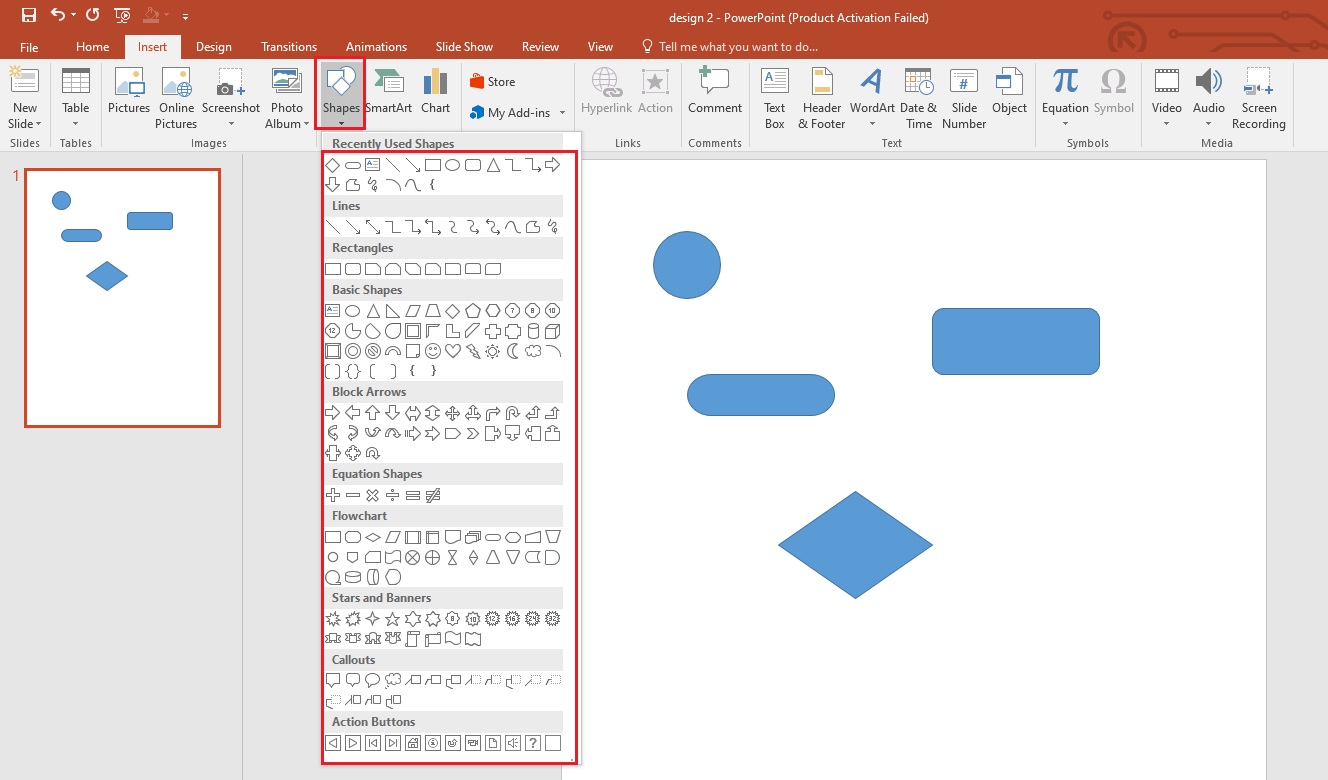
Step 3: Organize all the shapes. Make sure the size and space between them are uniform.
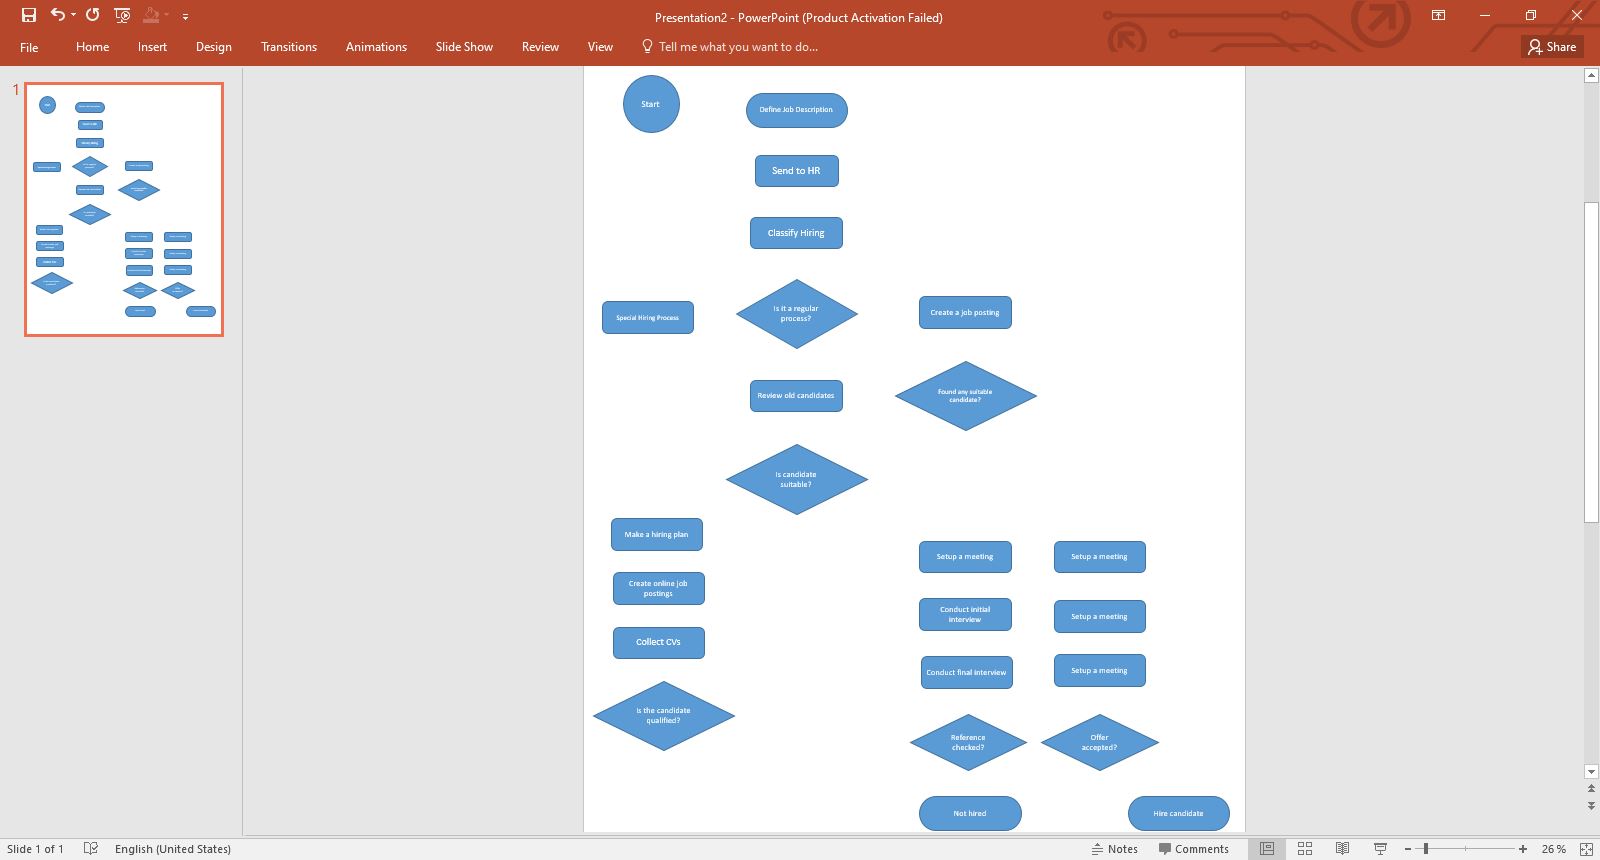
Step 4: Connect all the organized shapes with arrows. You can see the space between all the shapes and their sizes are uniform.
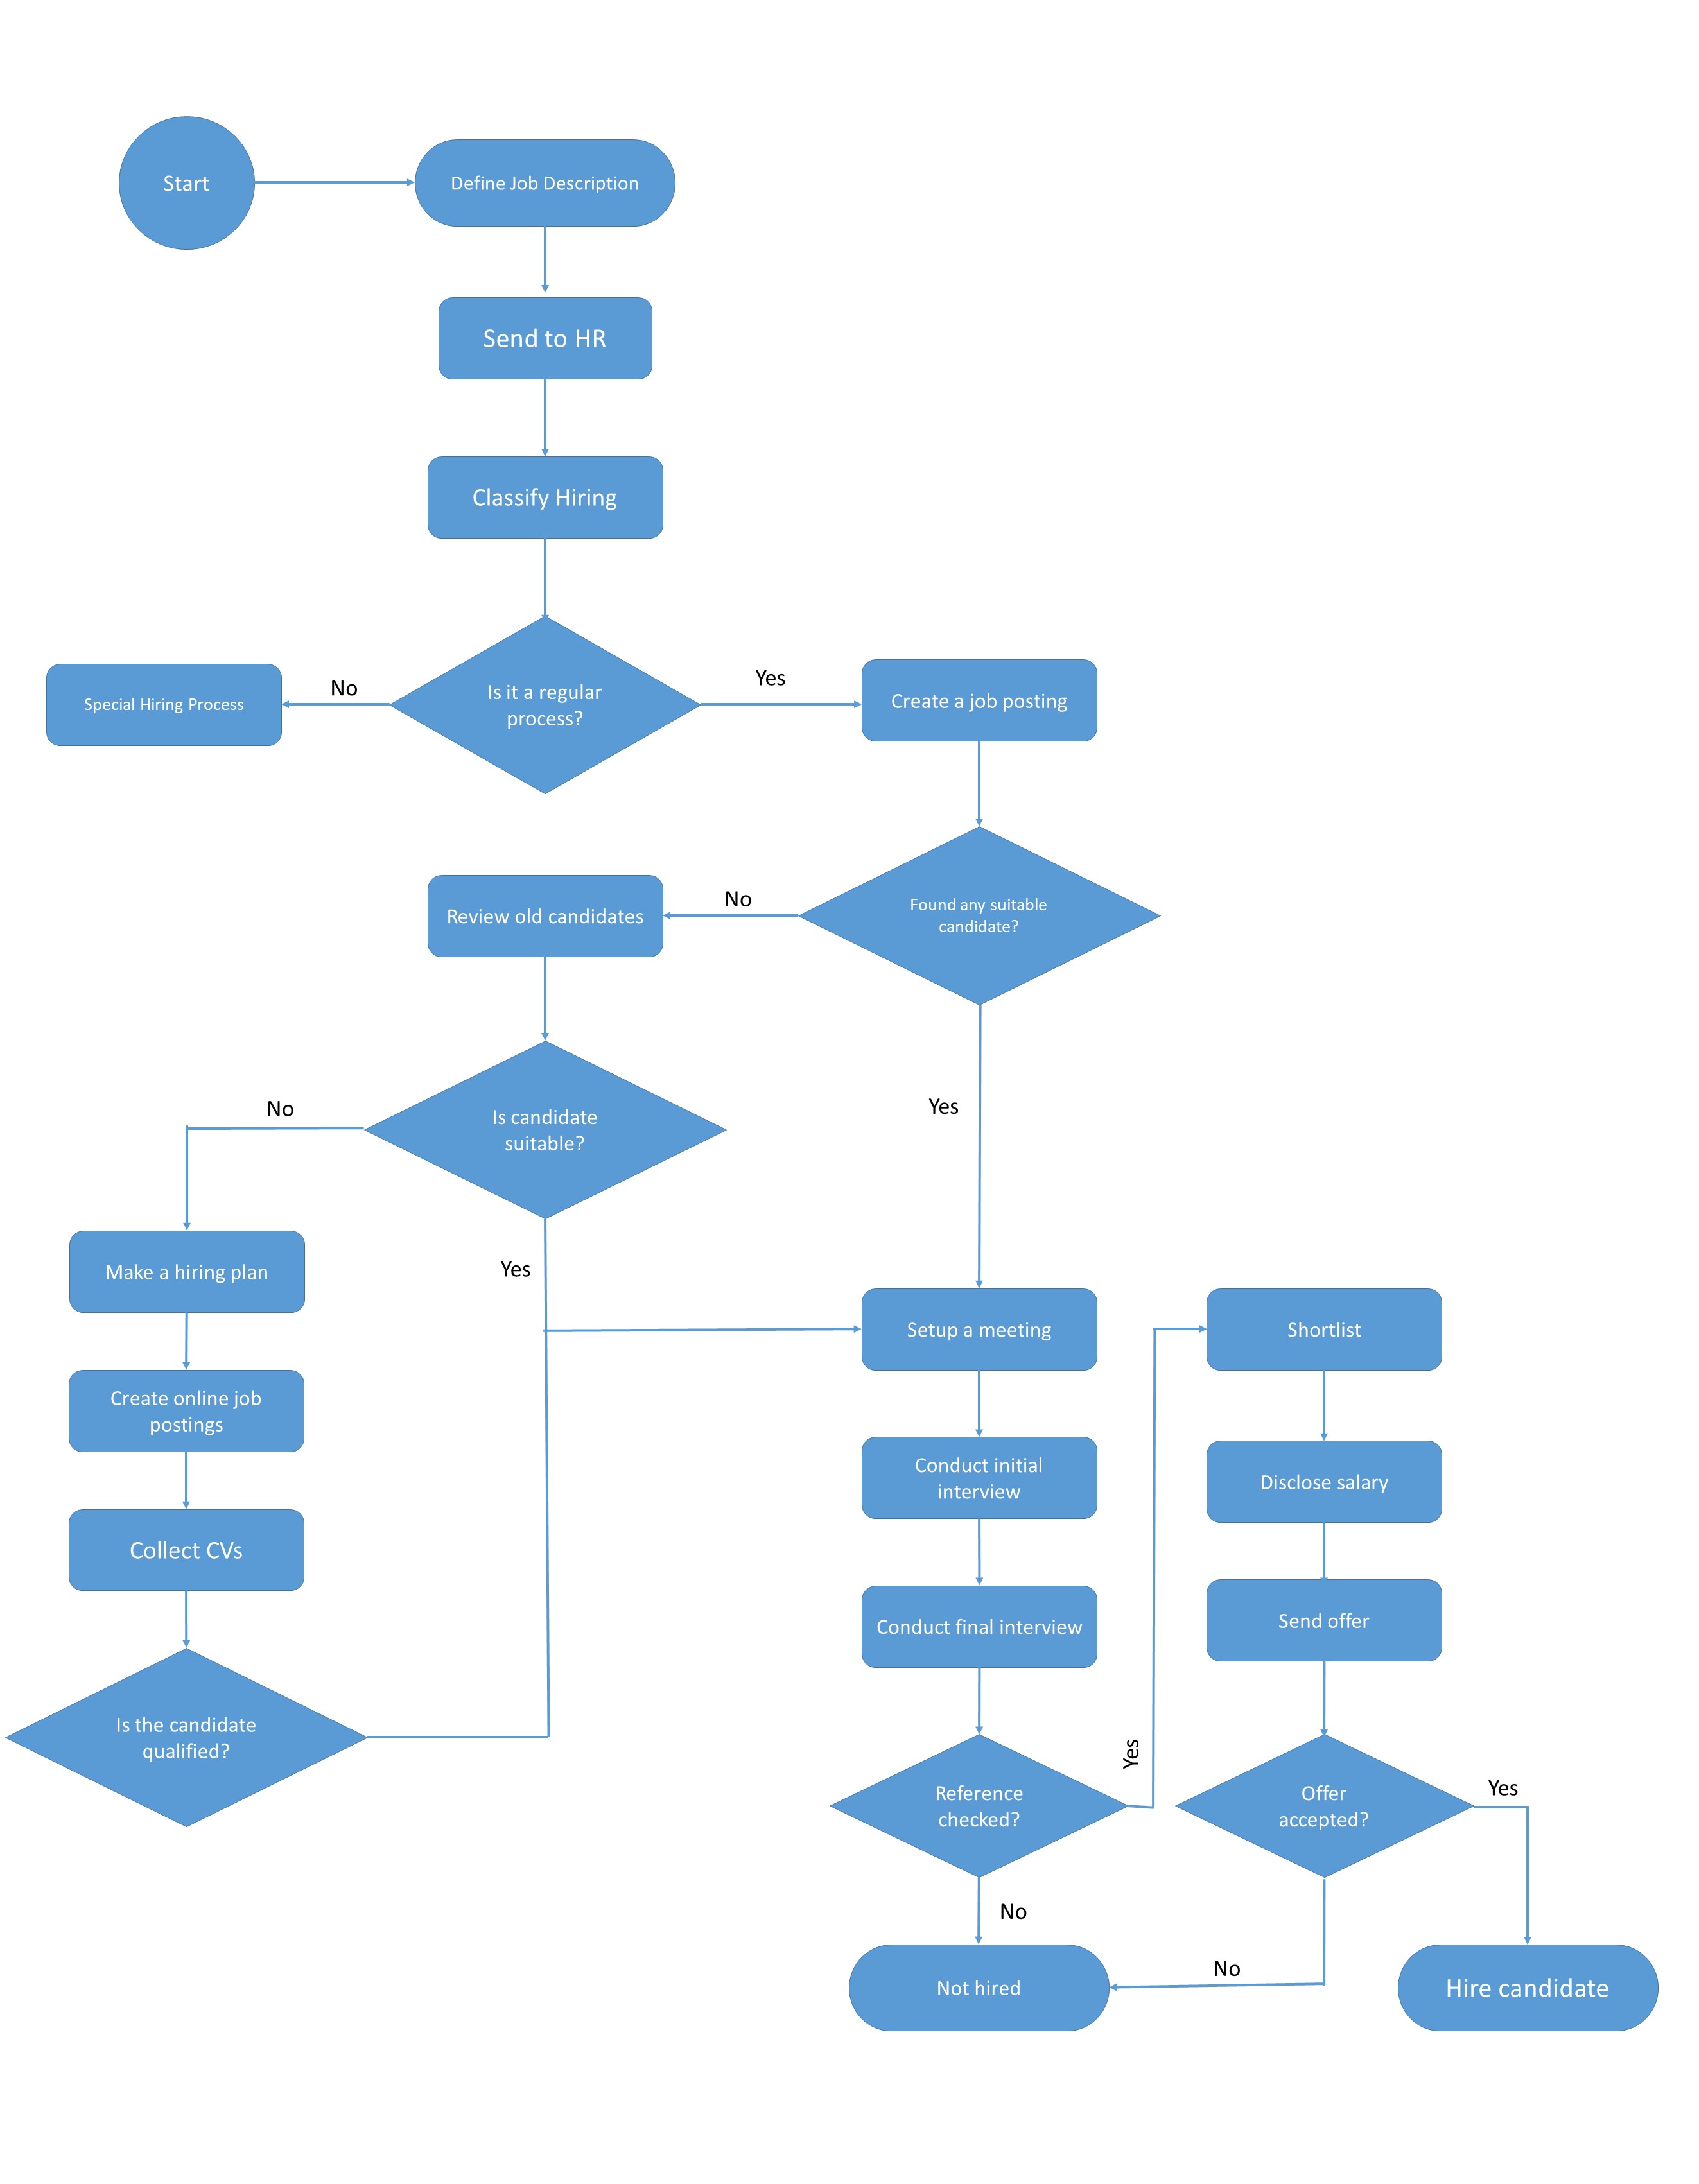
Step 5: Change the shape colors to make the chart more appealing.
Step 6: Now, change the color of all the connections and increase their width to make them more prominent.
Step 7: Make the text easily readable by making it bold and changing the font size and style.
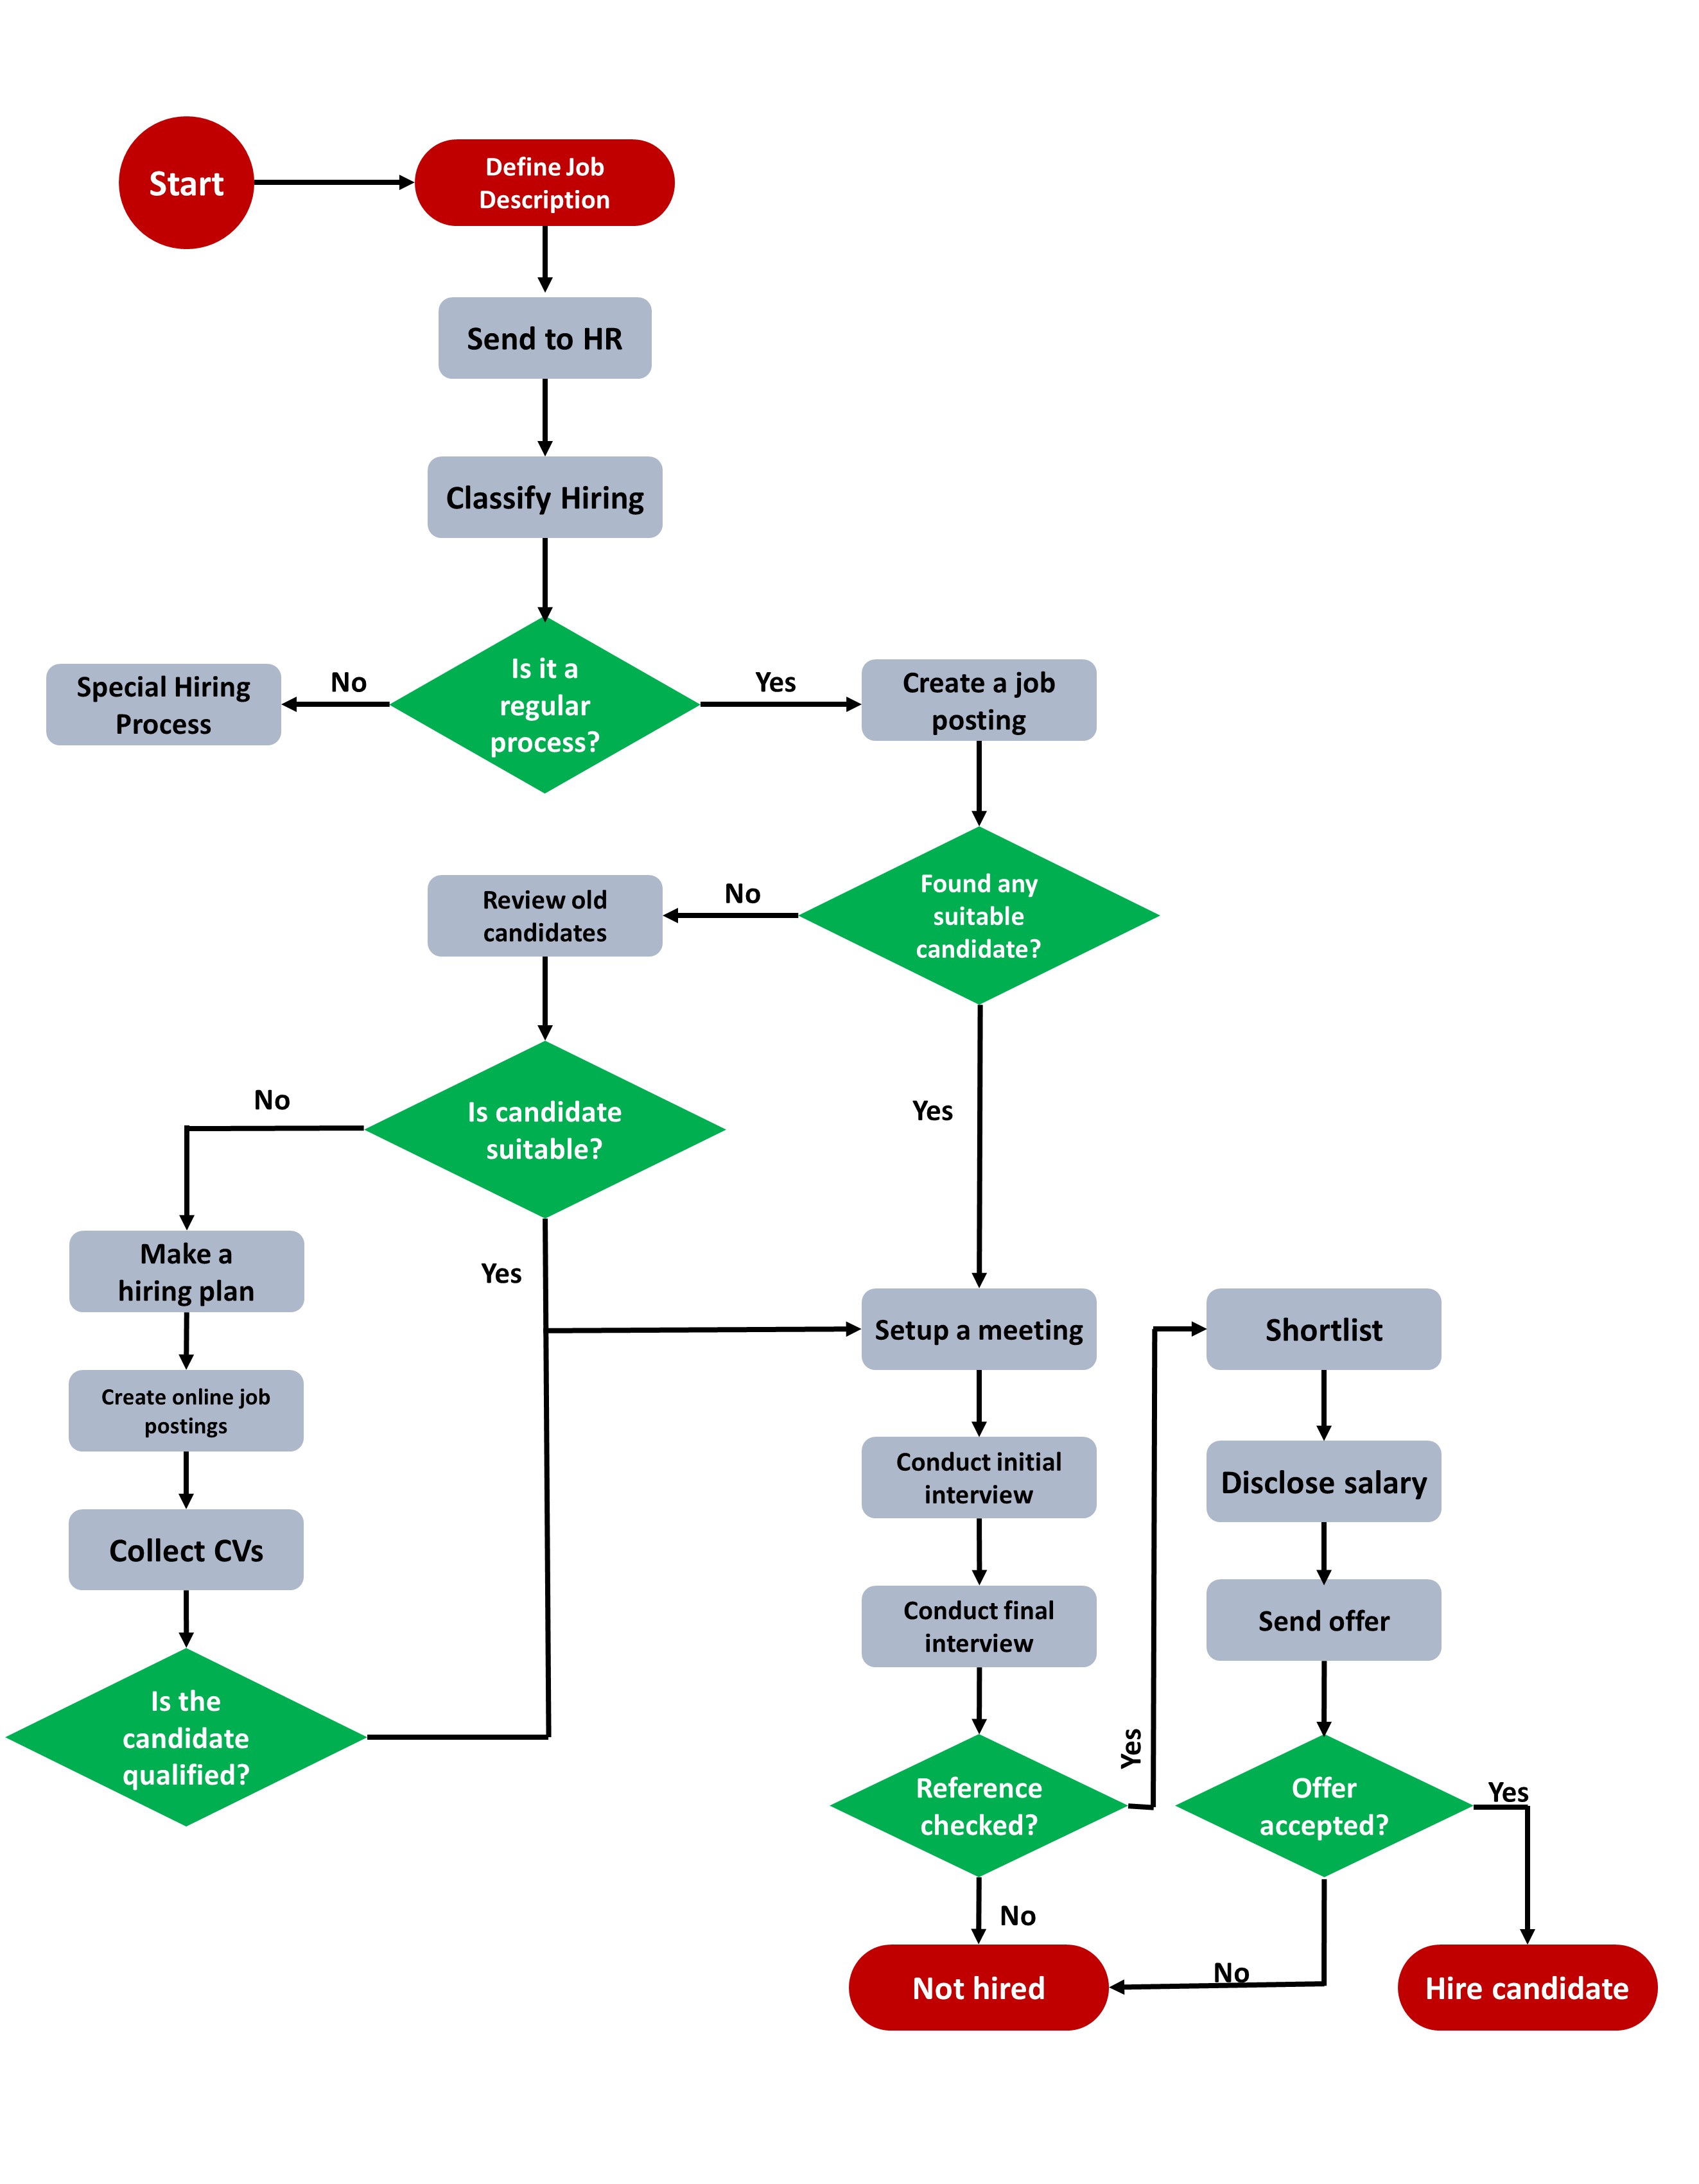
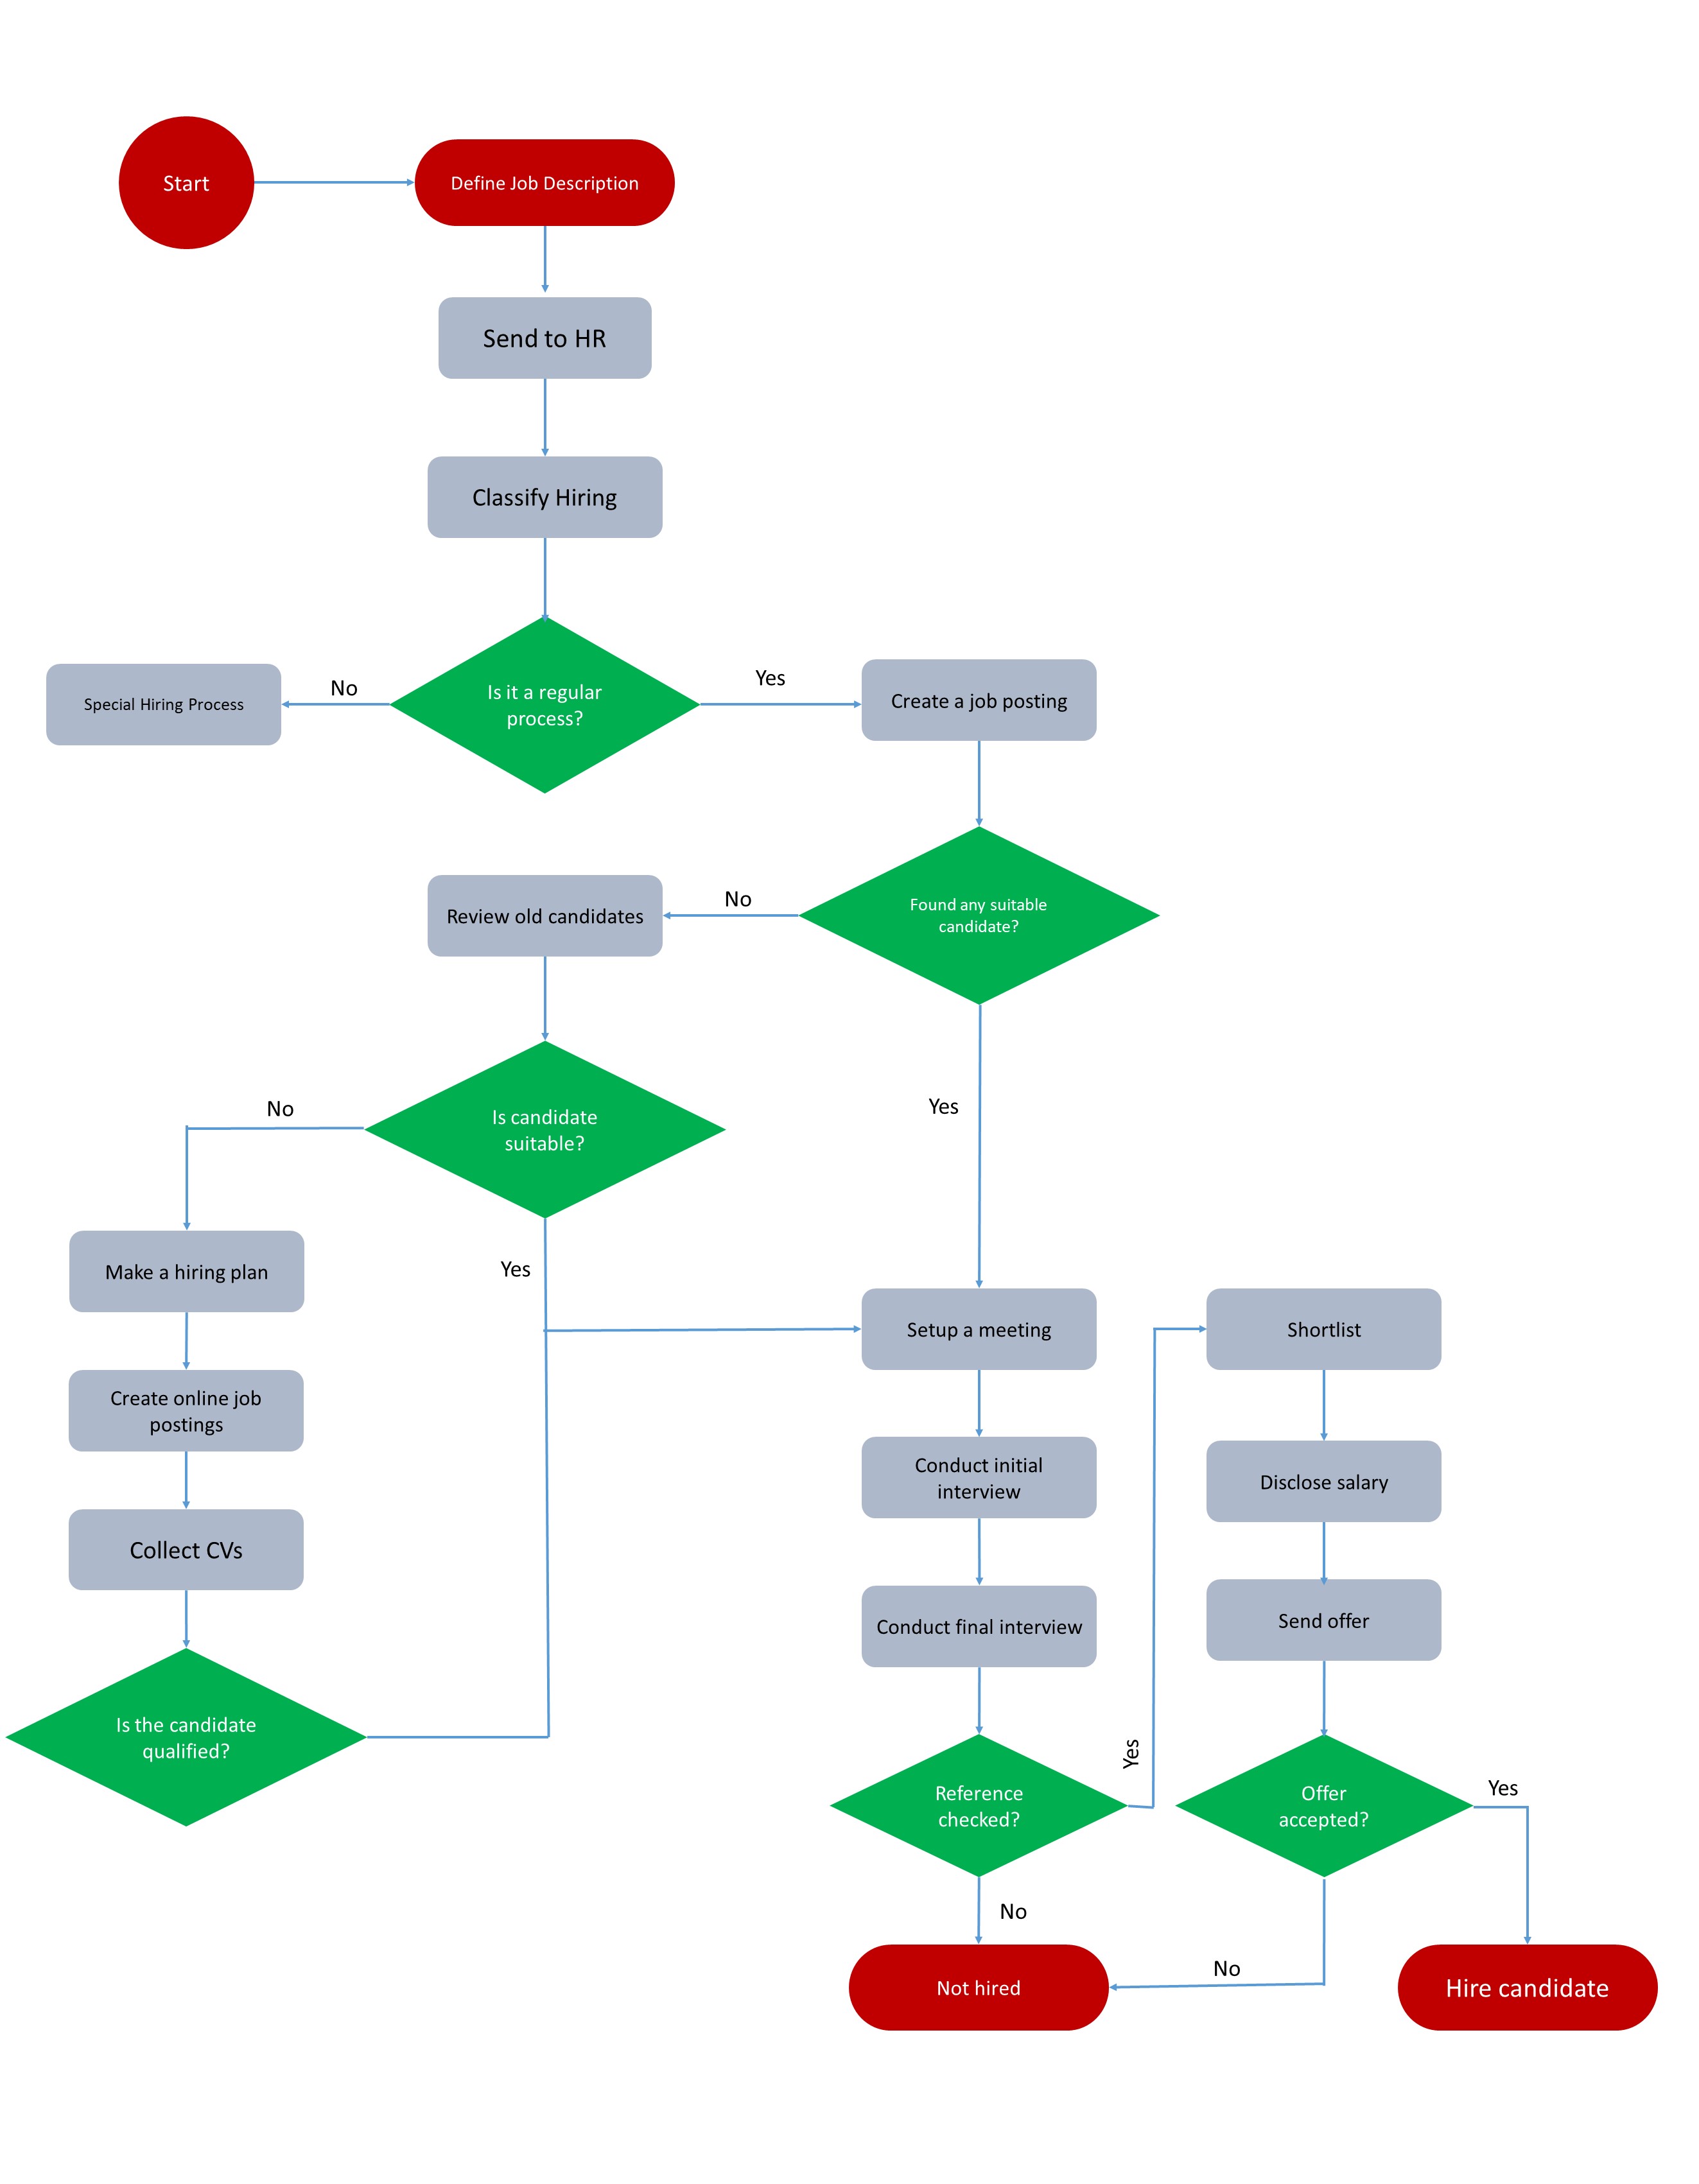
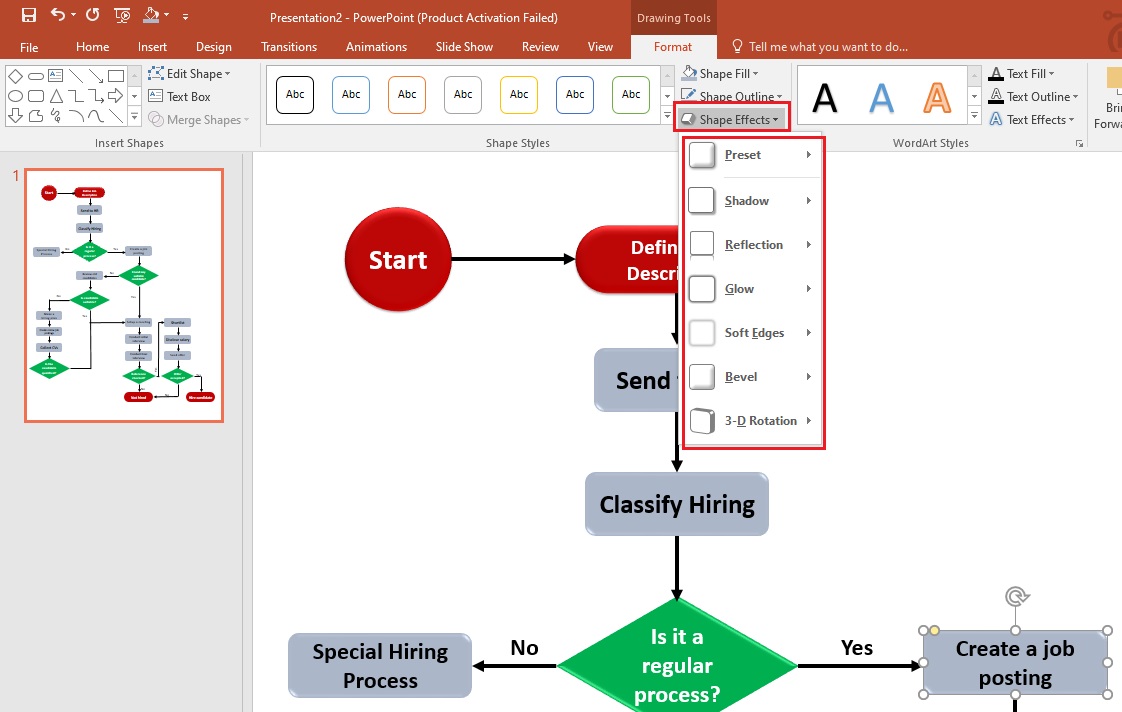
Step 8: You can apply different shape effects to make the flowchart more professional and appealing to viewers.
Step 9: Once you finalize everything, don’t forget to review the chart. It will help you ensure whether or not it needs further editing.
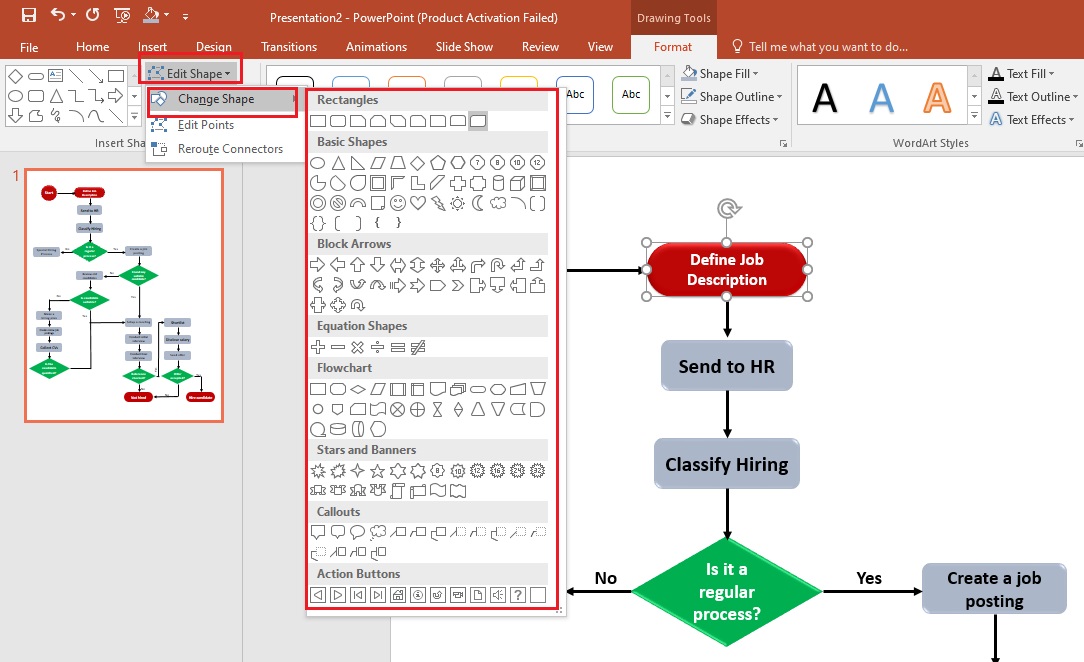
If you find that there is a need to replace one or more shapes, enter the "Format" menu and click "Edit Shape>Change Shape". Then, choose a suitable shape to replace with the previous one. Doing this will not disturb the structure of your chart.
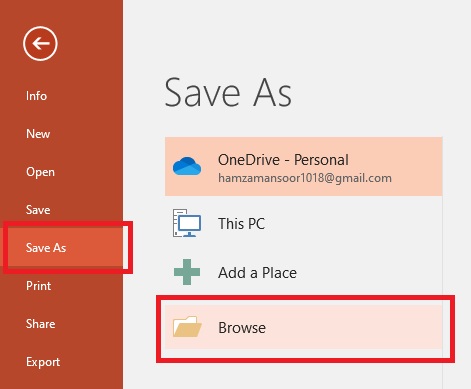
Step 10: You can export your chart in different formats with PowerPoint. To do this, go to the "File" menu, tap on "Save As", and click "Browse".
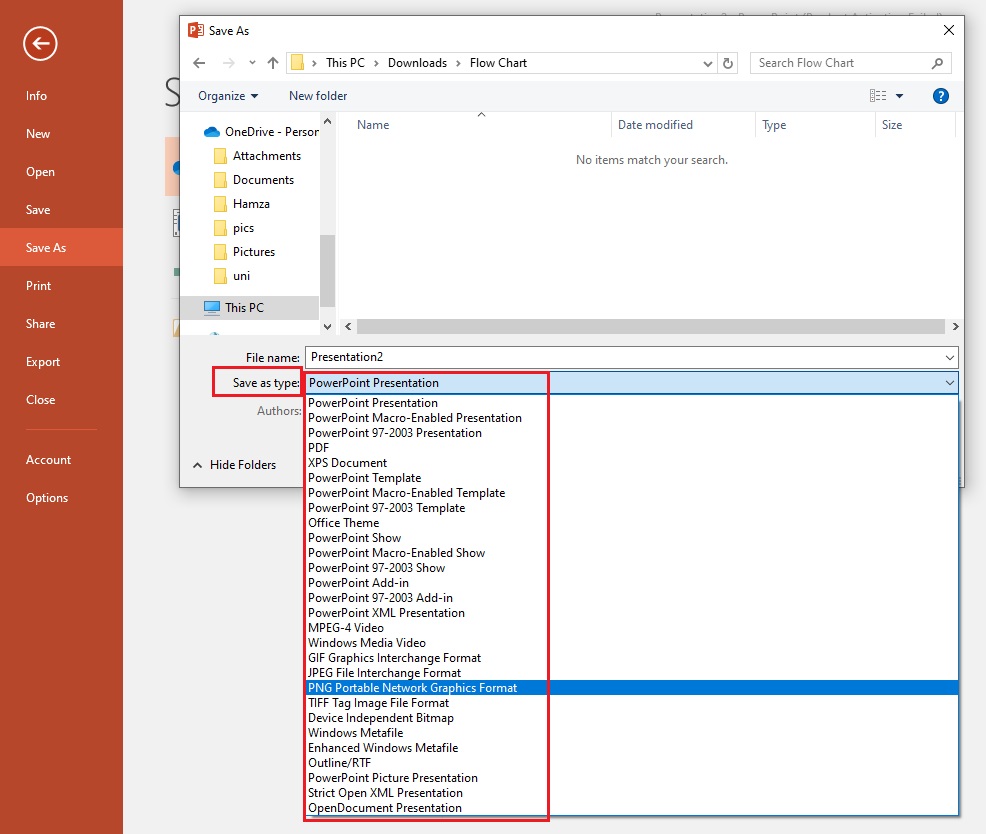
Choose a location on your computer where you want to save this professional flowchart. Then, open the dropdown list, “Save as type:," and choose the desired format to save your chart.
Part 3. Best Practices for Making a More Visually Appealing and Effective Flowchart
Now that you know how to create a flowchart in PowerPoint (both basic and professional). Before you start making this diagram, make sure you are well familiar with the best practices listed below.
- Use Consistent Design Elements: To make an easy-to-follow flow of your chart, keep the design elements consistent. Ensure the shape size and spacing between them is uniform.
- Keep the Chart on One Page: Creating a flowchart on one page has always been a good practice, but make sure the text is readable. If the chart is large and can’t fit on a single page, it is better to make multiple charts and use hyperlinks to connect them.
- Maintain Left-to-Right Data Flow: While reading any information, we first look at the top-left corner of the page. This is why maintaining a left-to-right flow is an ideal way to make your flowchart easy to read for everyone.
- Keep the Return Lines Under the Diagram: We usually read information from top to bottom of the page. Therefore, logically, it is better to place the return lines under the chart. If you want to add two or more return lines, make sure they don’t overlap at any point.
Part 4. Easily Make a Better One with Edraw.AI
Edraw.AI is a free online visual collaboration application. It comes with a wide range of built-in templates and a large number of AI-powered tools, including AI design, AI brainstorming, and more. With Edraw.AI, you can make a better version of a flowchart using the power of artificial intelligence.
Method 1: Generate a Flowchart in Edraw.AI
It is an efficient way to generate a flowchart and make necessary edits once it is ready. The steps included in this method are as follows.
Step 1: Sign in with your social media credentials or Wondershare ID.
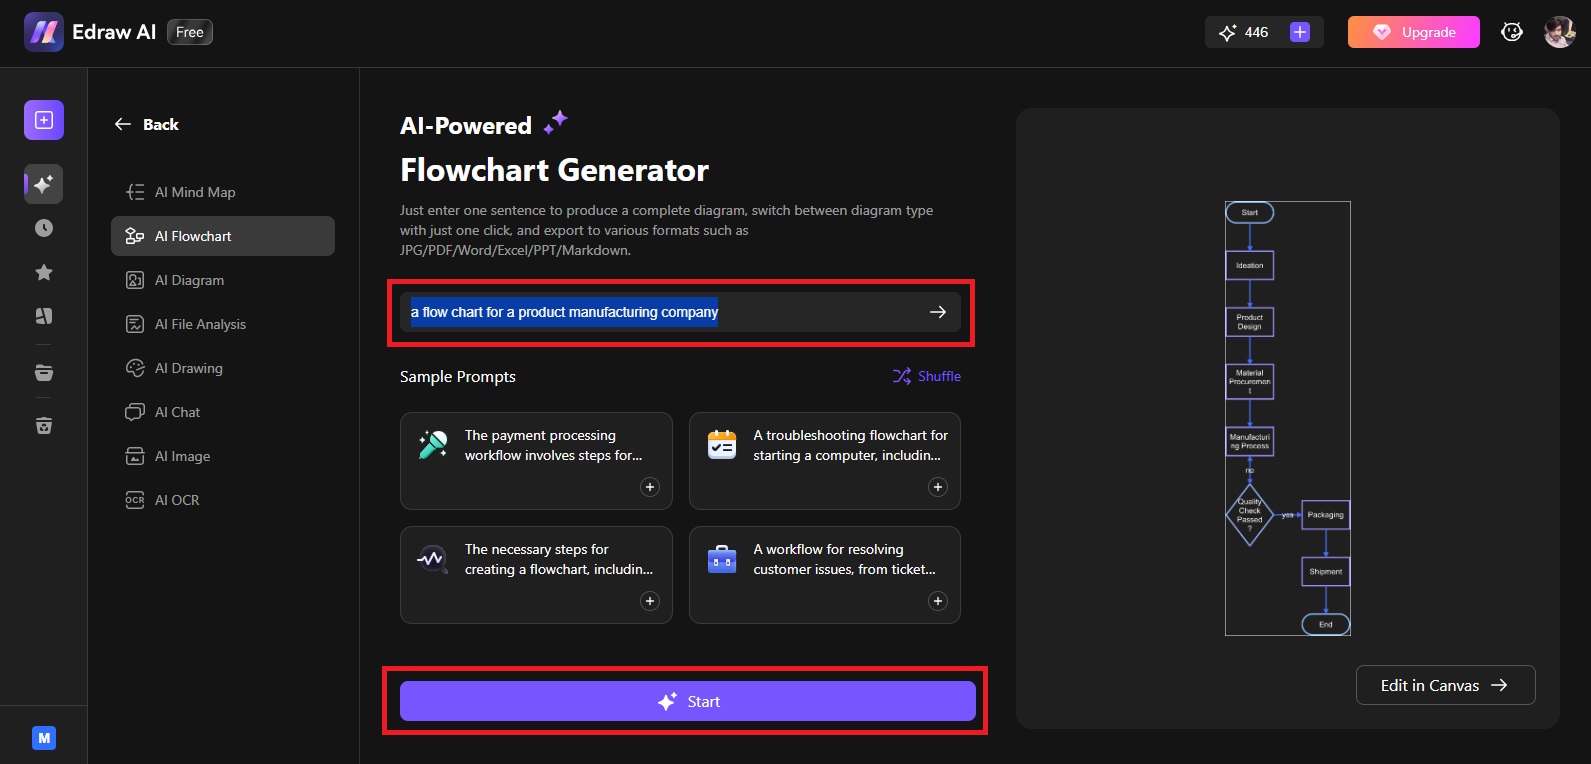
Step 2: Click on "AI Flowchart", as shown below.

Step 3: Enter your prompt in the prompt section, as shown below. For example, we have entered the prompt, “a flow chart for a product manufacturing company”. Then, tap on the "Start" button. Edraw.AI will create a flowchart using the given prompt.
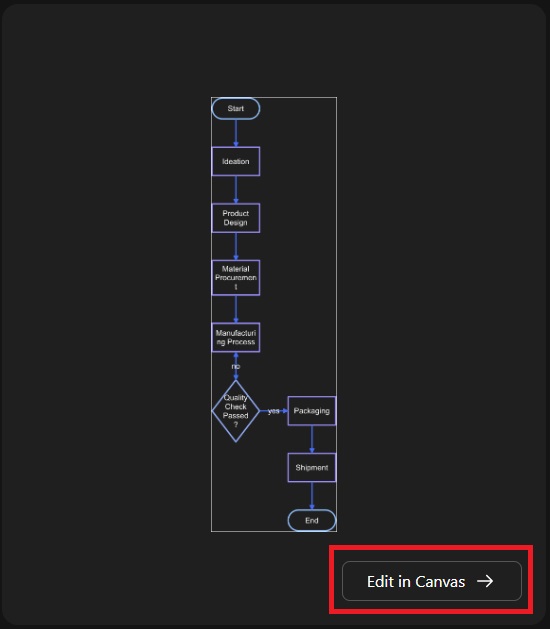
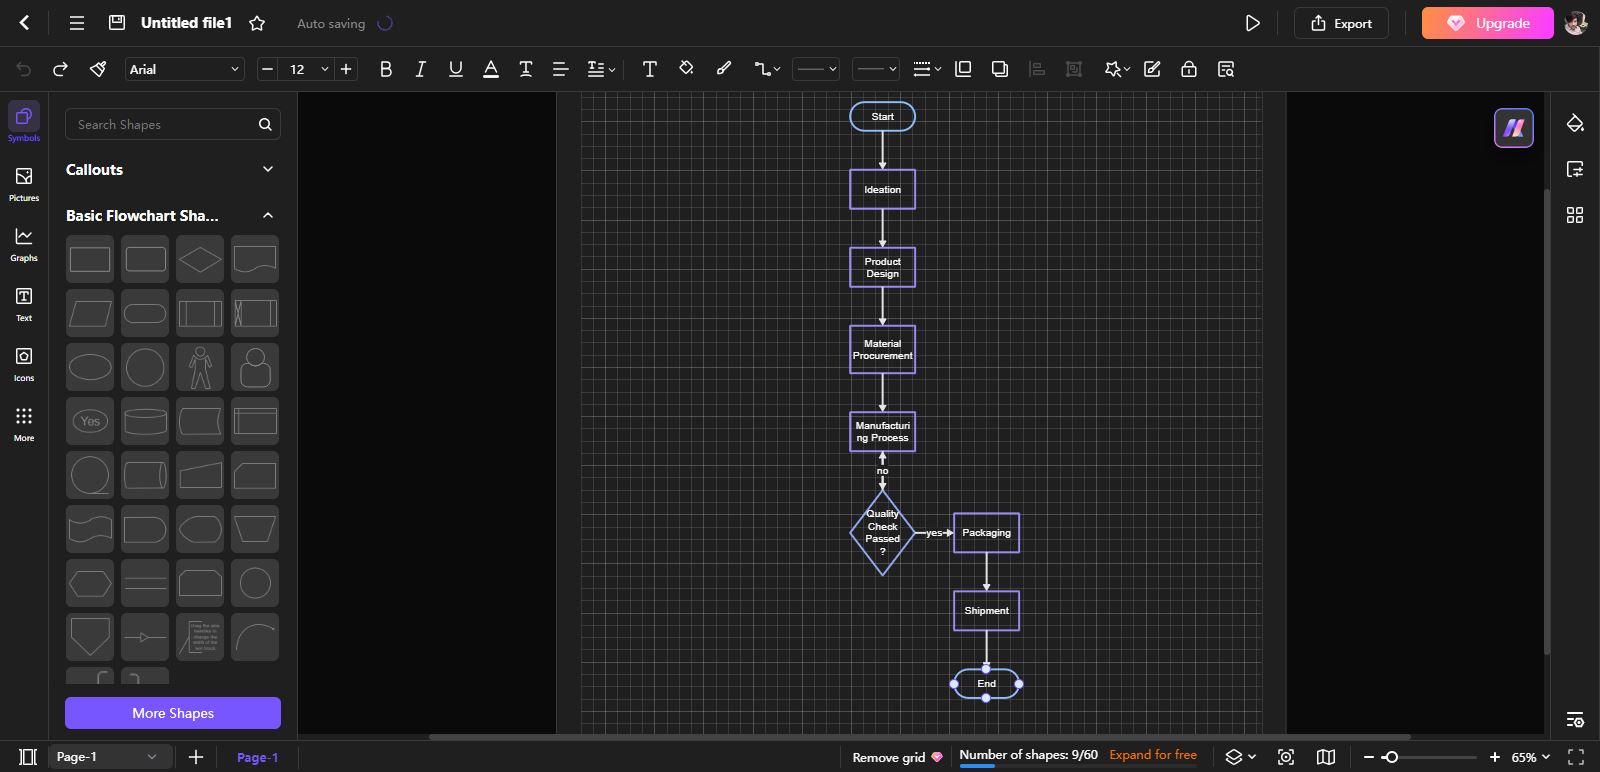
Step 4: The flowchart will appear on the right side of the screen. Click on the "Edit in Canvas" button to make the desired changes to your chart.
Step 5: You can now edit the chart from this canvas.
Method 2: Create a Flowchart with a Template
Here is how you can use a pre-built template to make a flowchart in Edraw.AI.
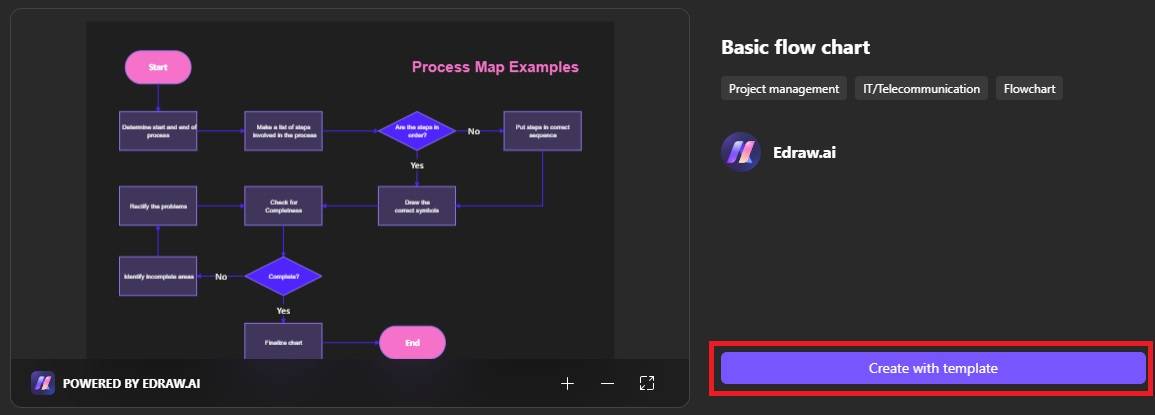
Step 1: Go to the template section of Edraw.AI and choose the desired template.

Step 2: Click on the "Create with template" button.
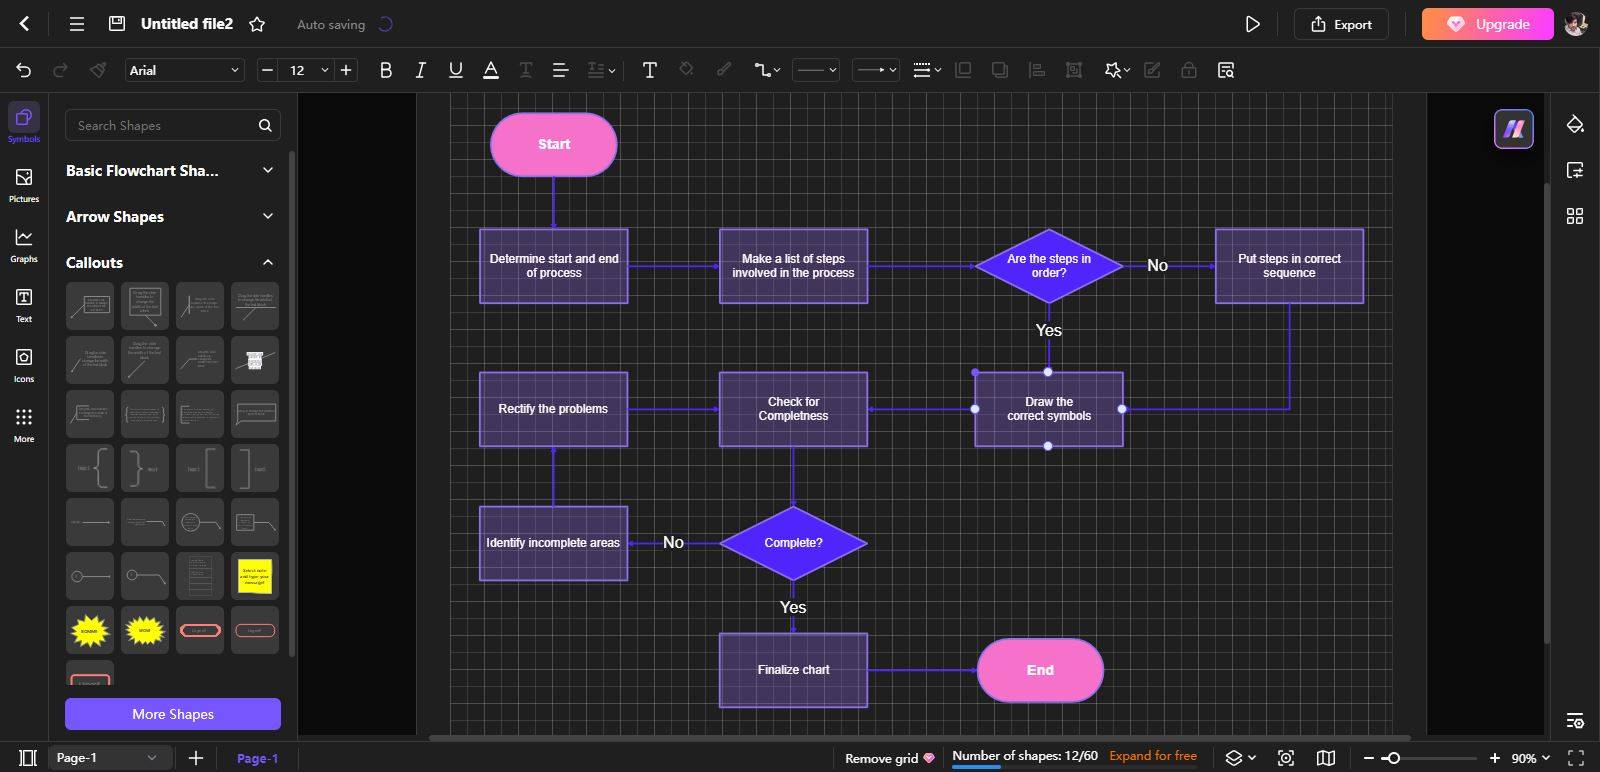
Step 3: The template chosen in the previous step will appear on the editable canvas like in the image shown below. Here, you can make the changes according to your needs to convert this template into a fully functional chart that best matches your requirements.
Export the Flowchart to PowerPoint
Exporting the chart in PowerPoint with Edraw.AI is super simple.
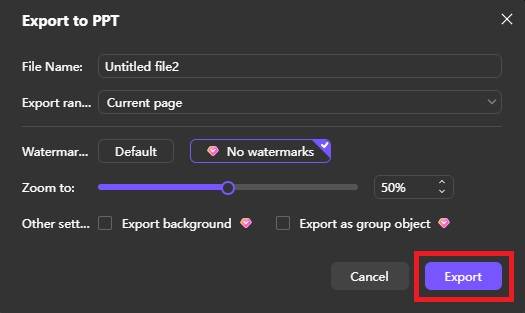
Step 1: Click the "Export" button from the top-right corner and tap on "PowerPoint (.pptx)".
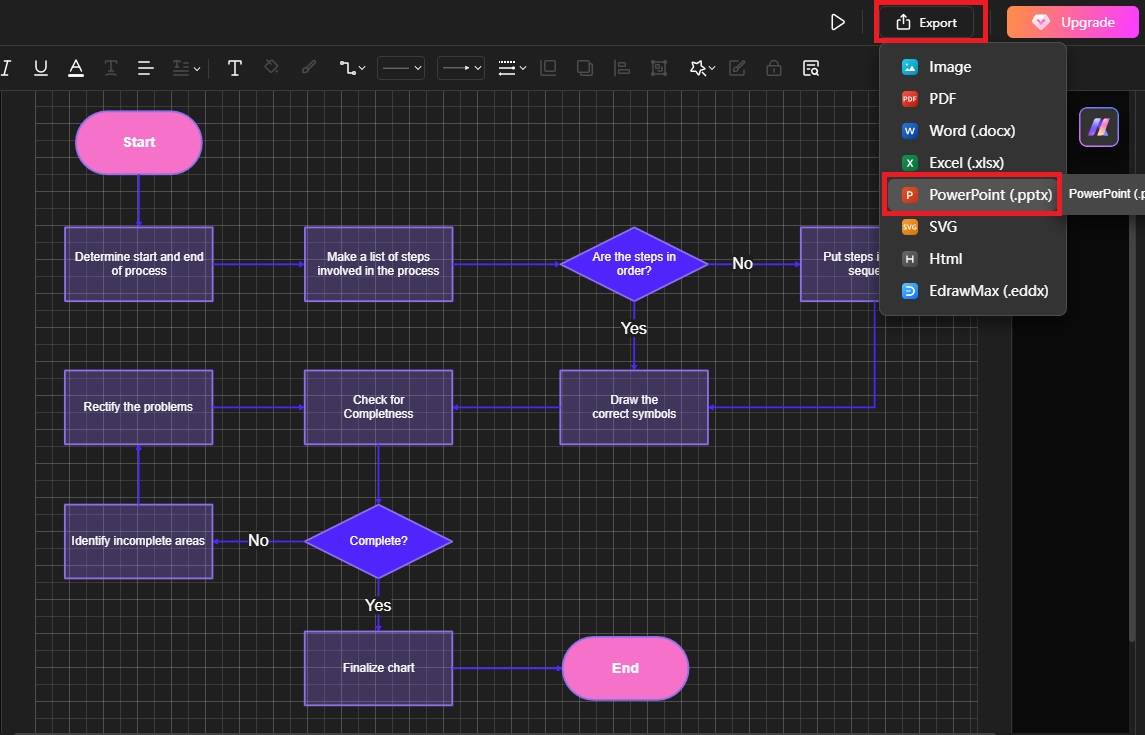
Step 2: Change the File Name and Export Range. Then, click "Export".
You can also export the flowchart in PNG format and import it into MS PowerPoint.
Summing up the entire discussion, creating a flowchart in PowerPoint is very simple and easy. It not only allows you to create an appealing flowchart for free but also saves you a lot of time. Easy navigation and support for multimedia make this tool stand out. If you are looking for a more advanced and more efficient way of making flowcharts with AI technology, try Edraw.AI.