
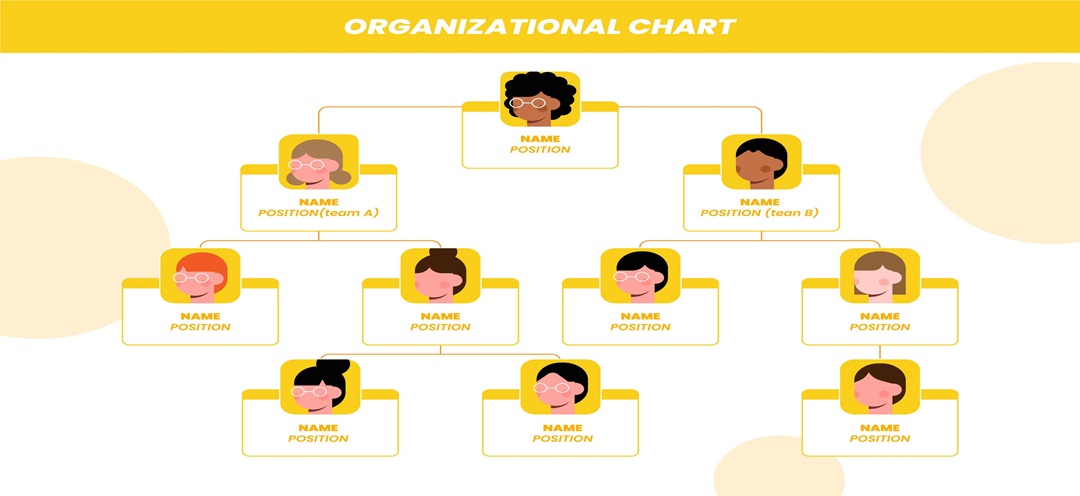
If you’re in HR or a similar role, you know how essential an org chart can be. It visually shows who reports to whom, keeping everyone in the loop on company structure and team relationships.
But how can you make an org chart with less time and effort since you are so busy? Google Docs makes making and sharing an organizational chart easy without design skills.
Here’s a quick guide to creating an org chart in Google Docs. Or jump to Part 2 if you need a better organizational chart maker.
In this article
How To Make an Org Chart in Google Docs
Using any of these methods, you can make an org chart in Google Docs that’s tailored to your needs. Choose the approach that best fits your team’s structure and style.
Method 1: Use the Drawing Tool To Create Org Charts in Google Docs
Org charts in Google Docs are easy to make and design if only a few levels are needed. If you need something simple, create an org chart in Google Docs with these steps:
Step 1
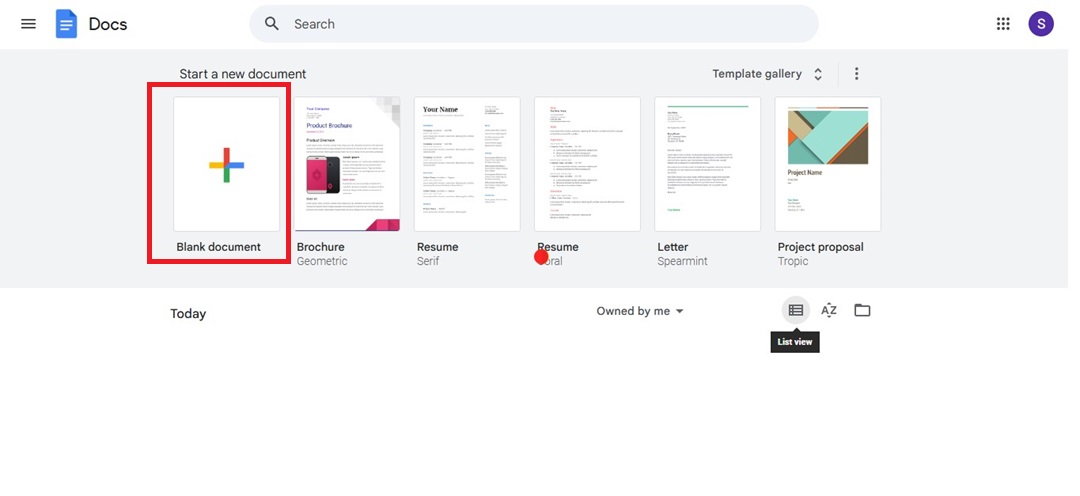
Open a new Google Doc from a web browser. Next, select Blank document from the top left side to start.
Step 2
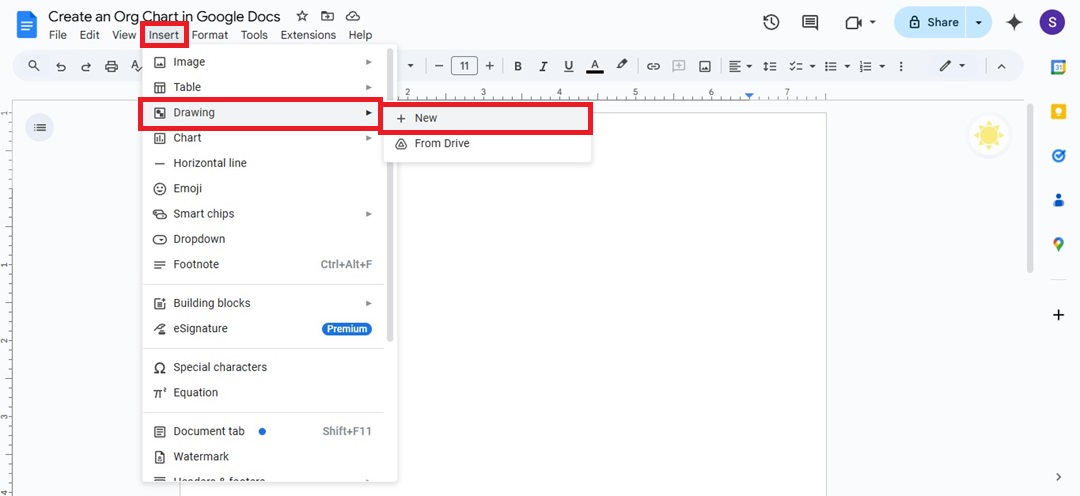
From the top menu, go to Insert > Drawing > + New. It’ll open the Drawing pop-up window where you will make an org chart.
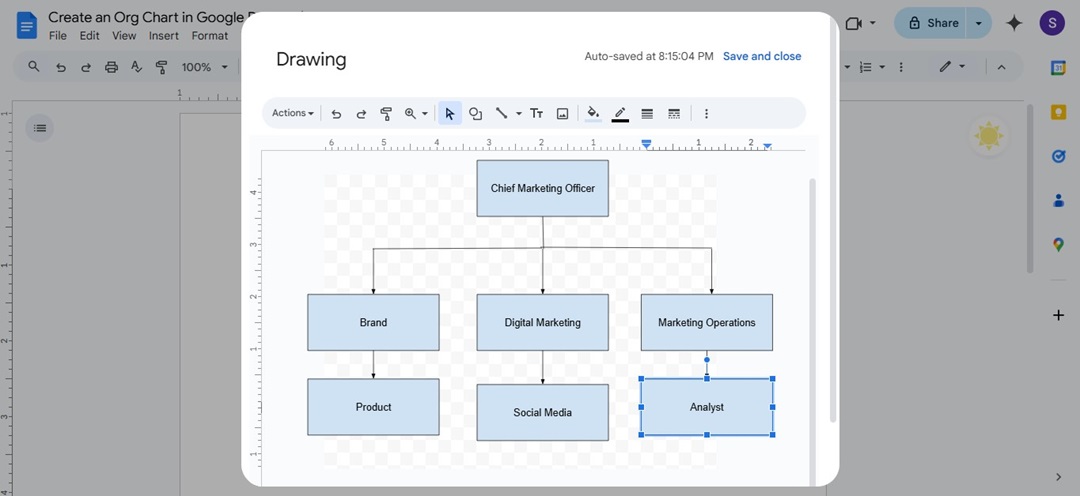
Step 3 Create an Org Chart in Google Docs
Click the Shape icon, then select Shapes. Pick the shape you want for each position in the org chart. Use the cursor to draw the shape in the space manually.
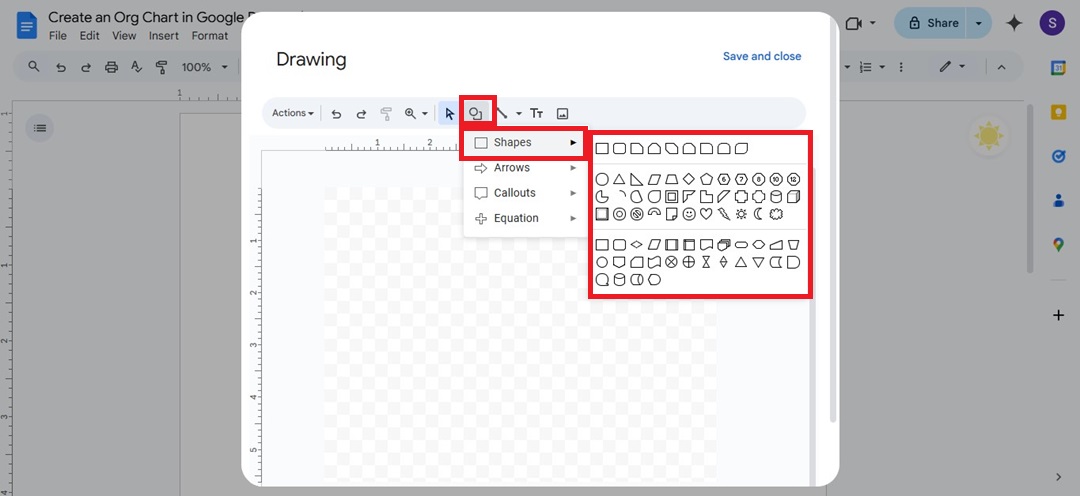
Select Arrow under the Line dropdown list to connect shapes to indicate relationships in the organizational chart.
Click inside the shapes to add text and label positions or departments.
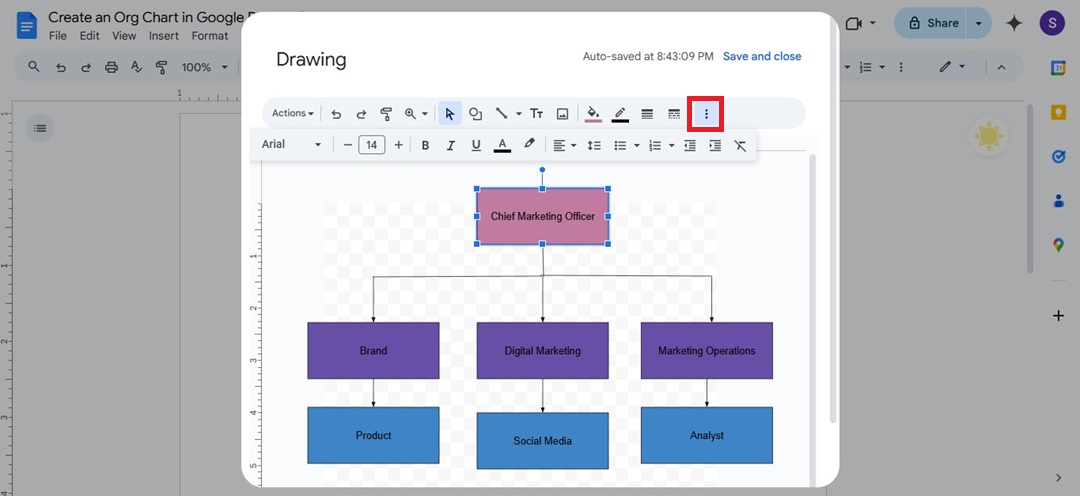
Step 4 Customize the Org Chart
Adjust the text, font, or color of the org chart to make it visually appealing. Select the text or shape in the org chart, then click the More icon on the right side.
Step 5
When done, click Save and close to insert the org chart into your Google Docs.
Method 2: Use Google Sheets To Make Org Charts in Google Docs
Google Sheets offers more control for creating structured org charts and linking them into Google Docs. This method is faster and more effective if you have a clear hierarchy. Here’s how:
Step 1
Open Google Sheets, then add your data with two columns: one for each person’s name and the second for their supervisor or manager.

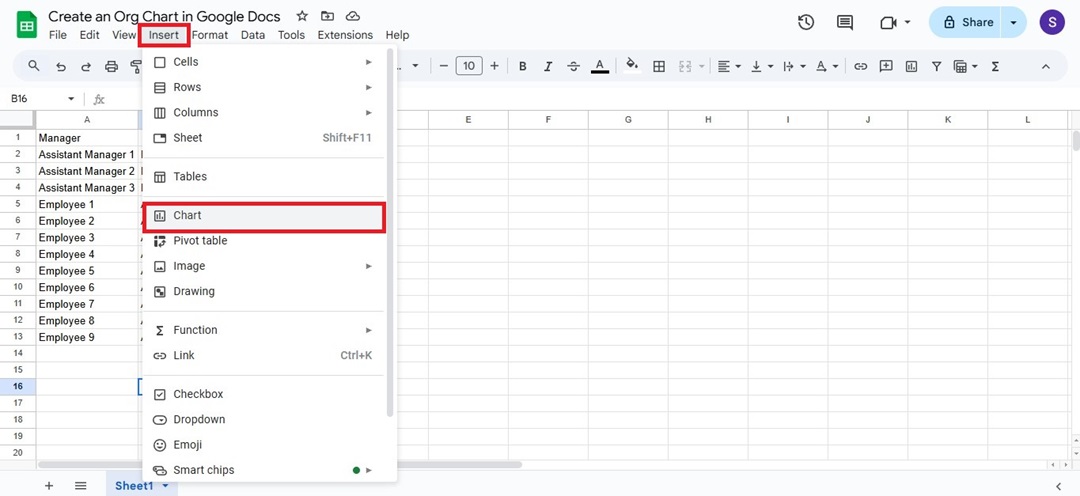
Step 2
Select all the cells in the sheet with data to make an org chart. Then, go to Insert > Chart from the upper navigation pane.
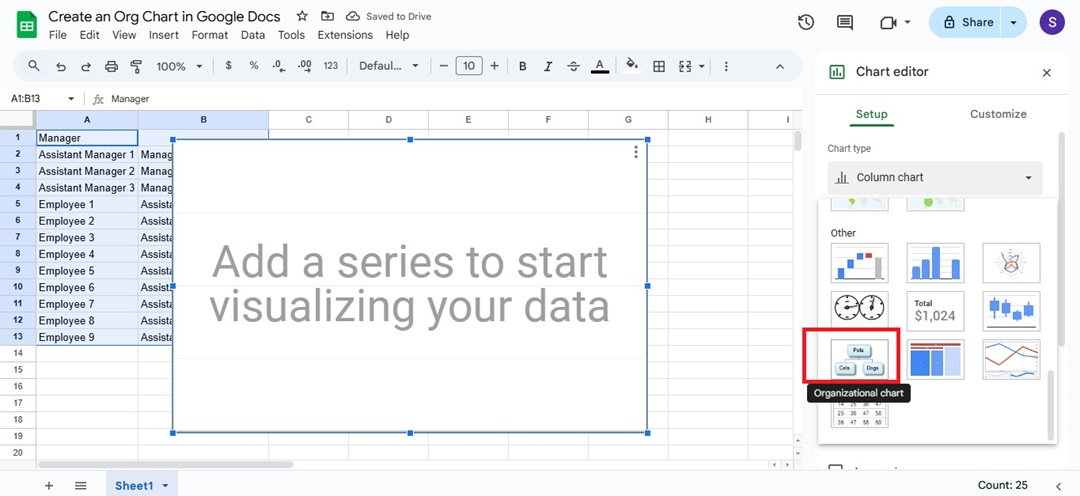
Step 3
On the Chart editor panel at the right, find the Chart type dropdown list. Scroll down and select Organizational chart from the Other section.
Step 4
Google Sheets will automatically generate an org chart based on the highlighted data. Copy the organizational chart.
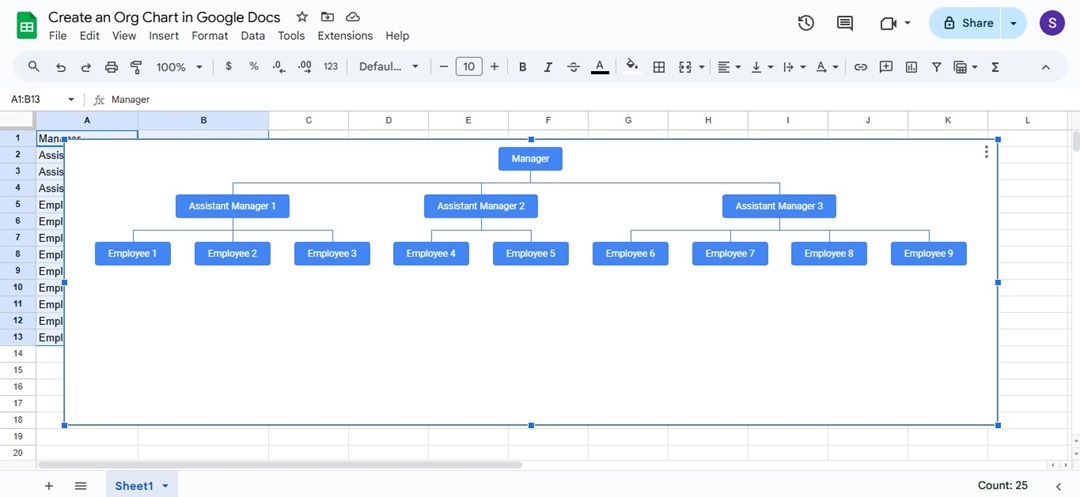
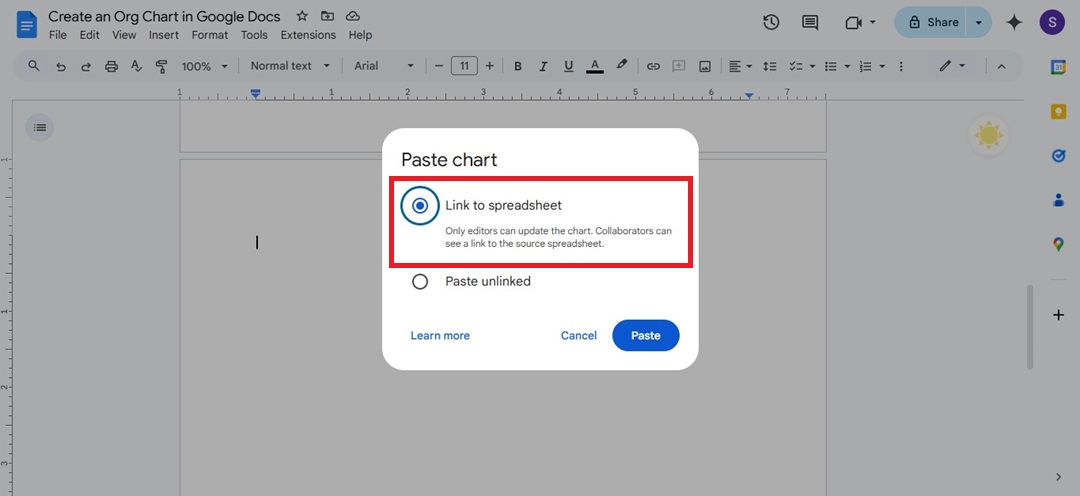
Step 5
In Google Docs, paste the org chart and choose Link to spreadsheet to keep it updated.
With Google Docs, you can create a simple org chart. However, adjusting it later can be time-consuming. Limited design options may make it hard to match your preferred look.
And without unlimited space, rearranging shapes and lines can be tricky. If your org chart is larger and more complex, Google Docs may not be the most efficient choice. You may want to explore another dedicated tool for creating an organizational chart — Edraw.AI.
How To Make an Org Chart in Edraw.AI
Edraw.AI is a user-friendly online visual collaboration tool packed with 40+ AI tools. Its unlimited canvas gives you plenty of space, and pre-designed templates make setup easy.
With Edraw.AI, moving shapes are hassle-free, thanks to an auto-snap feature that keeps everything aligned and connected effortlessly.
Method 1: How To Make an Org Chart From Scratch
Use the drag-and-drop feature to build an org chart from scratch by manually adding boxes and connecting them.
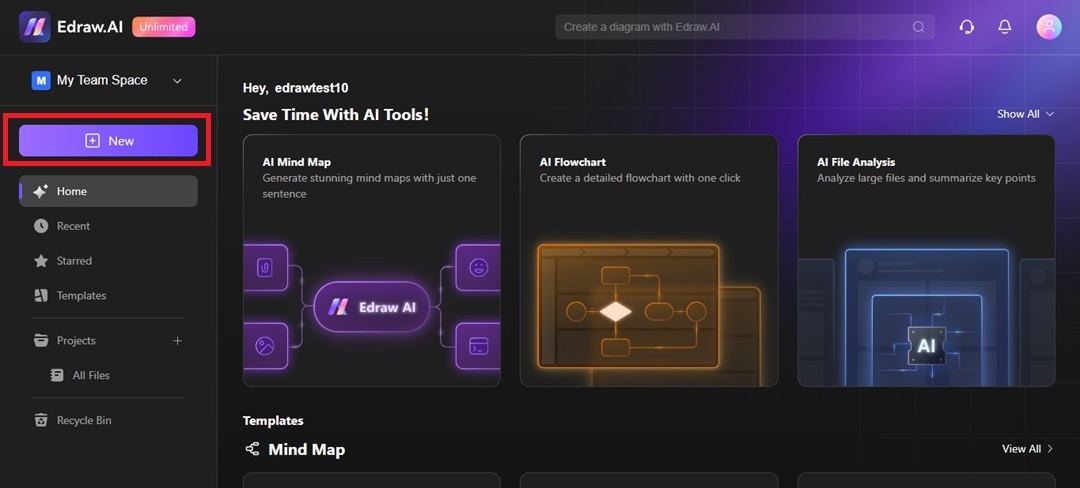
Step 1
Click New in the main dashboard to open a blank document in Edraw.AI.
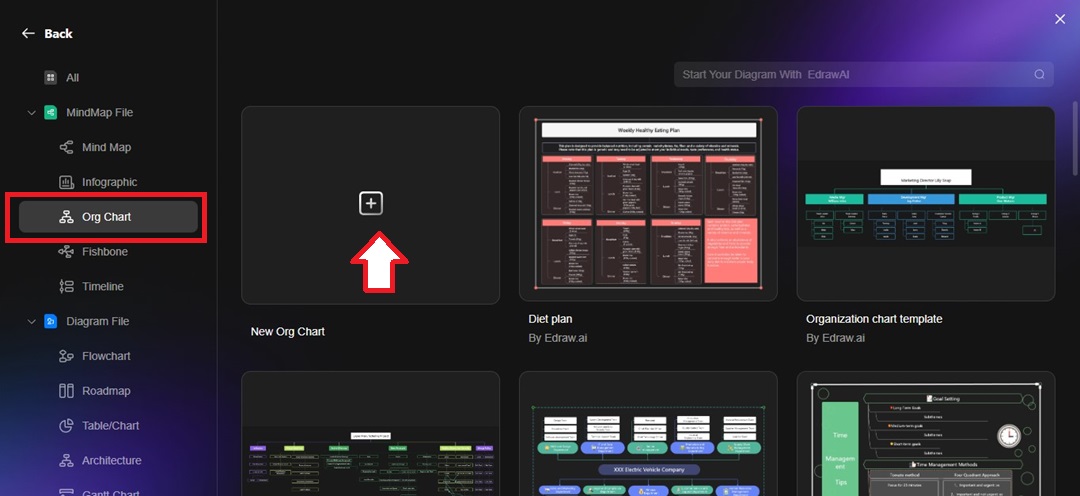
Step 2
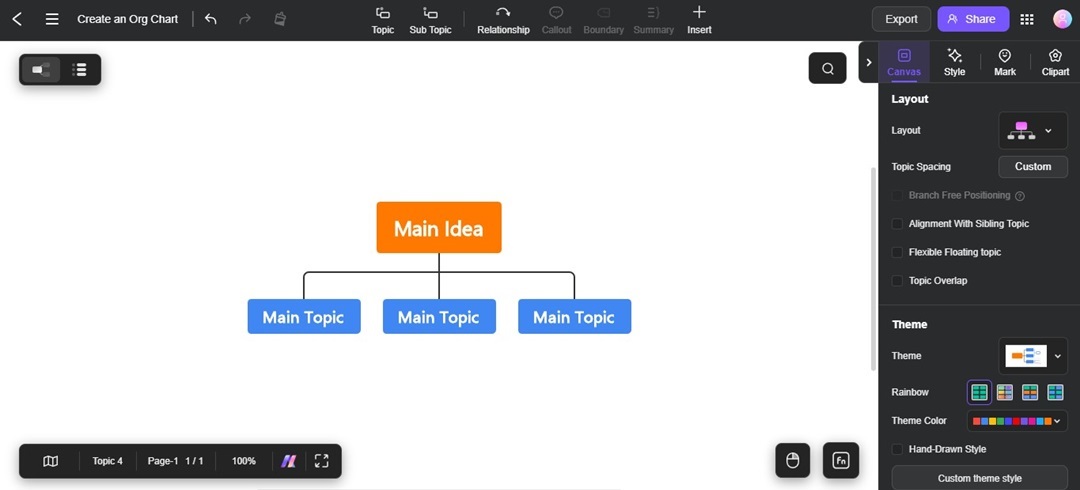
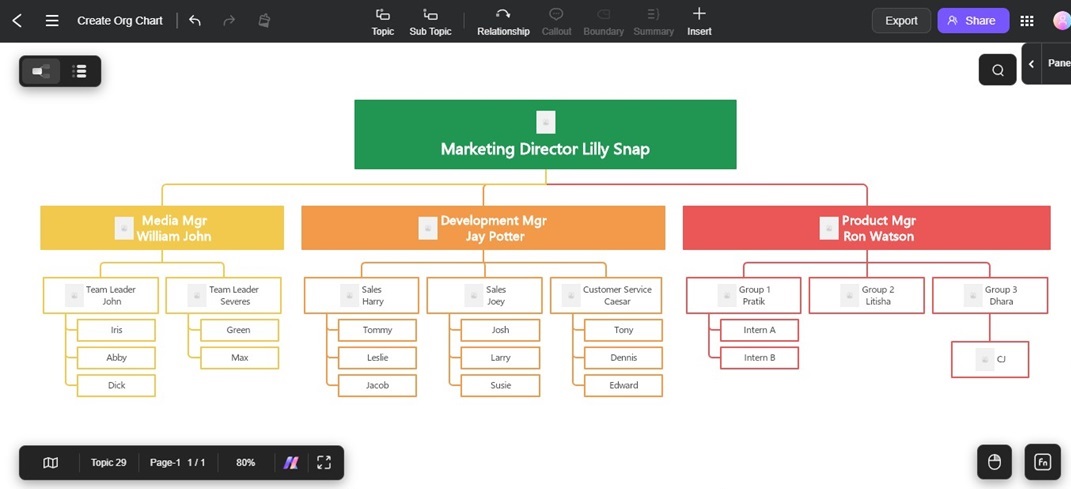
Go to Org Chart from the MindMap File list on the left side. Select New Org Chart to start and open a new tab.
Step 3
Click each shape to enter names and titles, adding specifics for each position.
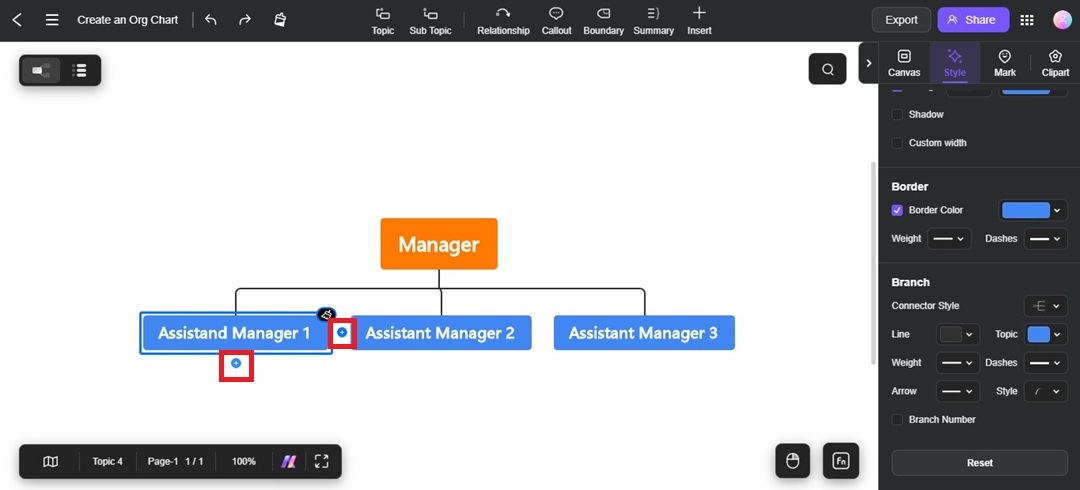
Step 4 Add More Shapes to the Canvas
Click the + icon on the side of the shapes to add more levels to the organization chart.
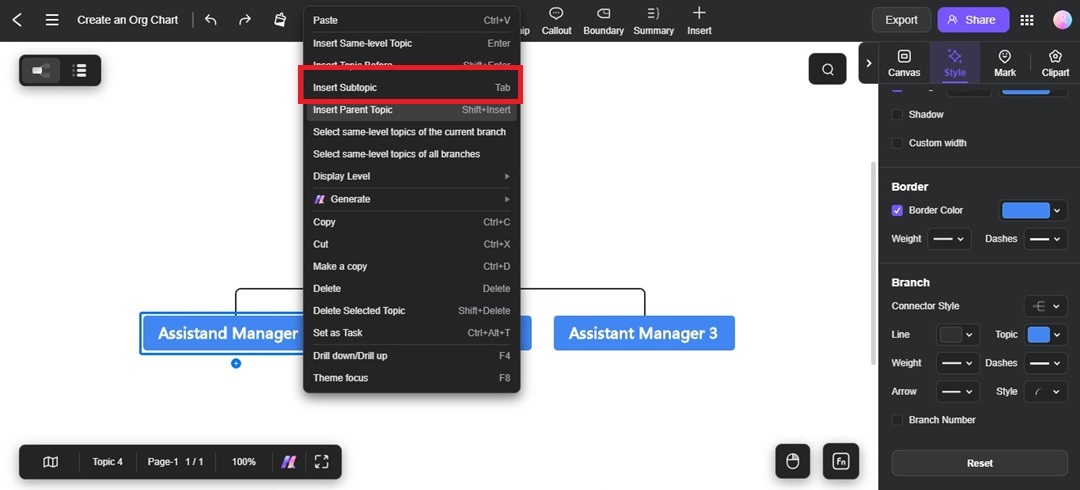
Alternatively, right-click a shape and select Insert Subtopic to place a new shape below it.
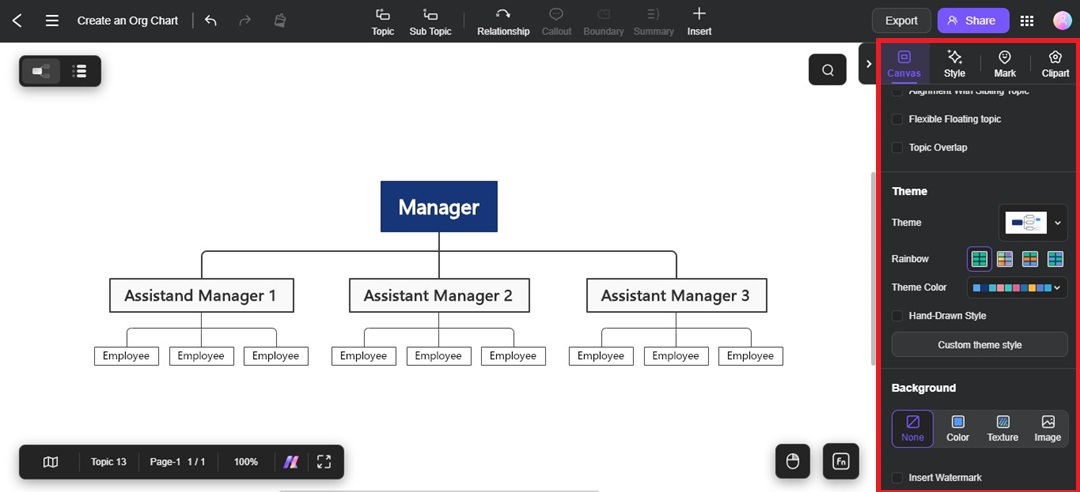
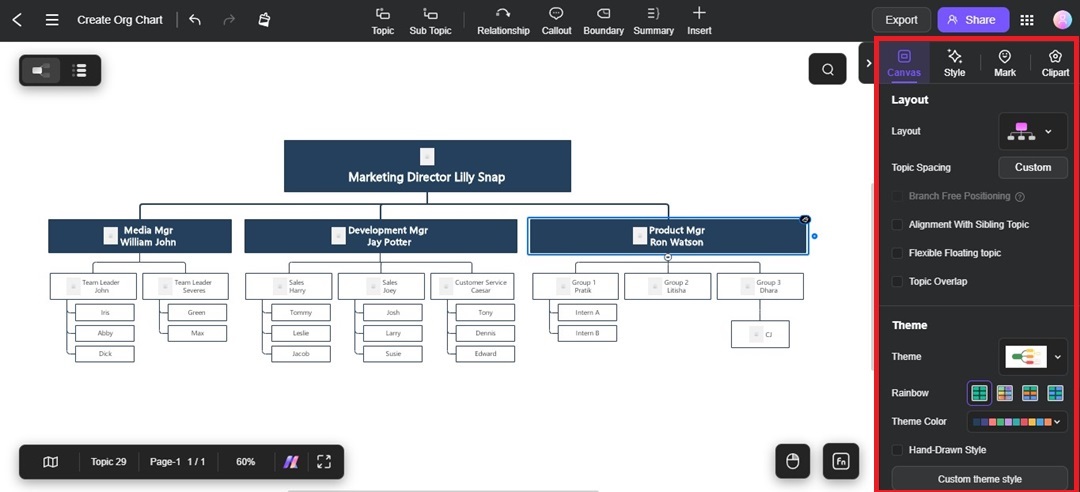
Step 5 Customize the Org Chart Based on Your Branding or Company Style
Select the org chart or an element in the canvas. Then, format it from the Style tab on the right panel to adjust colors, fonts, and arrow style.
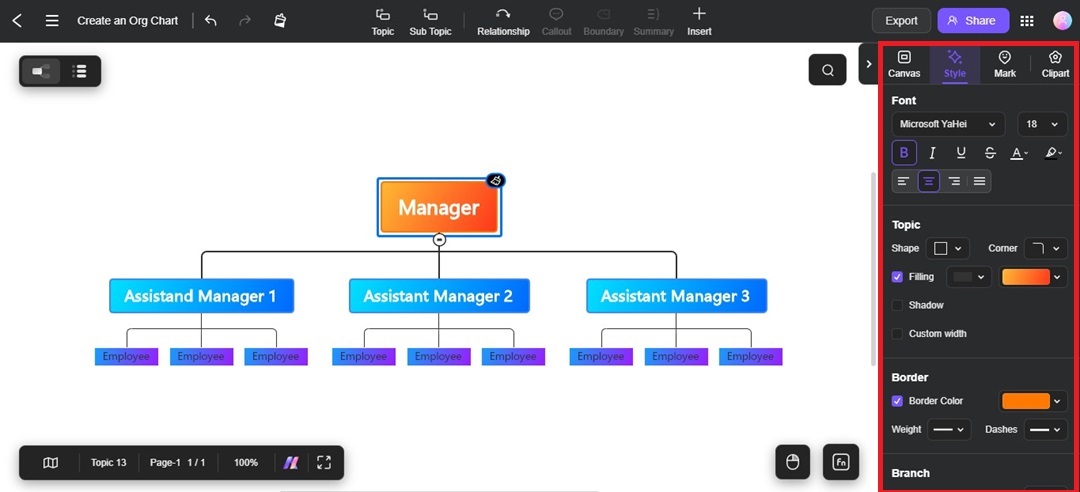
You can also go to the Canvas tab and change the Theme of the org chart.
Method 2: How to Use an Org Chart Template
Edraw.AI provides built-in org chart templates that make it easy to start your design with preset layouts.
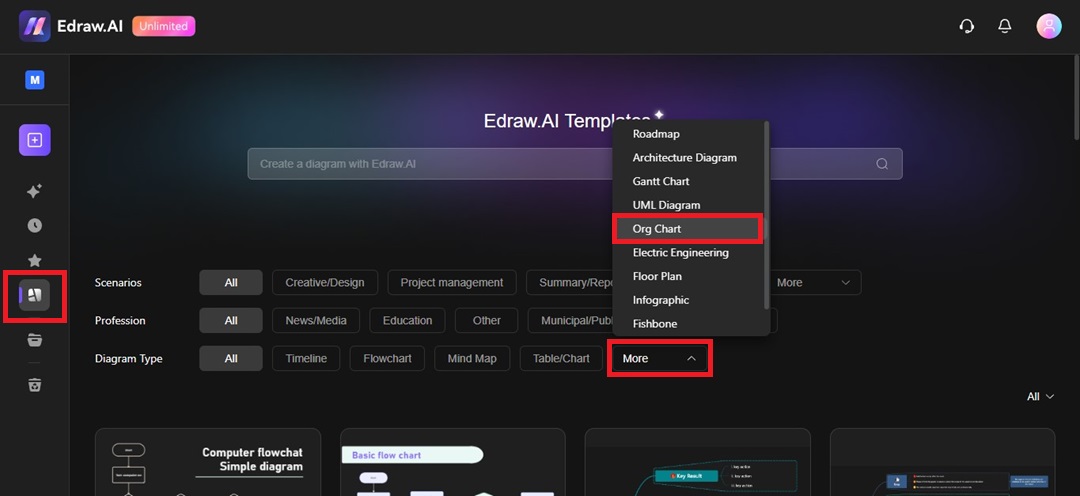
Step 1
Open Edraw.AI and go to Templates from the left navigation pane. Next, select Org Chart from the Diagram Type options.
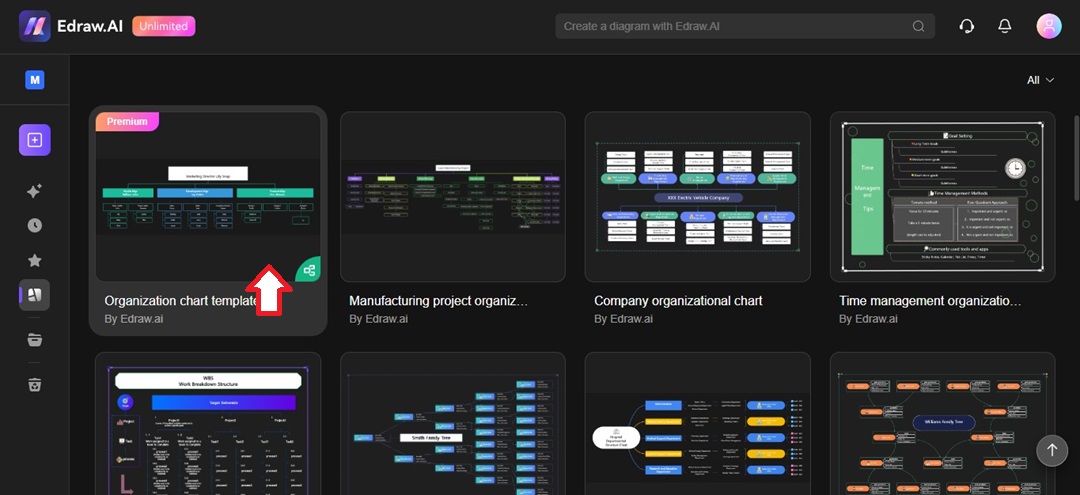
Step 2
Choose an org chart template that fits your organization’s structure and click Create with template to open it.
Step 3
Click and type directly within each shape to include names, positions, and/or departments.
Step 4
Customize theme, fonts, and other styles to suit your branding and formatting preferences. Open the right panel and go to the Canvas or Style tab.
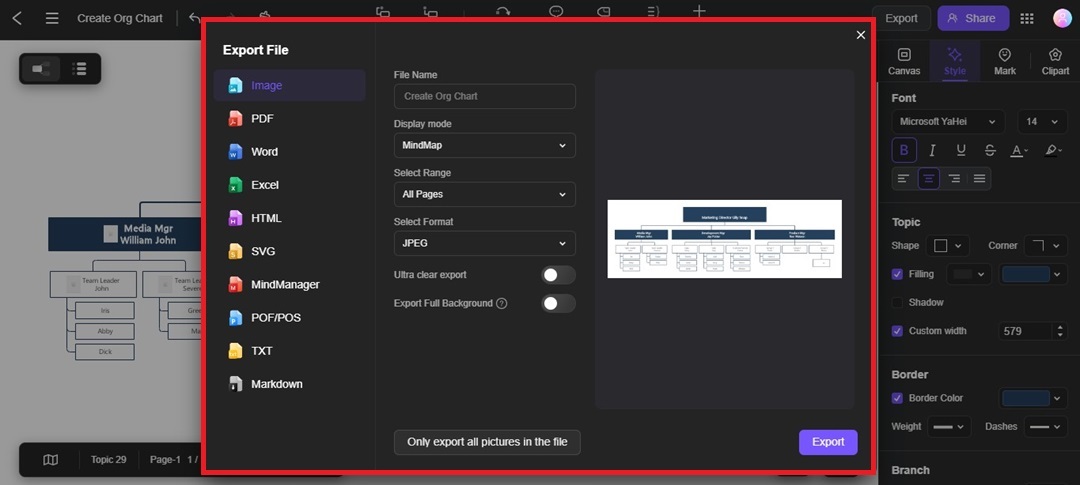
Step 5 Share and Export the Org Chart
Click Share to send the org chart to others or Export on the top right side to download it in various formats like Word, PDF, or PNG. Then, you can upload the org chart in Google Docs.
Tips for Making Org Charts in Google Docs
Creating an org chart in Google Docs can be straightforward using the right tricks.
Use Colors for Departments: Add colors to represent different departments or teams. This makes it easy to identify sections of the organization immediately.
Limit Text in Boxes: Keep labels short and to the point. Too much text can make the chart look cluttered, so only include names and job titles for clarity.
Save Time With Copy-Paste: Need more boxes? Copy and paste existing shapes to keep size and style consistent across your org chart. This simple tip speeds up the process, especially for larger org charts.
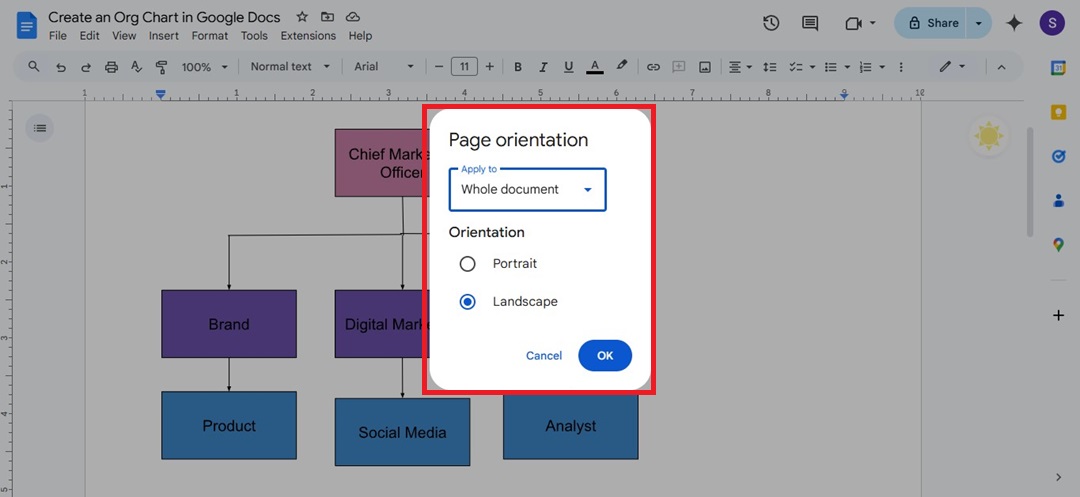
Change the Page Layout for More Space: If your org chart in Google Docs doesn’t fit on the page, consider adjusting the page layout to Landscape. This gives you more horizontal space and can prevent your chart from looking cramped. Go to Format > Page orientation and select Landscape.
Drag and Adjust Borders: Once the chart is on your Google Docs page, you can resize it by dragging the corners. Click the chart, then pull the edges to fit it neatly within the page margins. This prevents parts of the chart from getting cut off.
Conclusion
Creating an org chart in Google Docs works well for simple needs. But if you want more flexibility, exploring other tools might save you time and hassle.
Edraw.AI gives you a wider range of templates and customization options. But if you’re sticking with Google Docs, these tips above should make it easier to create and manage your organizational charts. Now, you can choose the best option for your needs and get your org chart set up effectively.

Prefer working locally?
Make 210 types of diagrams: flowcharts, blueprints, UML, etc
AI Mind Map, AI PPT, real-time
collaborative brainstorming
