
Visualizing complex systems and processes is vital to communication and decision-making. Especially when business and technology are moving at lightning speeds. Here come Data Flow Diagrams (DFDs), a great way to show how information moves through a system.
Putting together these models doesn't have to be hard, though. Thanks to innovative platforms like Edraw. Now, you can create professional-quality DFDs with unparalleled ease and speed. Now, let's get into the world of DFDs and how Edraw.AI is transforming this process.
In this article
What is a Data Flow Diagram (DFD)?
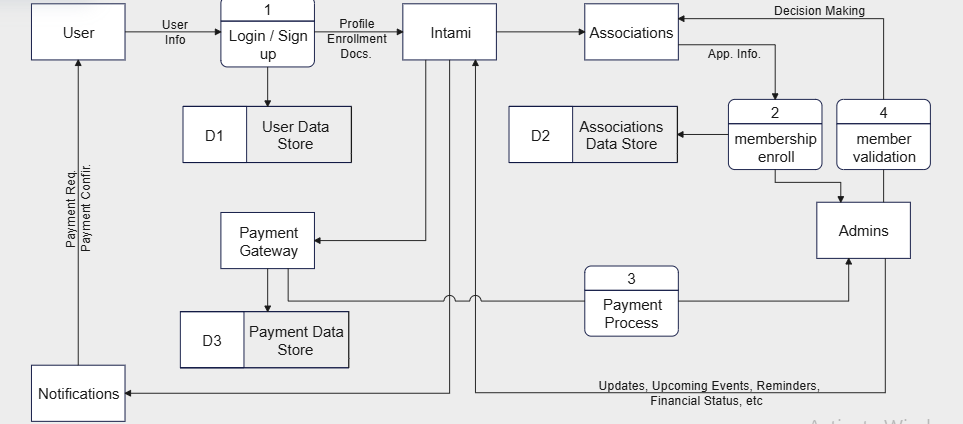
Data Flow Diagram (DFD) displays data inside a system or process by illustrating data visually. It shows how the different parts of a system work together, like how data is put in, handled, and sent out.
DFDs would help to visualize the significant steps involving the data. Such operations are based on software-system processes. As such, it is an essential tool for technical and non-technical stakeholders.
Key Components of a DFD
Every DFD is made up of four main components, each playing a crucial role in telling the data's story:
Processes: These are shown as circles or ovals and tell us how inputs transform into outputs. A process involves changing data, such as computation and sorting.
Data Stores: These are represented by horizontal lines (or rectangles) and are repositories for holding data for later use. They can be files, databases, or whatever medium is applicable.
External Entities: These are shown as squares, sources, or data destinations outside the system. For instance, customers or external organizations don't constitute part of the system but only interact with it.
Data Flows: Data flows (indicated by arrows) illustrate the flow of information between processes, data stores, and external entities (personal, private, and public) and indicate which data or transformations are provided or used by each system or across systems. Path data serves as a proxy for what the data does as it travels through the system; it is a literal representation of a path.
Why Use Data Flow Diagrams?
- Simplification of Complex Systems: They simplify complex systems into small sections. It allows everybody to understand how the data flows through the system.
- Improved Communication: DFDs enable a common language in visualization. They connect technical and non-technical stakeholders and improve understanding and collaboration.
- Identification of Inefficiencies: DFDs illustrate data flows to identify bottlenecks or inefficiencies. They make room for optimization in processes.
- Support for System Design and Analysis: DFDs in software engineering act as blueprints before coding. They can also be used to analyze existing software systems.
- Documentation and Maintenance: DFDs are applicable documentation for system development. They enhance projects and serve as helpful reference points for developers and maintainers.
Benefits of Using Edraw.AI for Creating DFDs
Edraw AI makes it easy to create Data Flow Diagrams and other diagrams. Its user-friendly interface features advanced AI capabilities that make it suitable for established and beginners.
User-Friendly Interface
Edraw.AI's user interface is built for you. It's intuitive, accessible, and streamlined to make your DFD creation process as smooth as possible:
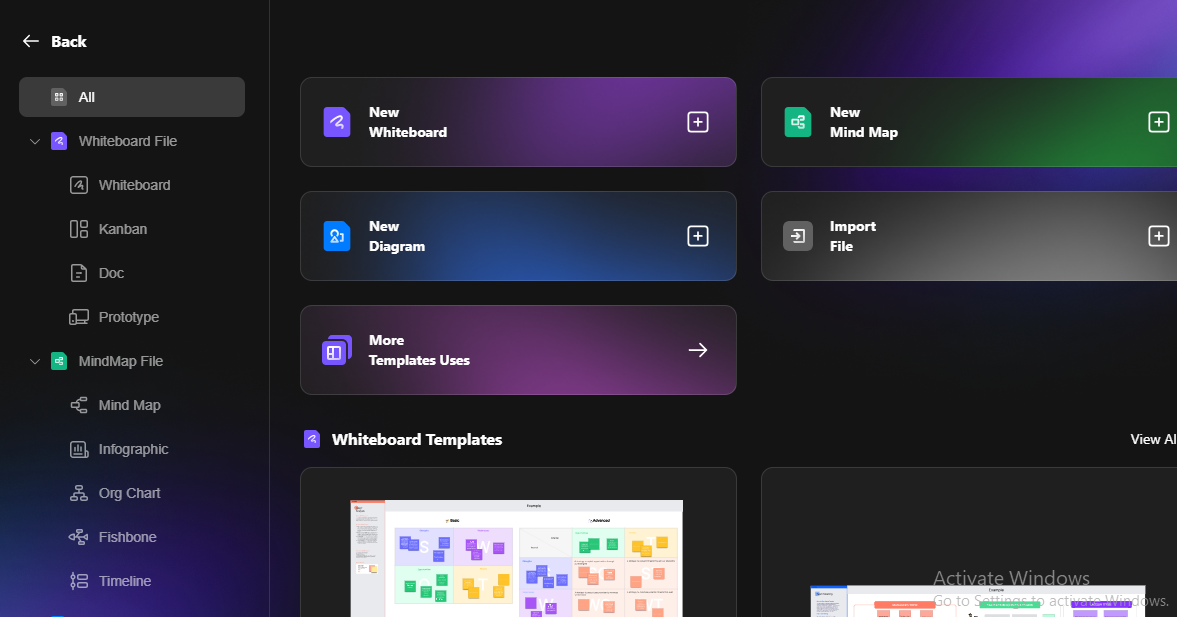
- It provides easy access to all tools and features on the home screen to quickly create or open new projects.
- Edraw.AI has an AI-powered tab for interacting with all these AI tools. It helps you get started with everything from AI mind maps to flowchart generation.
- The interactive toolbar and shortcuts enable you to initiate AI features quickly.
AI-Powered Features
The AI capabilities of Edraw.AI are where this tool shines:
- Automated Diagram Creation: You can input text descriptions or text data. AI can automatically create DFDs for you, saving you time and complexity.
- Real-Time Assistance and Suggestions: The AI assistant makes real-time suggestions. This guidance helps you fine-tune your diagrams.
- Pre-Scenario AI: This will polish the text, adjust paragraph length and tone, and beautify diagrams, automating this for the best-optimized workflow.
Extensive Templates
Edraw.AI offers built-in templates specifically for DFDs that can be imported to Edraw. AI. These templates can be a starting point for customizing data according to your needs.
Collaboration Features
Multiple team members can co-edit diagrams in real time with Edraw.AI. This feature must exist for people who work on team projects that require feedback from several stakeholders. Also, diagrams can be shared directly in team spaces. You can give customizable permissions or download in several formats with Edraw.AI.
How to Create a Data Flow Diagram
Now that we've explored the features of Edraw.AI. Let's walk through the process of creating a Data Flow Diagram using this powerful tool:
Step 1: To access Edraw.AI
Open Edraw.AI in a web browser. If you need to log in, do so for your account.
Step 2: Select a DFD Template
After logging in, select "Create a new diagram for a new project." The template section contains templates related to the "Data Flow Diagram" or "Basic Flowchart."
Step 3: Customize the DFD
You select your template and start tweaking away to fit your specific needs. Drag and drop is used to add symbols from the pervasive symbol library. Place these symbols to reflect how data flows through your system.
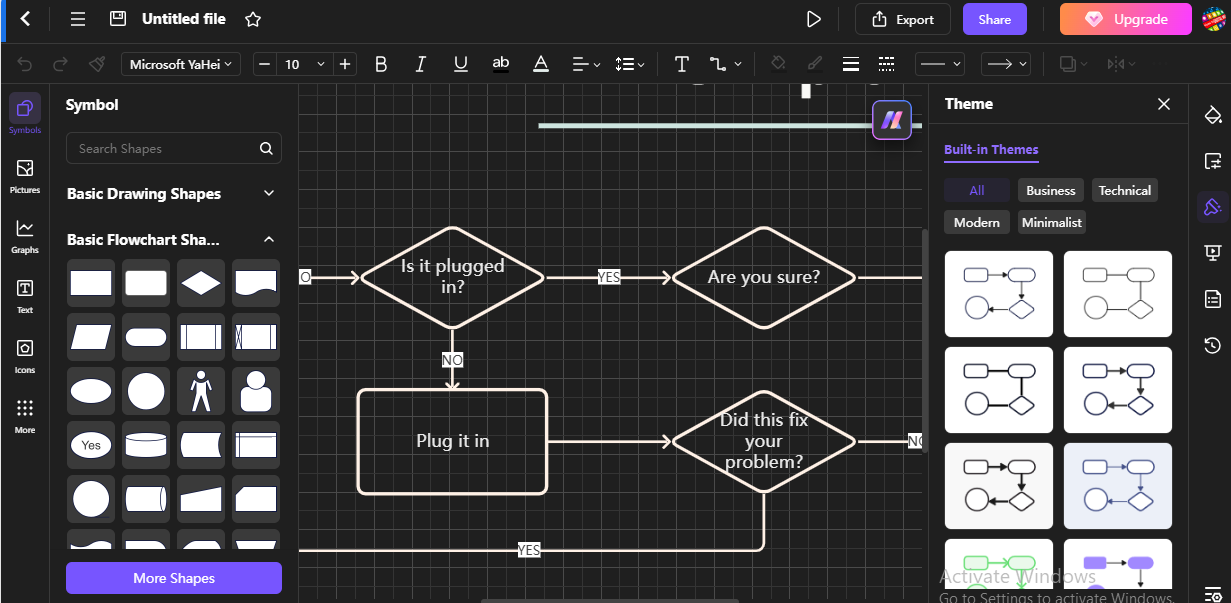
Step 4: Add/Edit Entities, Processes, and Data Flows
Since necessary components such as processes, data stores, and external entities are added to the model from the library, the symbol library should be used. Using data flow arrows, connect these symbols, which depict how information is moved around the system.
Step 5: Use AI Tools for Suggestions and Error Detection
Take advantage of Edraw.AI's Artificial Intelligence to find suggestions on diagram elements and correct errors or inefficiencies in your data flow.
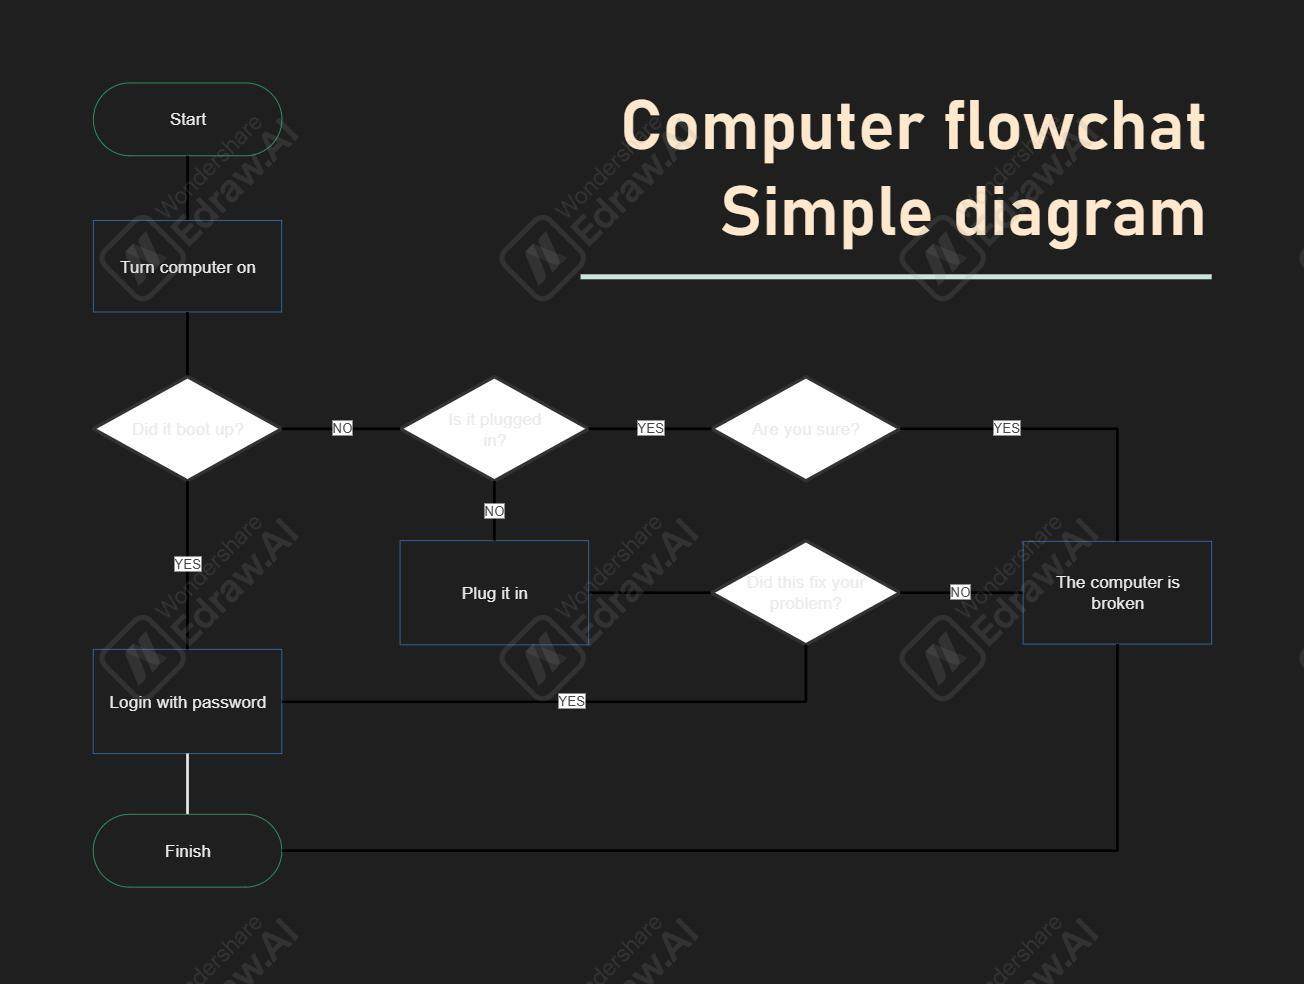
Step 6: Style and Format
Change the colors, fonts, and line style of your DFD to make it easier to understand and present more attractively. Edraw.AI provides various formatting tools, so you don't have to settle for a professional look.
Step 7: Export and Share
When you're happy with your DFD, save your work. With Edraw.AI, you can export your diagram in any format you wish (PDF, Word, or Excel), share it with others, or integrate it into your reports.
Examples of Data Flow Diagrams
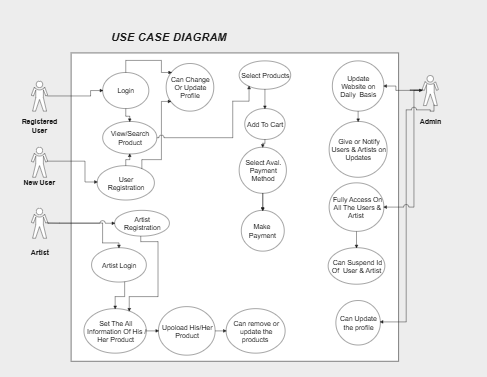
Online Shopping DFD:
This diagram shows the flow of information inside an online store, including a selection of goods, payment, and order processing. Edraw.AI offers templates and a user-friendly interface to map out the complex data flows of e-commerce systems.
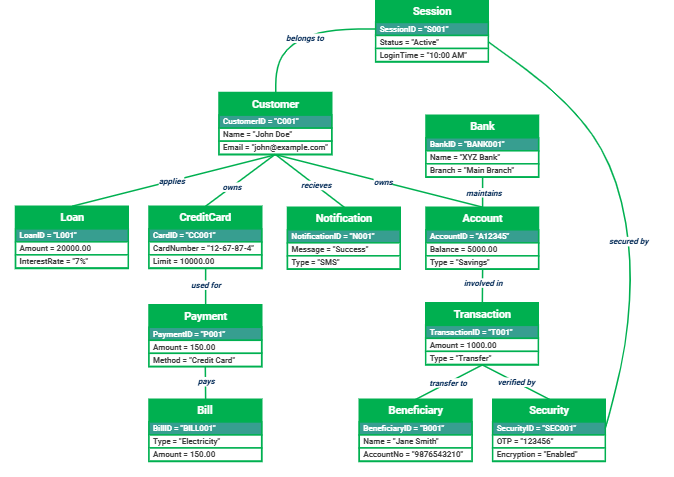
Banking System DFD:
Data flow associated with transactions, account management, and customer exchange. Edraw.AI is an ideal tool for drawing up detailed banking system DFDs. It is because of its ability to generate complex data flow diagrams with industry-specific symbols.
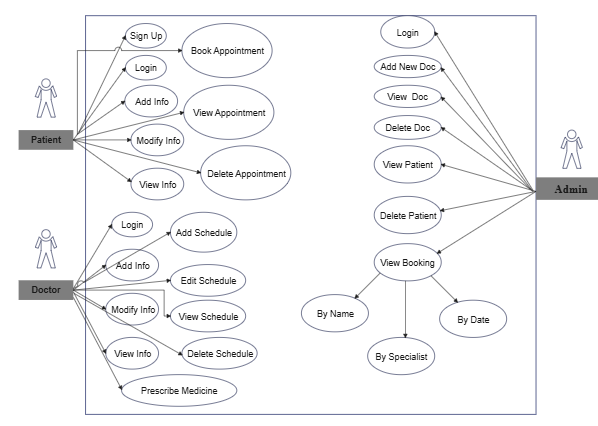
Hospital Management DFD:
The following diagram provides an overview of how data flows from one department to another. It covers processes in a hospital, from patient registration to appointment scheduling, medical record case management, and billing. Edraw.AI provides diagrams relevant to healthcare to visualize healthcare workflows.
Why Choose Edraw.AI Over Traditional DFD Tools?
While there are several tools available for creating DFDs, Edraw.AI stands out for several reasons:
AI-Powered Features: Unlike traditional tools, Edraw.AI uses AI to help you create diagrams. It offers suggestions and optimizations that can significantly speed up the process.
Comprehensive Template Library: Edraw has more starting points for your diagrams than many traditional tools, with over 30,000+ built-in templates you can edit.
User-Friendly Interface: The intuitive interface of Edraw.AI helps you avoid the steep learning curve that is typical of diagramming software, making this application easy even for beginners and experienced users.
Real-Time Collaboration: Most traditional tools include collaboration features. However, Edraw.AI gives the first real-time co-editing capabilities, allowing you to work on a diagram with your team instantly and efficiently.
Integration and Export Options: Edraw.AI's versatility is supported by exporting various formats and integrating other software.
Pro Tips for Effective DFD Creation
To make the most of Edraw.AI and create effective DFDs, consider these pro tips:
Keep It Simple: Be clear by being uncomplex. Label each element clearly to ensure data flows easily.
Use AI Suggestions: Edraw.AI offers AI suggestions to find possible improvements in your data flows and diagram structure.
Start with a Context Diagram: After setting the system's context diagram at the high level, proceed to more detailed levels.
Iterate and Refine: Use Edraw.AI's collaborative features to get feedback from a team or stakeholders. Based on the input, refine your diagram to ensure accuracy and comprehensiveness.
Leverage Templates: Begin with Edraw.AI's pre-made templates, saving time and ensuring you follow best practices in DFD creation.
Customize for Clarity: Use Edraw.AI to underline essential sections of your DFDs or align with the organizational brand to make it more communicable and easy to understand.
Conclusion
Data Flow Diagrams don't have to be a complex or painful process. Plus, with tools such as Edraw.AI, you can now leverage the power of AI to design high-quality, accurate, and visually appealing DFDs with minimal effort. Edraw.AI, whether you are a business analyst, a software developer, or a project manager, provides an all-encompassing solution: user-friendly interfaces and powerful AI capabilities.
With Edraw.AI's features and some best practices, you have a winning combination for creating DFDs that showcase your data flow, enable informed decisions, and drive your processes accordingly. Edraw.AI's combination of AI-powered tools, extensive templates, and collaboration features makes it an excellent choice for simplifying your diagramming process.
So why not give Edraw.AI a try? It's worth checking whether you're new to DFD or your current diagramming workflow needs an update. Try your free trial today and discover the future of diagram creation!

Prefer working locally?
Make 210 types of diagrams: flowcharts, blueprints, UML, etc
AI Mind Map, AI PPT, real-time
collaborative brainstorming
