Flowcharts in either business or technical fields are fundamental tools that help visualize processes, workflows, or systems clearly and systematically. They make complex ideas easy by turning them into easy-to-follow diagrams to simplify decision-making, process optimization, and communication. Whether you’re designing a software algorithm or mapping out a business strategy, the basics of flowcharting symbols are essential!
This article discusses what flowcharts are, how flowcharts work, and the process flow diagram symbols you need to grab the most from creating your flowcharts.
In this article
What Is a Flowchart?
A flowchart is generally the graphical representation of a process, workflow, or system. It employs symbols and arrows to represent the steps to accomplish a particular activity or solve a particular problem. Flowcharts are useful for laying down a process step-by-step to help understand process direction.
Benefits of Flowcharts:
Flowcharts are used often.
They assist individuals in imagining the course of the information and where there are potential slowdowns and working decisions that can be made. This helps in different practices, especially in software development, business planning and implementation, and project management, whereby efficiency is central.
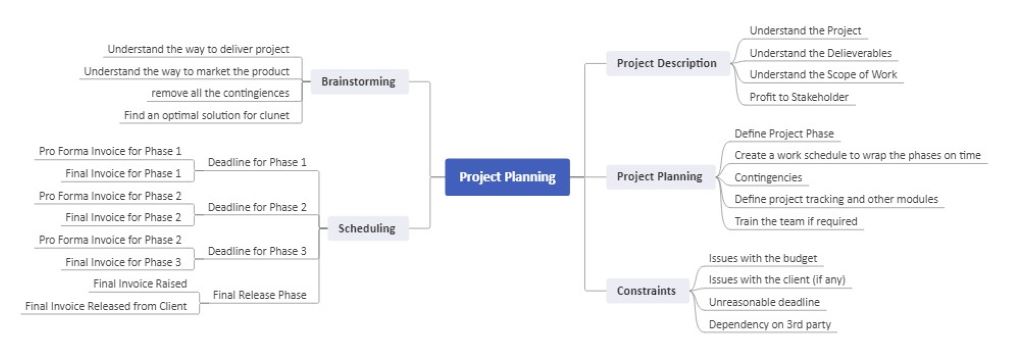
For instance, a project manager explains what must be done to introduce a new product. They draw an organizational chart where the first process is market research, followed by product description, brainstorming, and project planning strategy before launching the project.
They allow analysts to organize and represent a process more easily than if all processes were to be explained.
The diagram allows the whole team to visualize the sequential nature of all the stages so anyone can determine where issues can arise and timelines have to be changed.
What is a Flowchart Symbol
Flowchart symbols are graphic representations of various flowchart elements or activities in a particular flowchart.
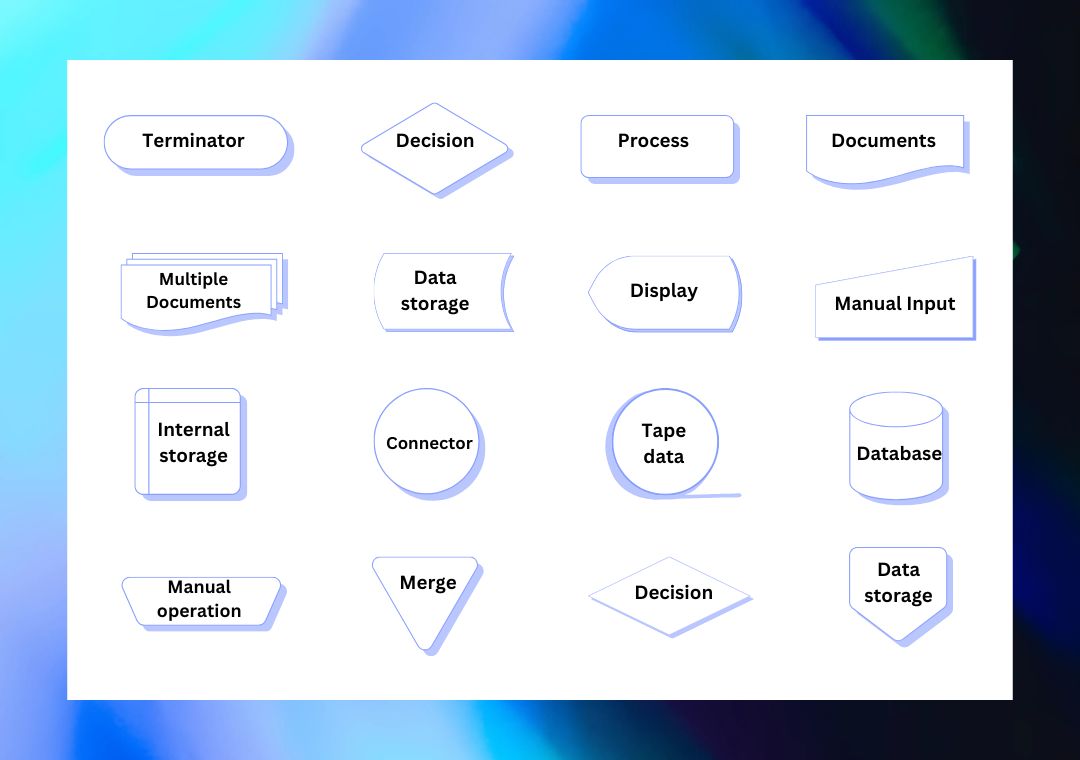
Every image is unique, and explaining complex processes using symbols is easier. These are easy to draw and help map tasks, decision points, inputs, outputs, and information or actions.
Basic Flowchart Symbols and Meanings
These 8 symbols are core to a flowchart, each meaning a particular function or operation. The symbols, along with their functions and the activity, are presented below:
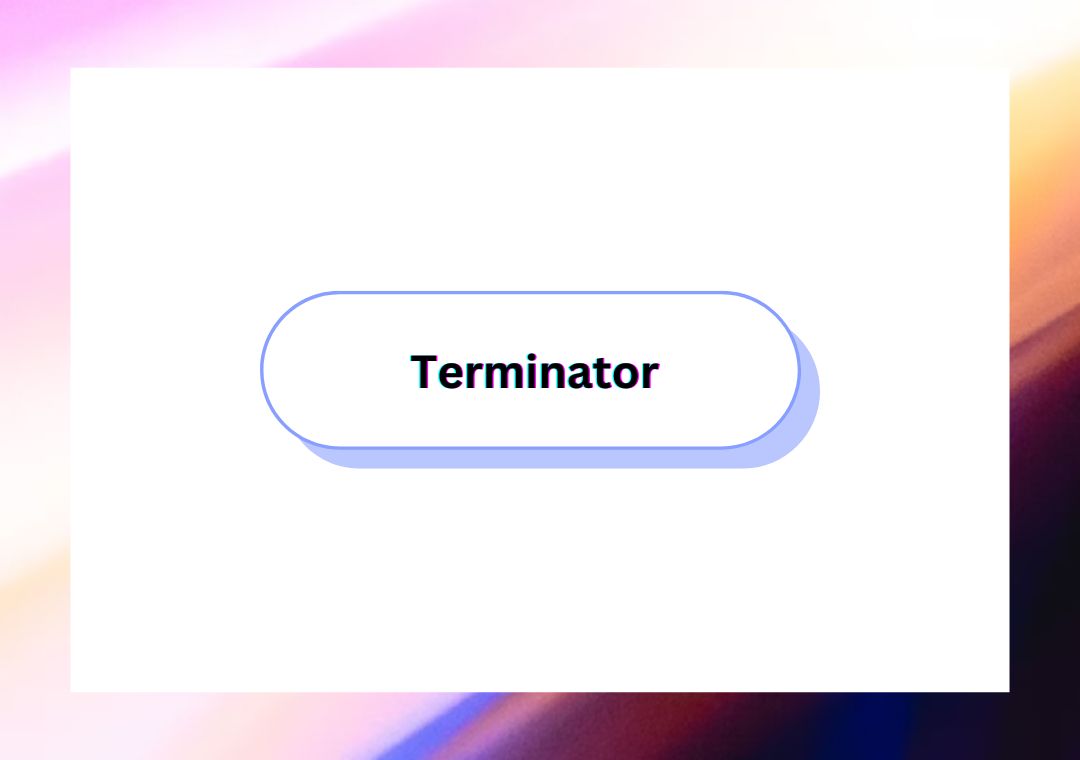
Start/End (Terminator)
A flowchart terminator symbol is used to indicate the start or the finish of a particular process. The sign is usually round or ovoid, with a rounded rectangle shape.
Meaning: This sign represents the start symbol in a flowchart and the end symbol in the flowchart.
Uses: they are applied to mark the beginning and end of sequences of actions and to express how one step in a sequence succeeded another.
Process (Action or Task)
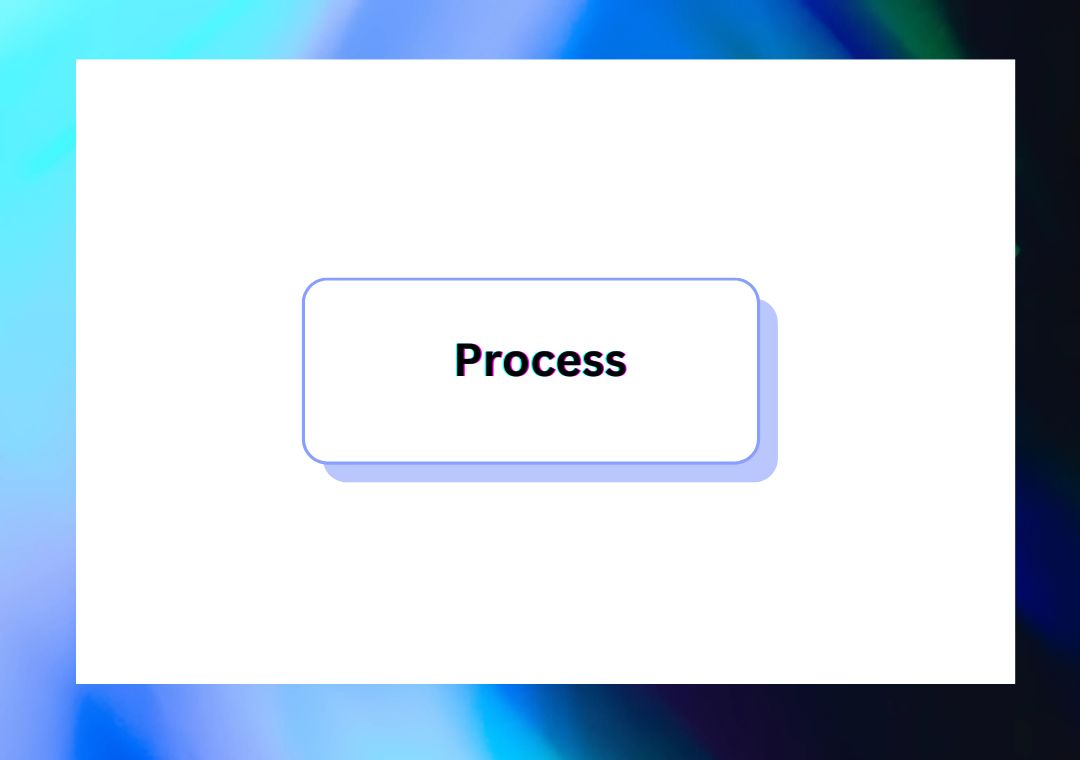
The process symbol means any kind of activity and can be an action, task, or operation included in the process.
Meaning: It is an inscription located in a rectangular shape and points to a definite action that has to be done.
Uses: Commonly employed to refer to the tasks or operations carried out within an organization’s processes, including computations, data manipulation, or any other undertakings that help advance the business’s flow.
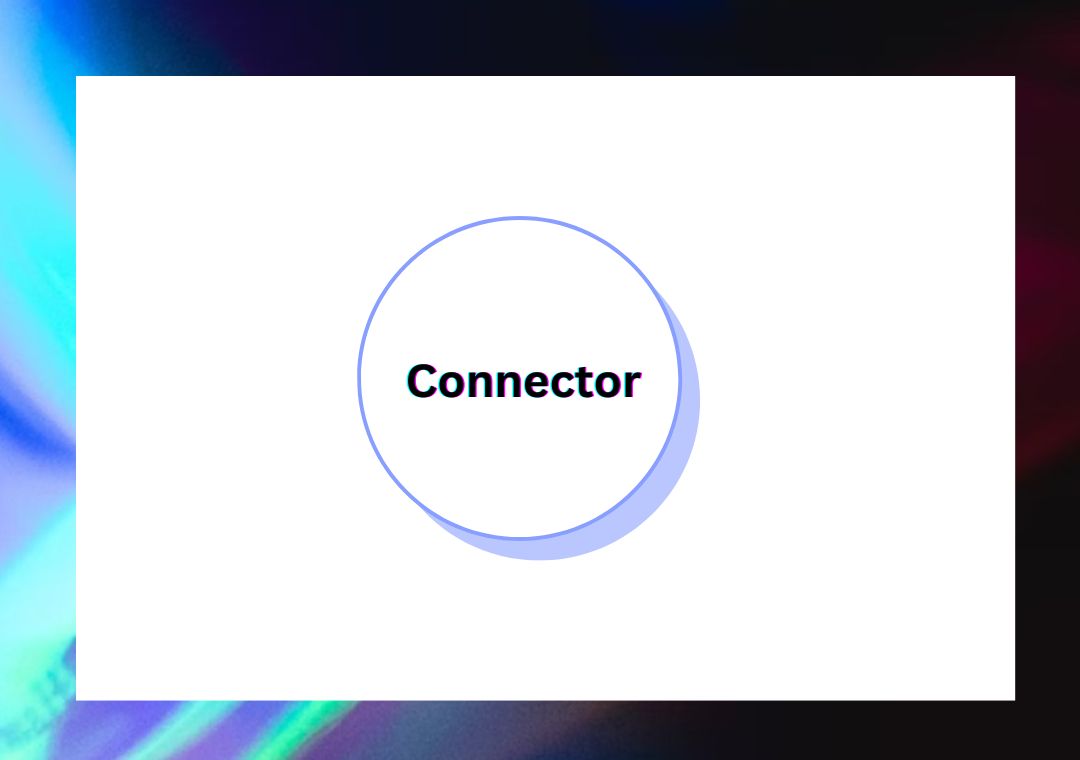
Connector
Sub-templates connect related segments of the flowchart when it has many sections, and the diagram cannot be placed on one large page.
Meaning: The connector is designed as a small circle with a label or labeled arrow so the user can continue the reading between separations.
Uses: Often used in systems with many branches of processes to join processes related to an unrelated branch with the main flowchart without crossing lines.
Database (Storage)
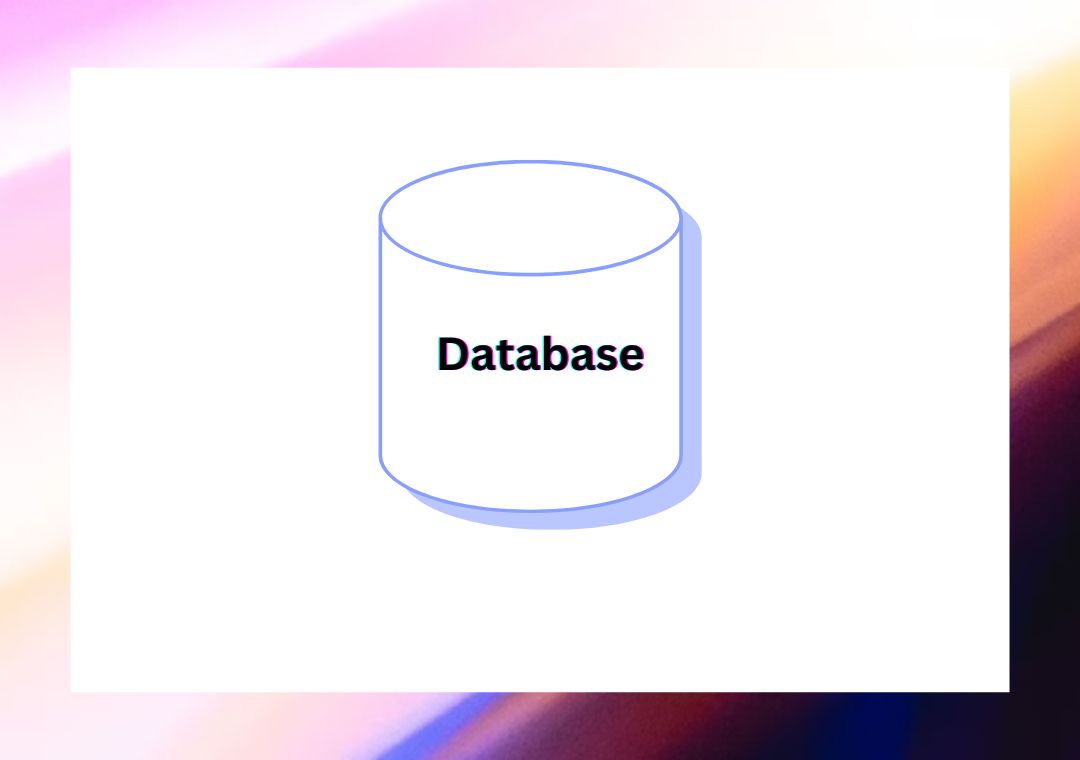
The database symbol informs that data is drawn from or saved in a database.
Meaning: In the shape of a cylinder, this symbol points to an area where information is stored in a system.
Uses: Usually employed in the process flowcharts, which deal with data handling, it underlines the activities involving storing or retrieving information from a databank.
Decision
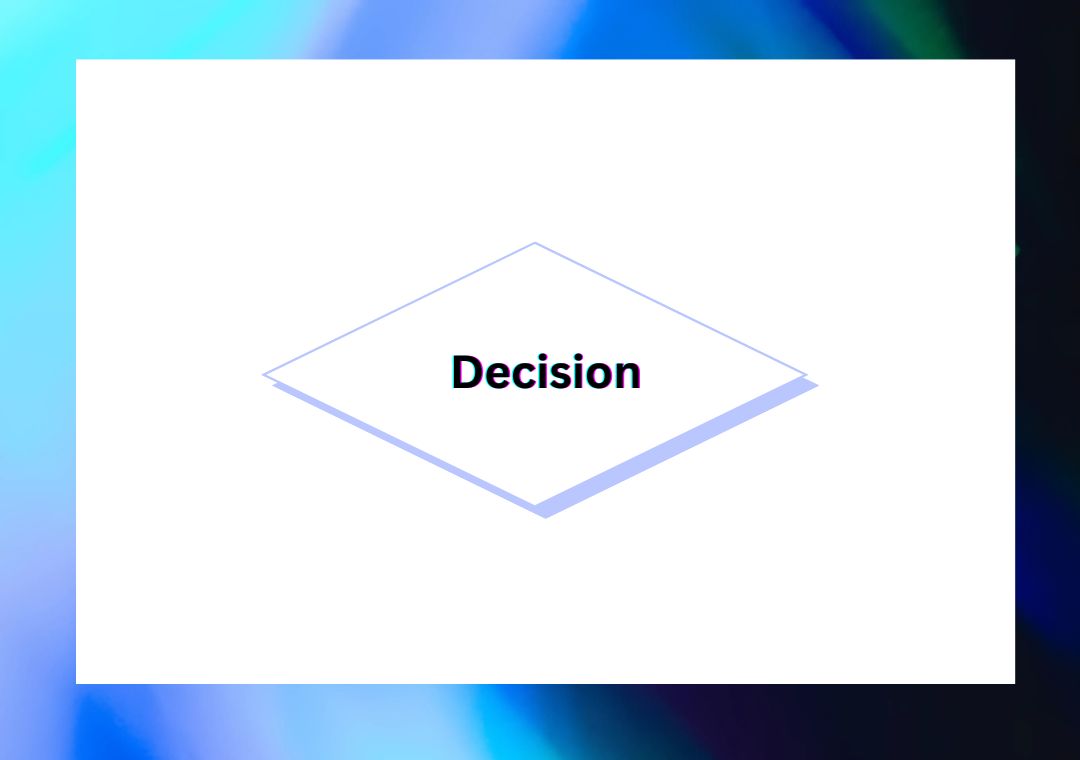
The decision symbol in a flowchart is employed when some choices and outcomes stem from a decision at that specific point in the organization.
Meaning: The cross shape of this symbol means it is used to show a question or a condition to respond to ‘yes’ or ‘no’ or ‘true/false’.
Uses: It points towards the shape of the flowchart depending on the decision made and causes different paths to result from the answer.
Input/Output (Data)
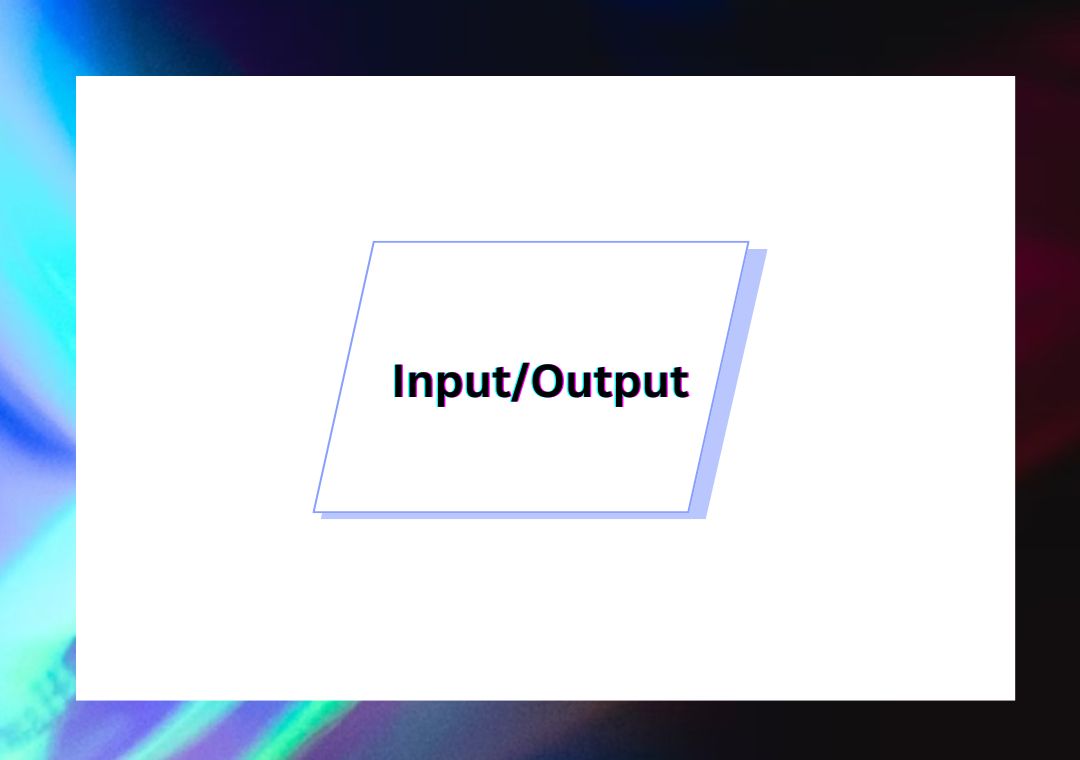
The input/output sign tells where information can get in or out of a system.
Meaning: In the form of a parallelogram, this symbol indicates a flow for data input or output.
Uses: Known to represent entry routes, user input, or output such as printed copies or results on the screen.
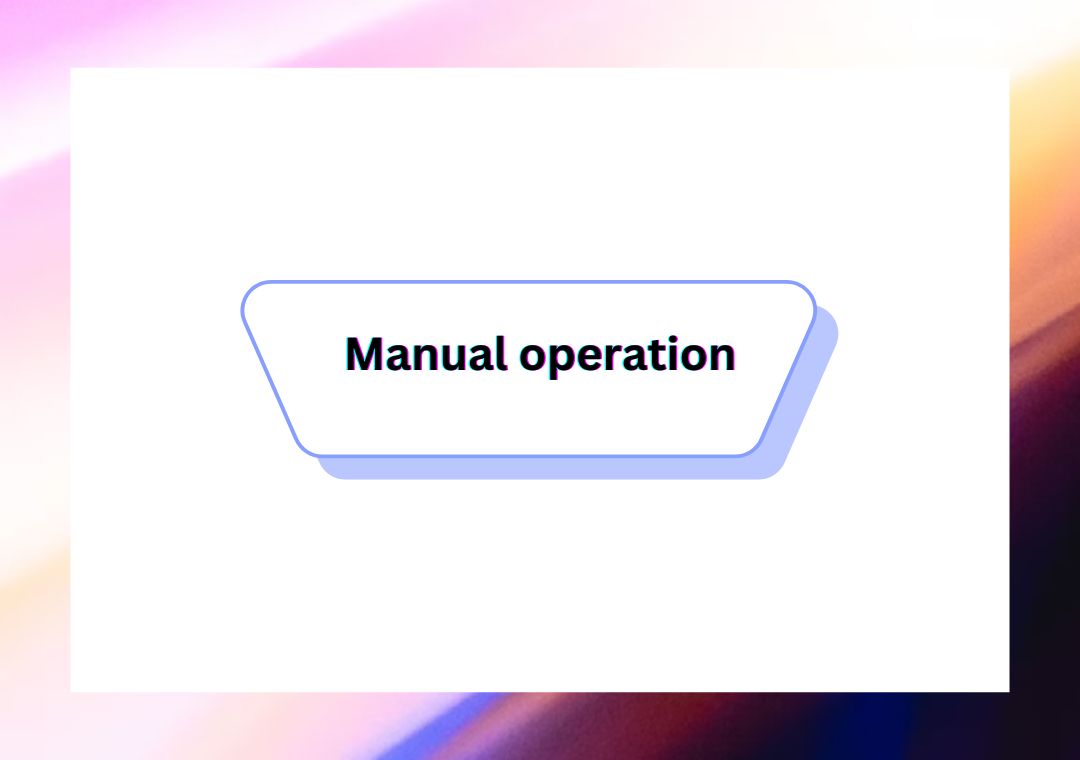
Manual Operation
The manual operation symbol indicates an operation that must be done manually.
Meaning: This flowchart icon is recognized as a trapezoid that symbolizes work that a robot cannot perform and needs to be done by a person.
Uses: Describe tasks requiring a human to perform some action, such as data input or check activities.
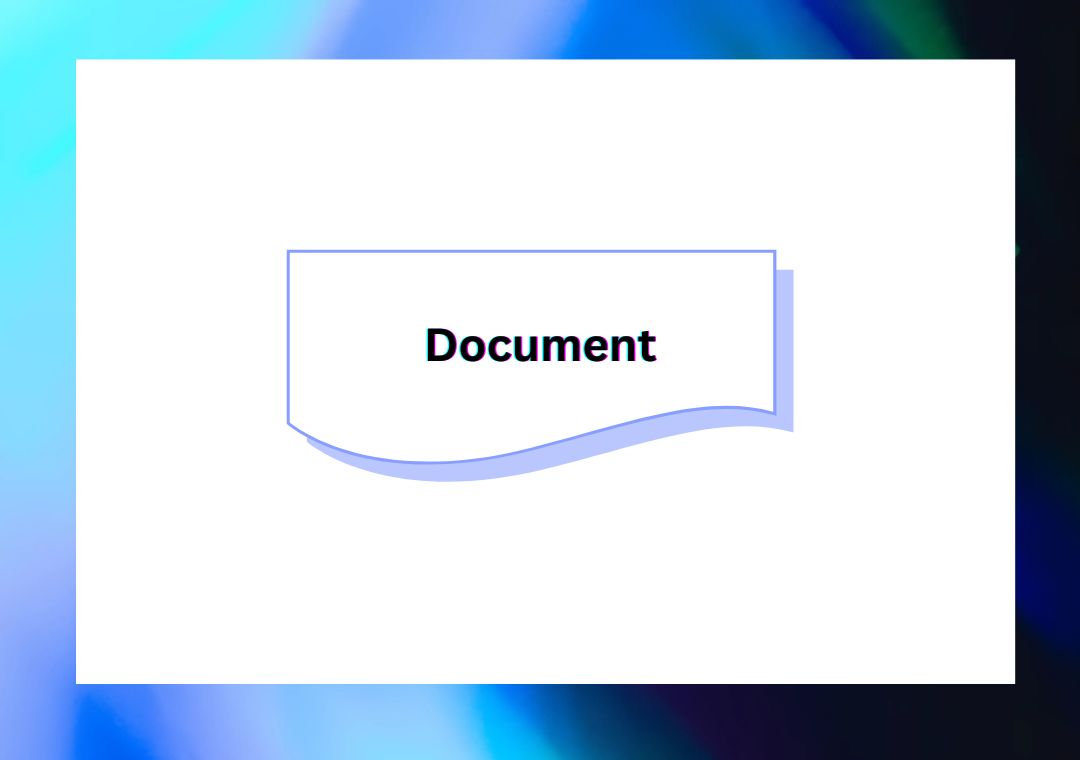
Document
The document symbol represents a step in which you must produce a document or report.
Meaning: A rectangle with a wavy line at the base represents any procedure that produces a document, whether in print or electronic form.
Uses: Applied when data is captured or transmitted, such as when creating bills, receipts, or reports.
How to Make a Flowchart in 4 Steps
Edraw.AI is a professional tool that you can use online to create flowcharts easily and quickly using word input.
As an AI-powered software, it helps you design flowcharts with AI and provides accuracy in your work done in various sectors.
To create a flowchart using Edraw.AI’s features, follow these steps:
Step 1 Access Edraw.AI
Open Edraw.AI and sign in or register for the platform.
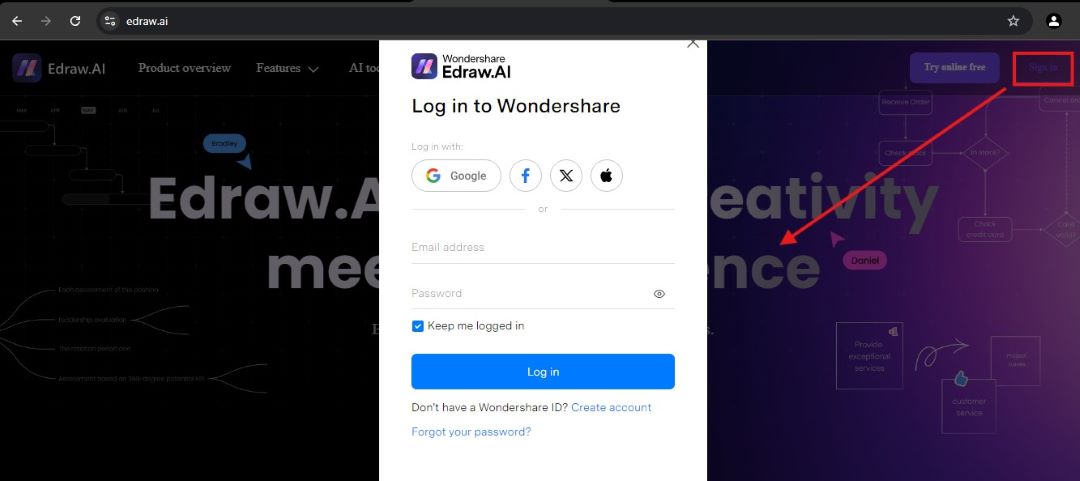
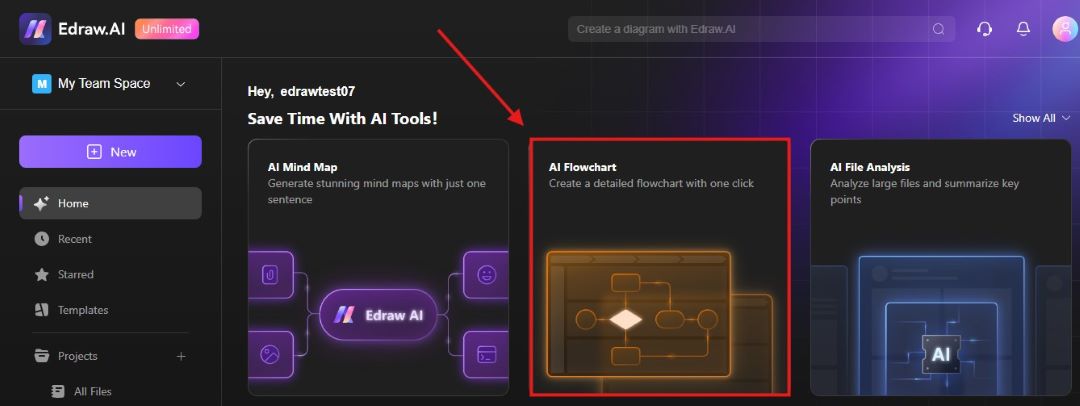
After you are logged in, you will be taken to the homepage. From there, click the button to create the flowchart.
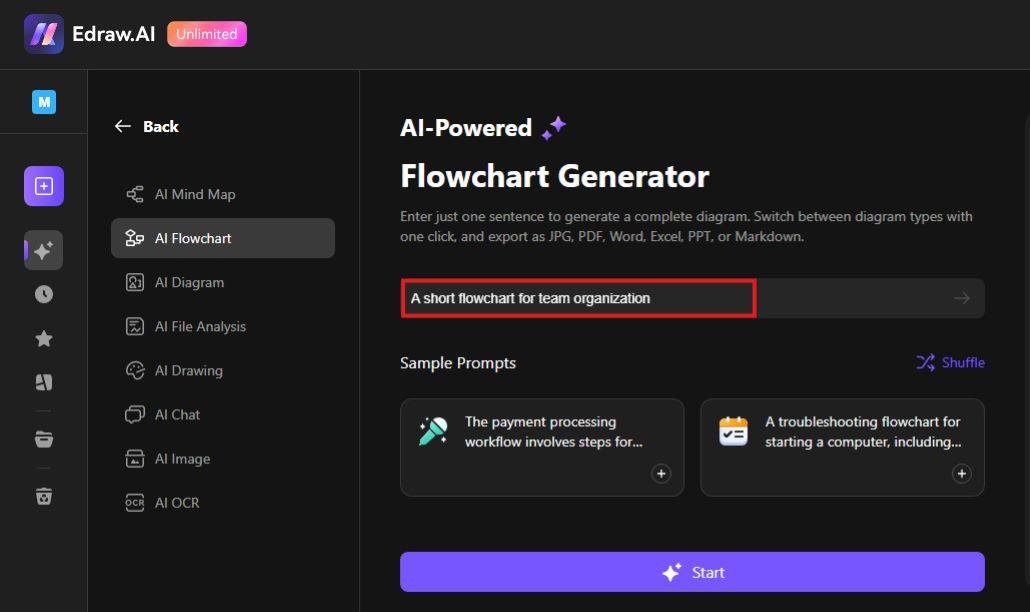
Step 2 Enter Your Text Description
In the text input area, describe your process or workflow in detail. Your prompt should include all the details of the steps/activities involved in the process, the start, and even the ending so the AI can generate it just like that.
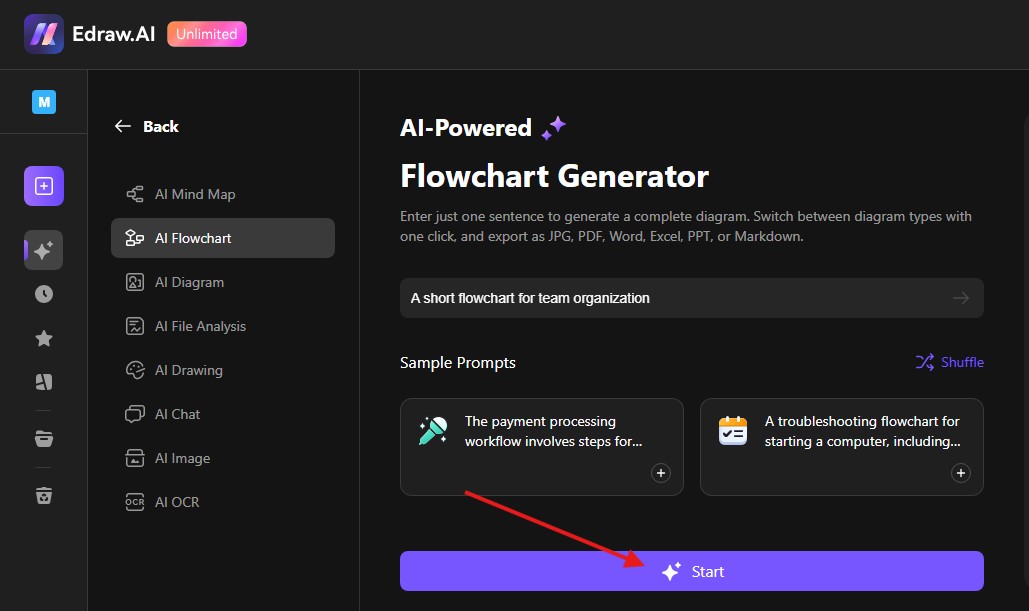
Step 3 Generate the Flowchart
To enable the underneath AI to create the flowchart from the text entered here, click the Start button.
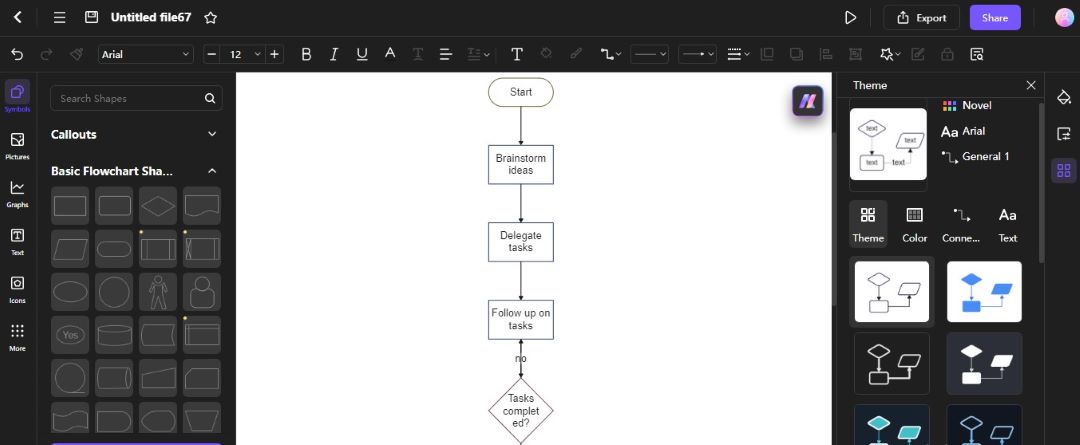
The tool will generate a flow chart of the steps, decisions, and data points.
Step 4 Customize and Save
Customize workflow by size, color, and text of the flowchart shapes used.
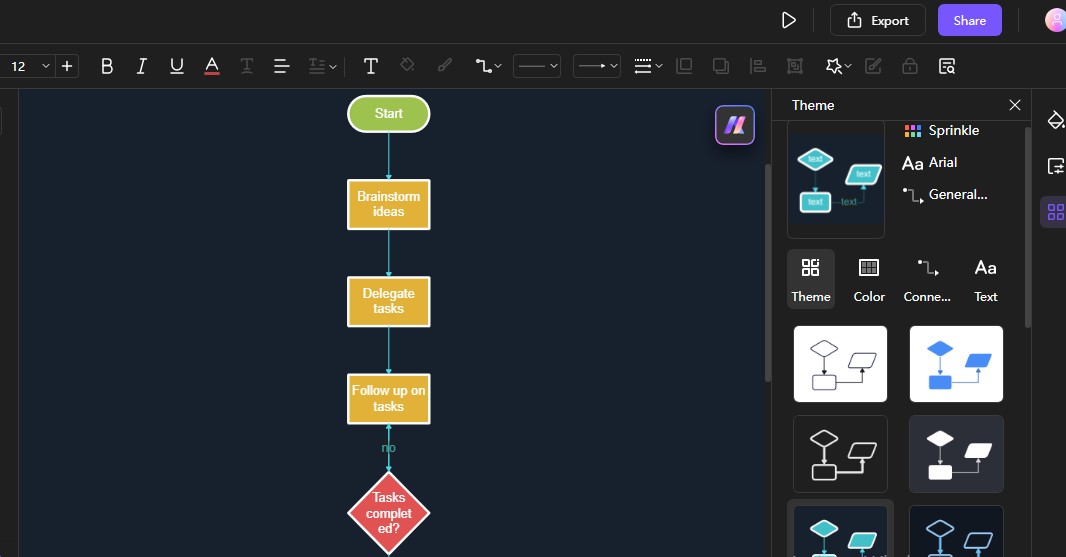
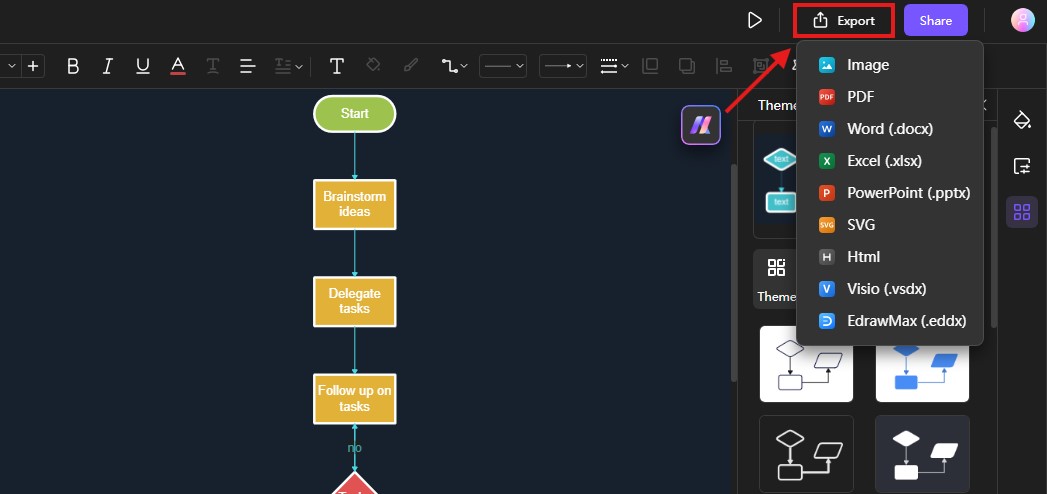
When you finish your flowchart, you can download and save it on your device or share it using the Edraw.ai interface.
Conclusion
There has never been a simpler way to create flowcharts, especially with the help of tools such as Edraw.ai. You only need simple text to enter if you want to make accurate, clear, easy-to-read flowcharts of your processes. These automated tools benefit the first-timers and the professionals working on these workflows to reduce time consumption and increase productivity.
With insights regarding the types of symbols on a flowchart and how AI technologies can be reapplied across different fields to enhance project effectiveness, you can conquer basic symbols and apply AI technologies to enhance project decision-making.

