Flowcharts are powerful tools that can help you to break down complex processes into a clear, step-by-step visual format. Originally born in the field of computer science to help handle algorithms and programming logic, flowcharts nowadays are widely used for both personal and professional reasons.
With its ability to simplify intricate tasks, flowchart is now seen as a fundamental tool, especially in business operations, project management, and decision-making. It can also be used for process analysis, helping organizations improve their efficiency and ensuring that everyone involved in a project is on the same page.
Although the chart may sometimes look a bit complicated, its making isn’t that daunting. Today I will walk you through the basics of flowcharts, tell you what types of flowcharts there are, and guide you step by step to make a flowchart.
What is a Flowchart
A flowchart is a visual tool that depicts a process, system, or workflow by dividing it into individual steps. Each step is shown as a shape, usually a box, and the flow of the process is weaved together by arrows.
Flowcharts are also used to illustrate complex processes in a way that is easy for you to follow, making them ideal for both understanding and communicating workflows.
Flowcharts were originally used in computer science to visualize algorithms, but their usage has since expanded to almost any field. They help clarify complex processes, unveil inefficiencies, and improve communication among team members.
Whether it’s for planning a project or analyzing a business process, flowcharts have become invaluable tools for organizing and optimizing tasks.
Types of Flowcharts
In this article
- Basic Flowchart
- Process Flowchart
- Data Flowchart
- Work Flowchart
- Swimlane Flowchart
- Cross-functional Flowchart
- Horizontal Flowchart
- Vertical Flowchart
- Risk Management Flowchart
- Sales Process Flowchart
- Service Process Flowchart
- Manufacturing Process Flowchart
- Quality Control Flowchart
- Inventory Management Flowchart
- Training Process Flowchart
- Project Management Flowchart
By Function
Basic Flowchart
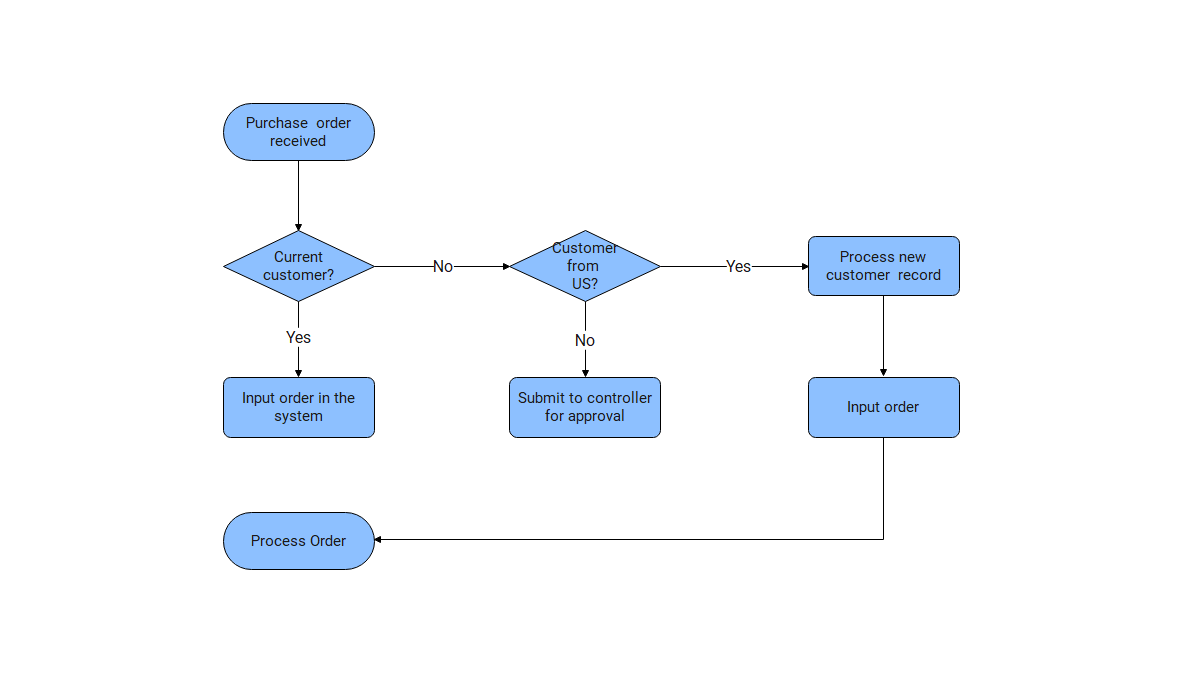
A basic flowchart is a simple diagram used to help you represent the steps in a process or workflow.
It consists of geometric figures such as rectangles and diamonds, linked by arrows that illustrate the flow of steps. Basic flowcharts help visualize processes clearly, making it easier for people to understand and communicate tasks or decisions.
Process Flow Diagram
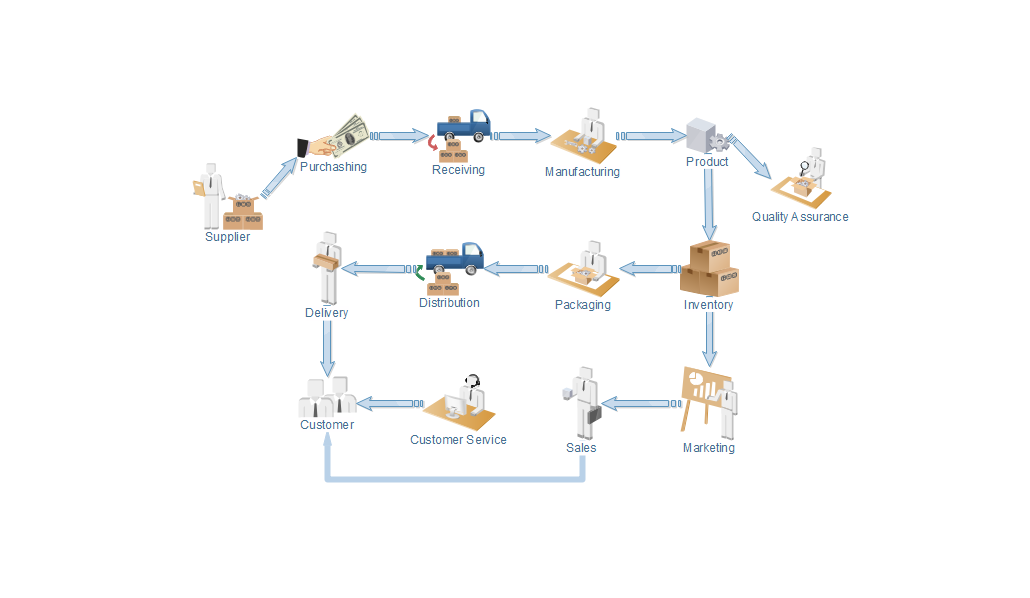
A process flow diagram is one that illustrates the process. It usually uses standardized symbols and shapes such as arrows to show the flow of materials, information, or actions between different stages.
This type of diagram can help you understand complex processes, improve efficiency, and facilitate communication across teams and stakeholders.
Data Flow Diagram
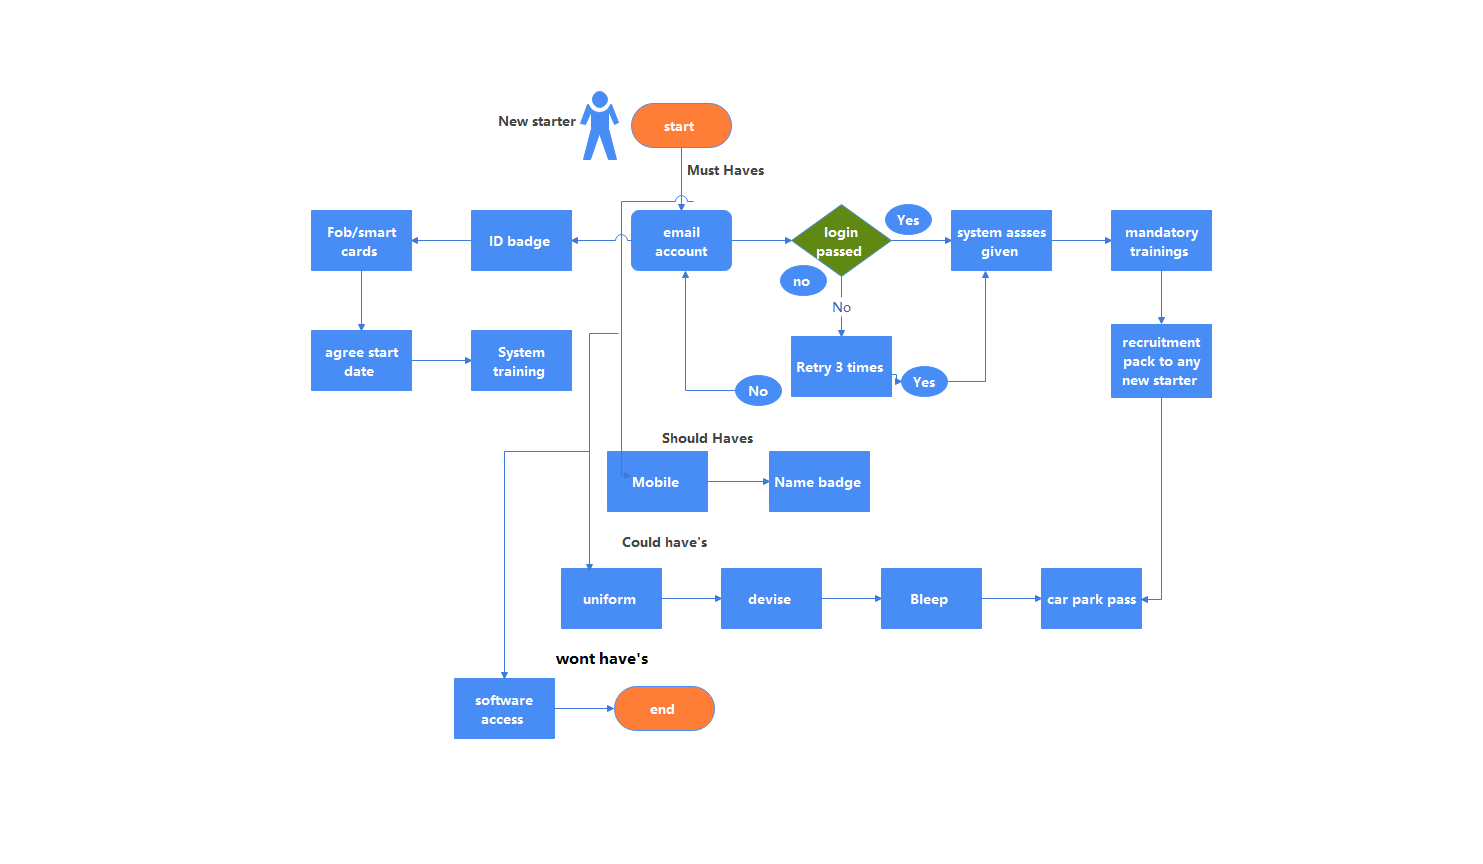
The data flow diagram visually illustrates how data moves through a system, highlighting the processes, data stores, and external entities involved.
Using the shapes and symbols, the diagram reflects the flow of data. This will help you better understand the data interactions, improve your system design, and enhance communication within teams.
Workflow Flow Diagram
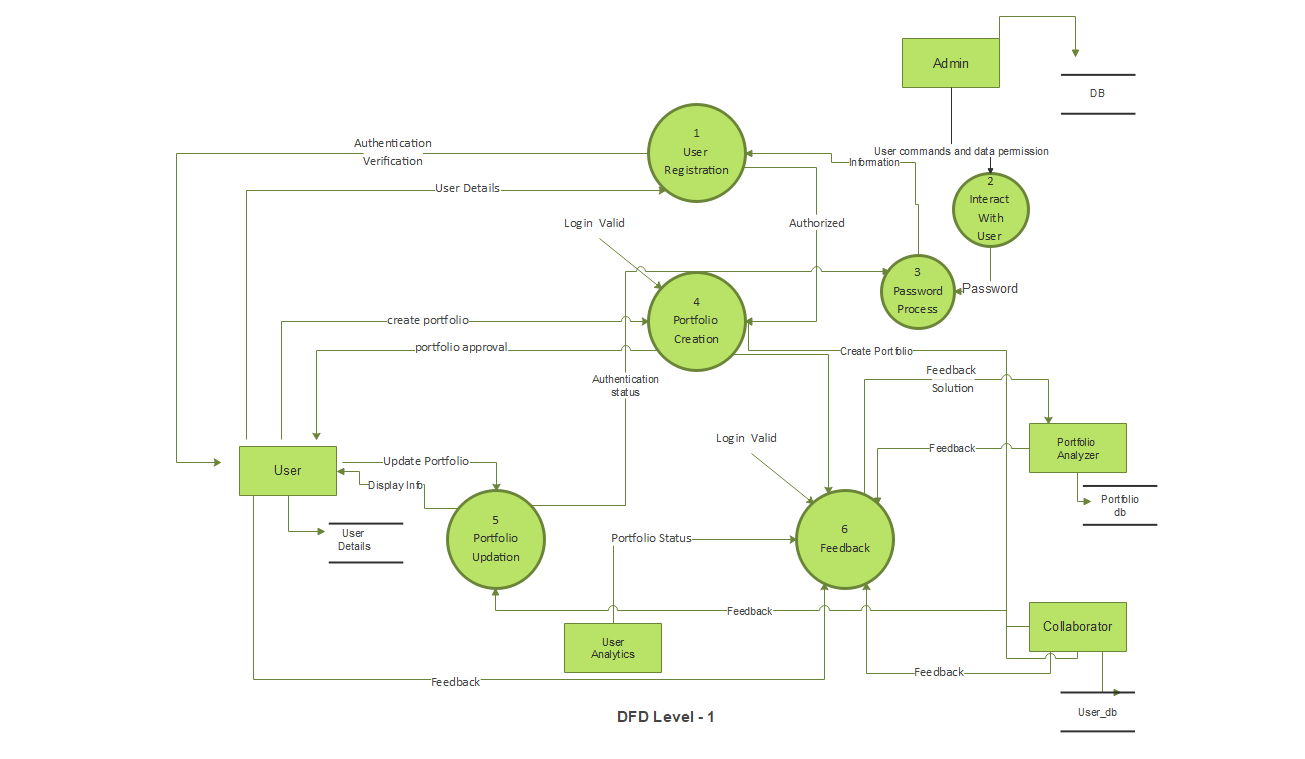
Workflow Flow Diagram visually represents the steps involved in a work process.
They serve as blueprints for task completion by using standardized shapes and symbols to show each stage and decision point. These diagrams can increase your understanding of roles and responsibilities, promote collaboration, and identify the weaknesses of the process.
By Structure
Swimlane Flowchart
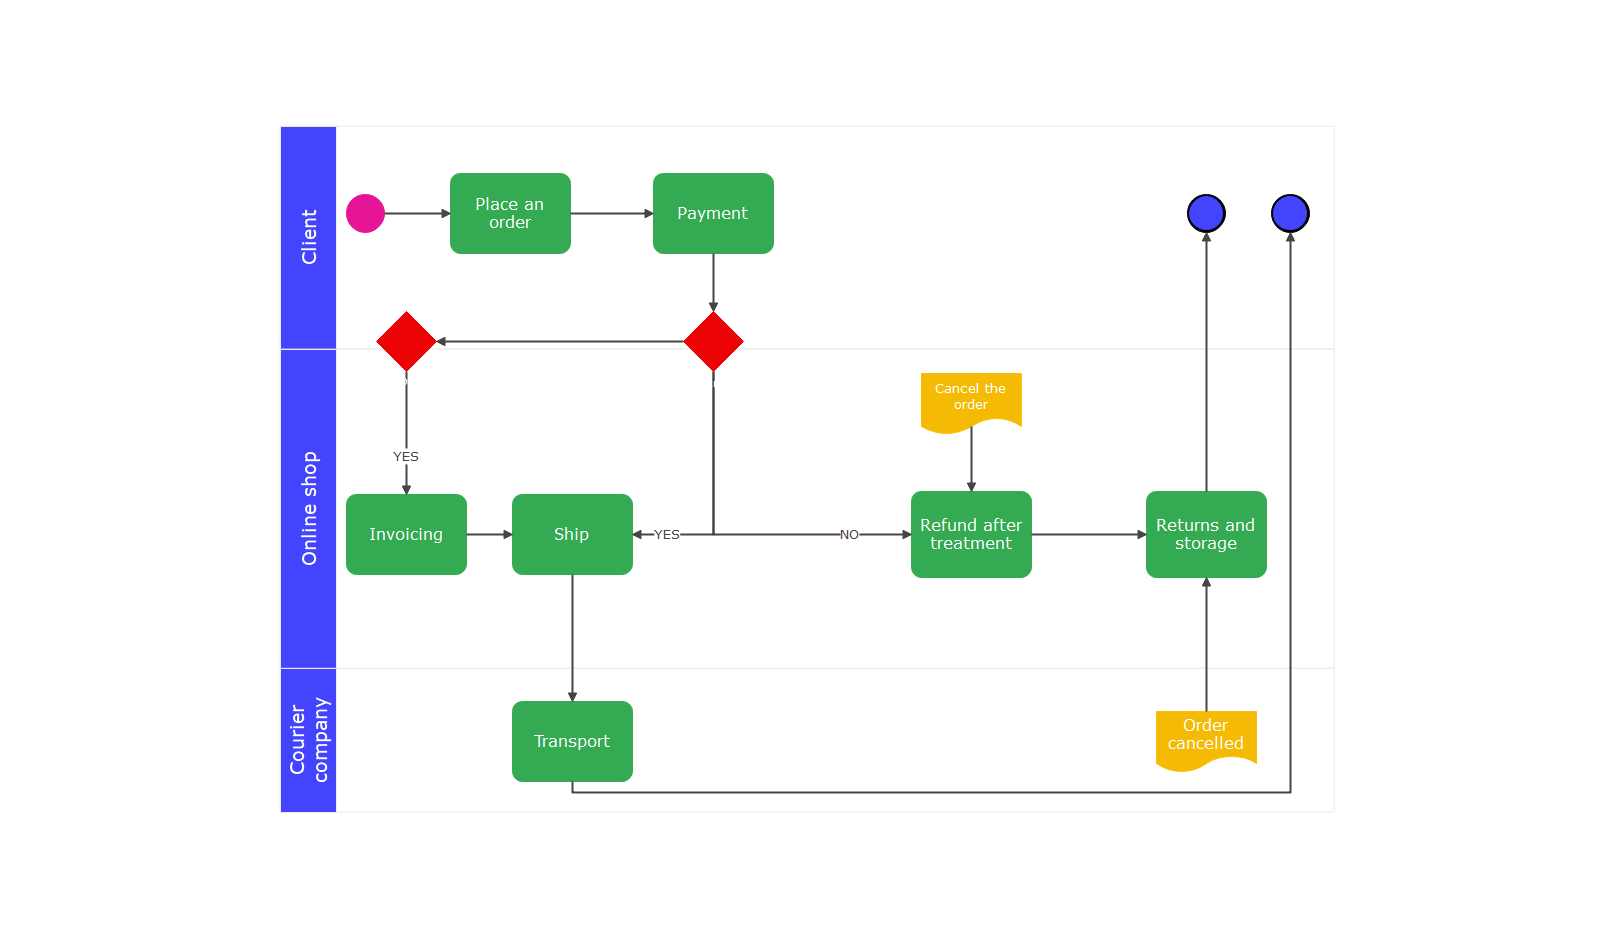
A Swimlane diagram is a visual tool that can help you organize responsibilities across various departments. By categorizing tasks into designated lanes, it clearly shows who is responsible for which step. This format enhances clarity, nurtures collaboration, and effectively shows the complex workflows between departments and within the workplace.
Cross-Functional Flowchart
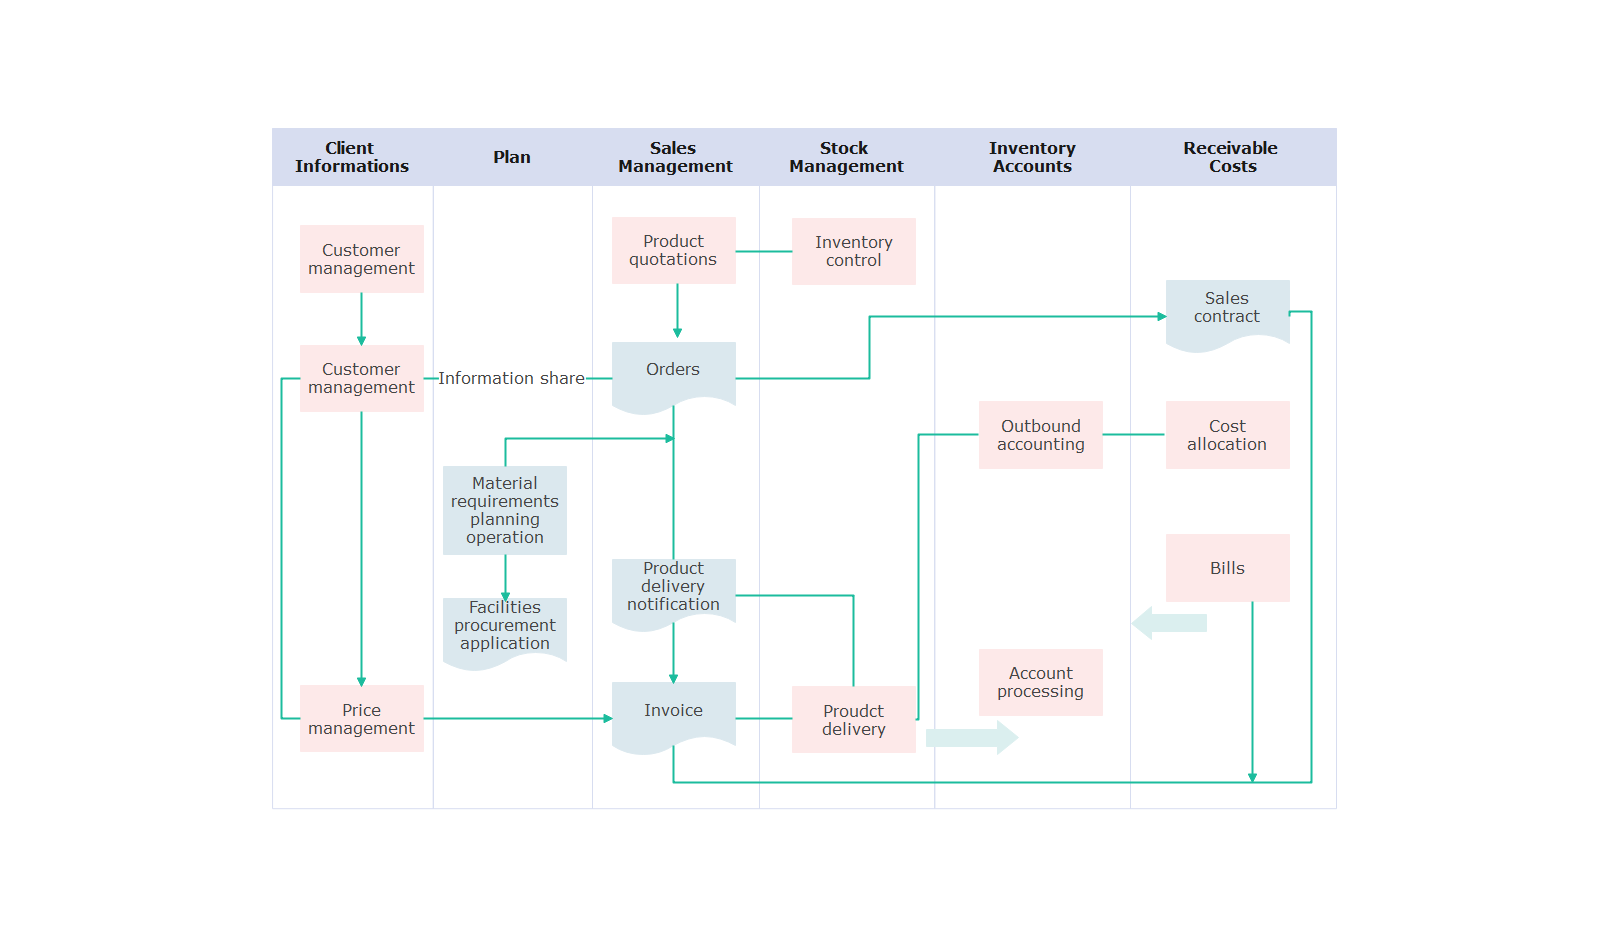
A cross-functional flowchart is like an upgrade of traditional flowcharts by incorporating swimlanes, clearly illustrating roles and responsibilities across various departments. This diagram highlights the relationships between process steps and the individuals or teams involved. Rhis would make it easier for you to understand who performs which specific tasks.
Horizontal Flowchart
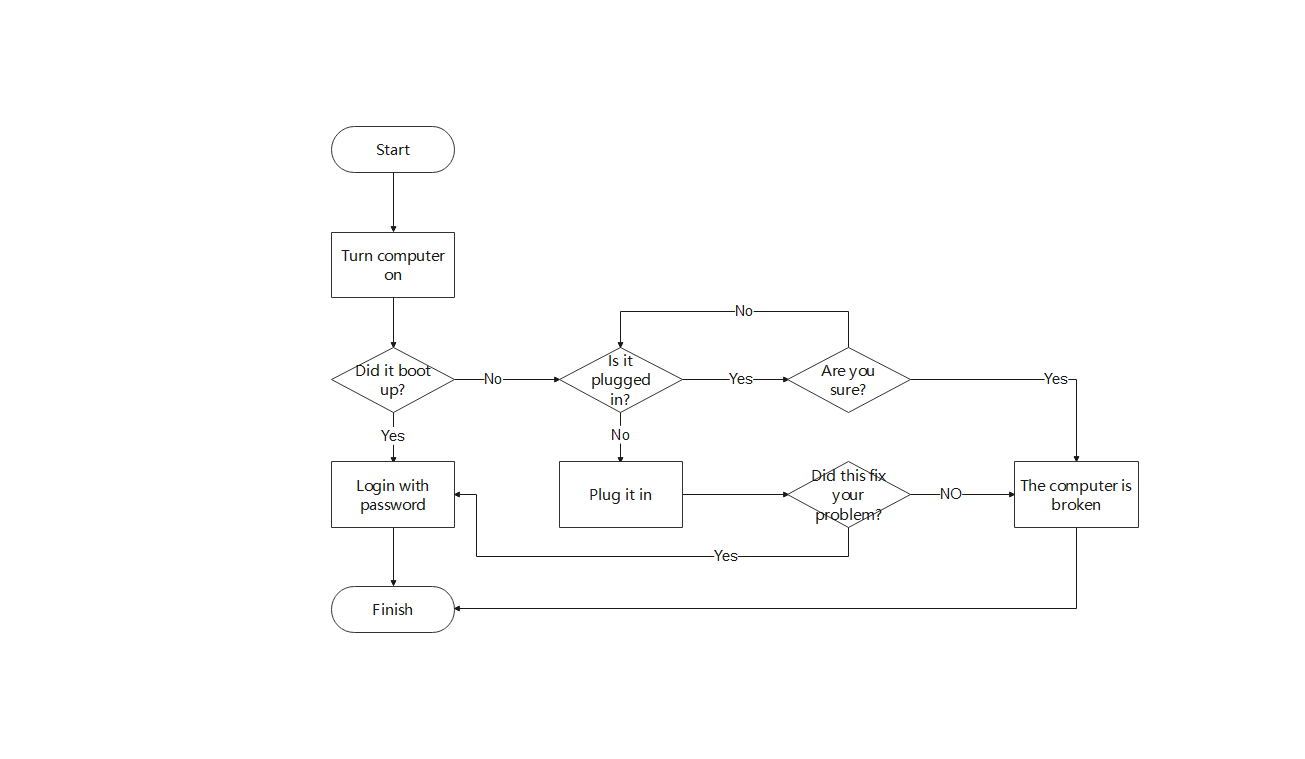
A Horizontal Flowchart displays process steps from left to right. It's ideal for complex processes with multiple branches or parallel tasks, providing more space for clarity and reducing visual clutter compared to vertical flowcharts. It helps organize long or detailed workflows.
Vertical Flowchart
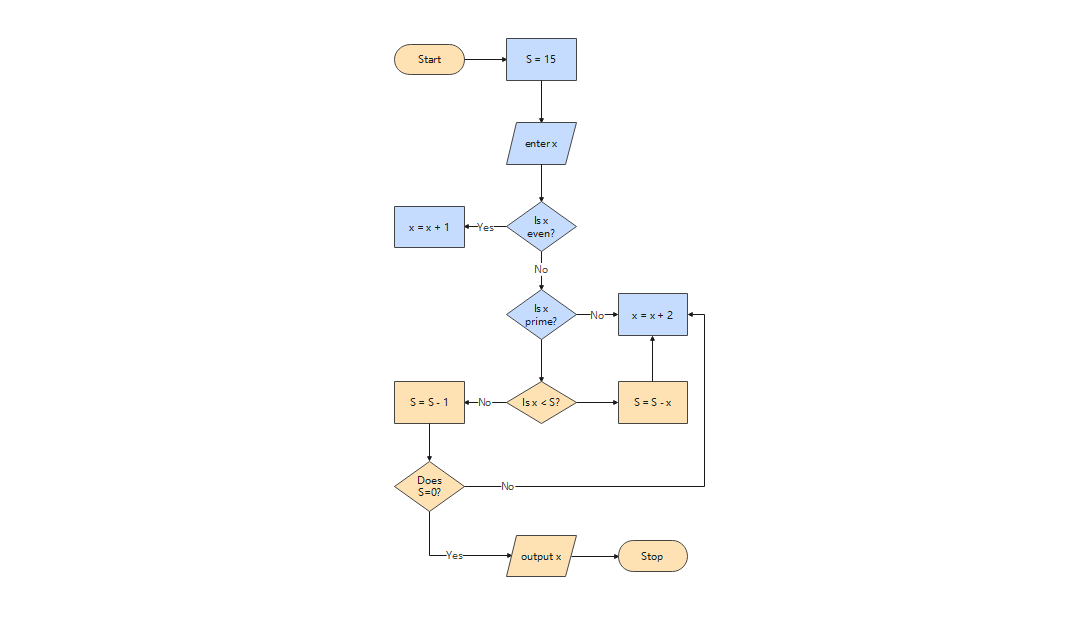
Vertical flowcharts show processes by presenting a top-to-bottom sequence of actions. This format can provide you with a clear visualization of lengthy procedures, making it easier to understand each step in a cascading manner. By aligning tasks vertically, these diagrams enhance comprehension and streamline complex workflows in an organized way.
By Use Case
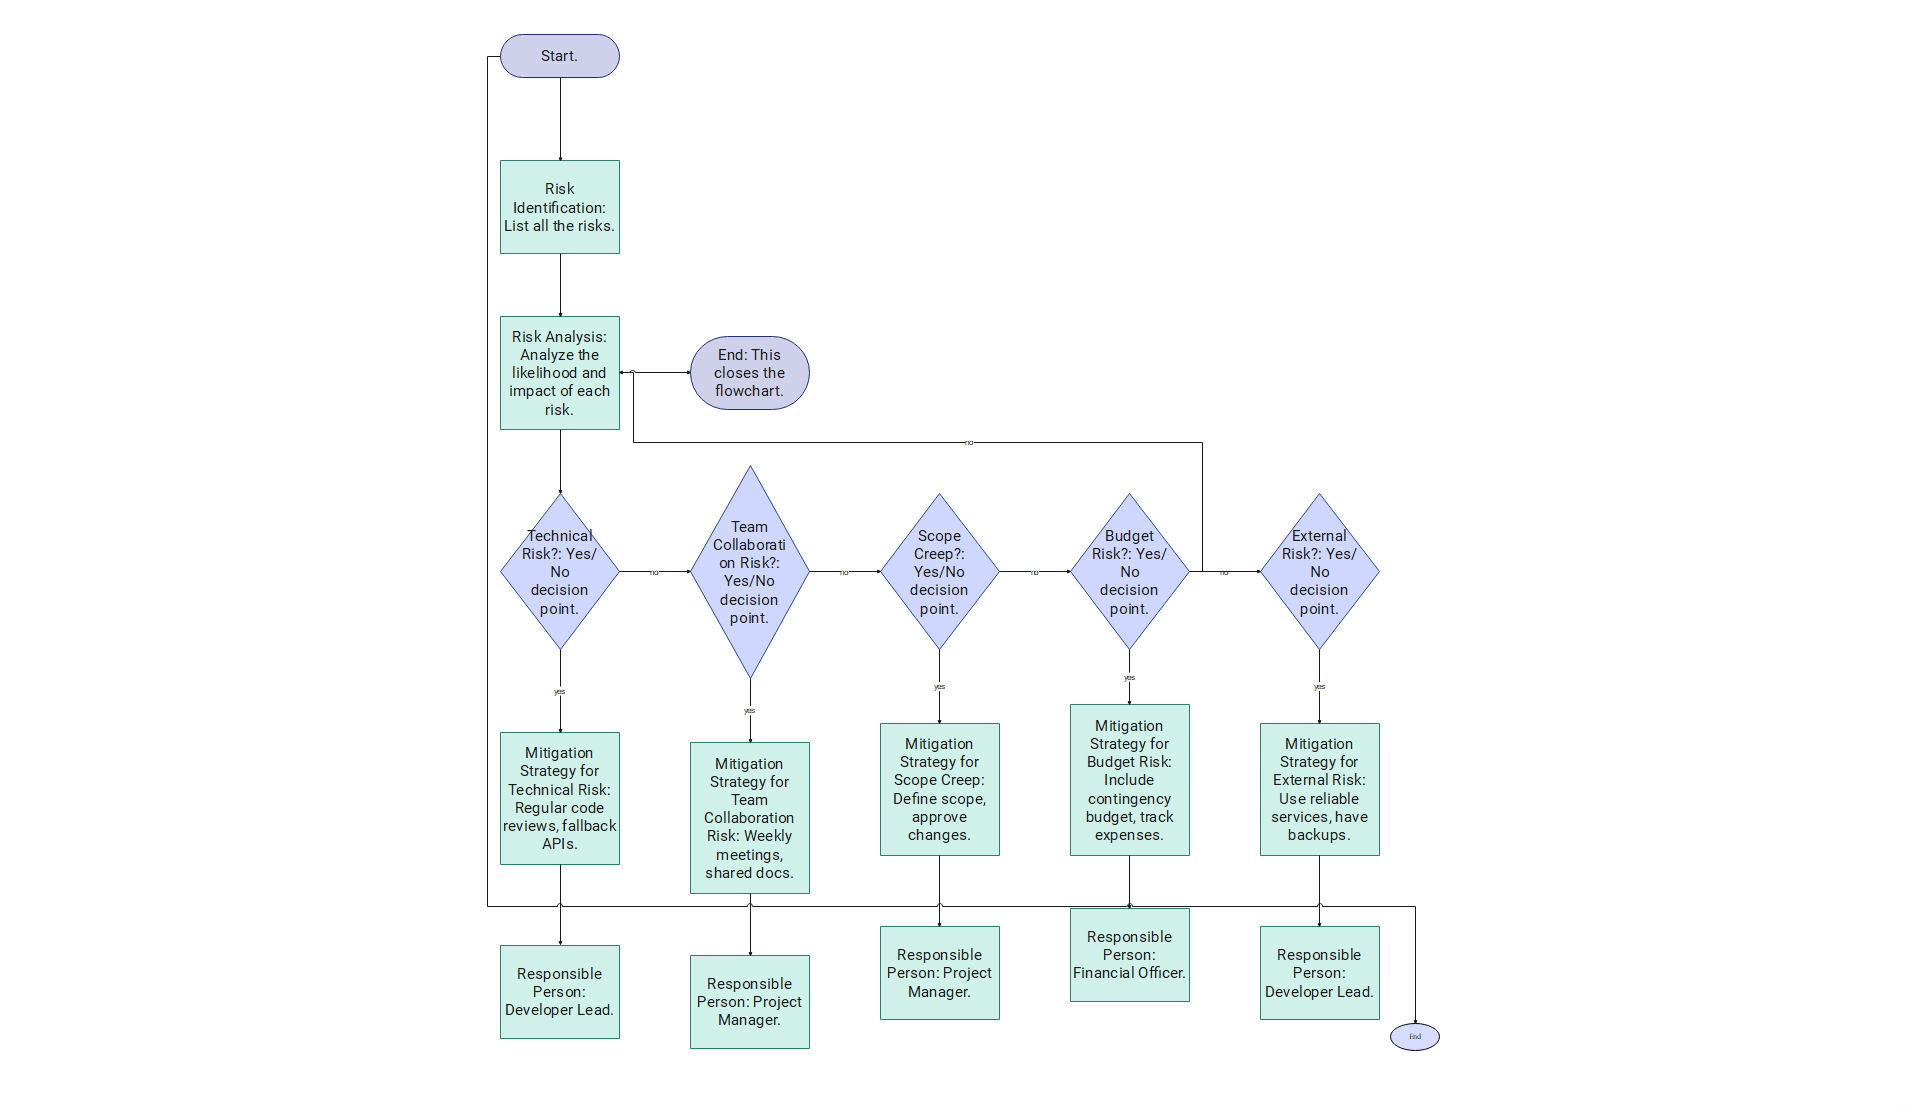
Risk Management Flowchart
A risk assessment flowchart can help you identify and evaluate potential risks within an organization. By visually mapping out the assessment process, these charts can help you manage the risks and ensure smooth operation.
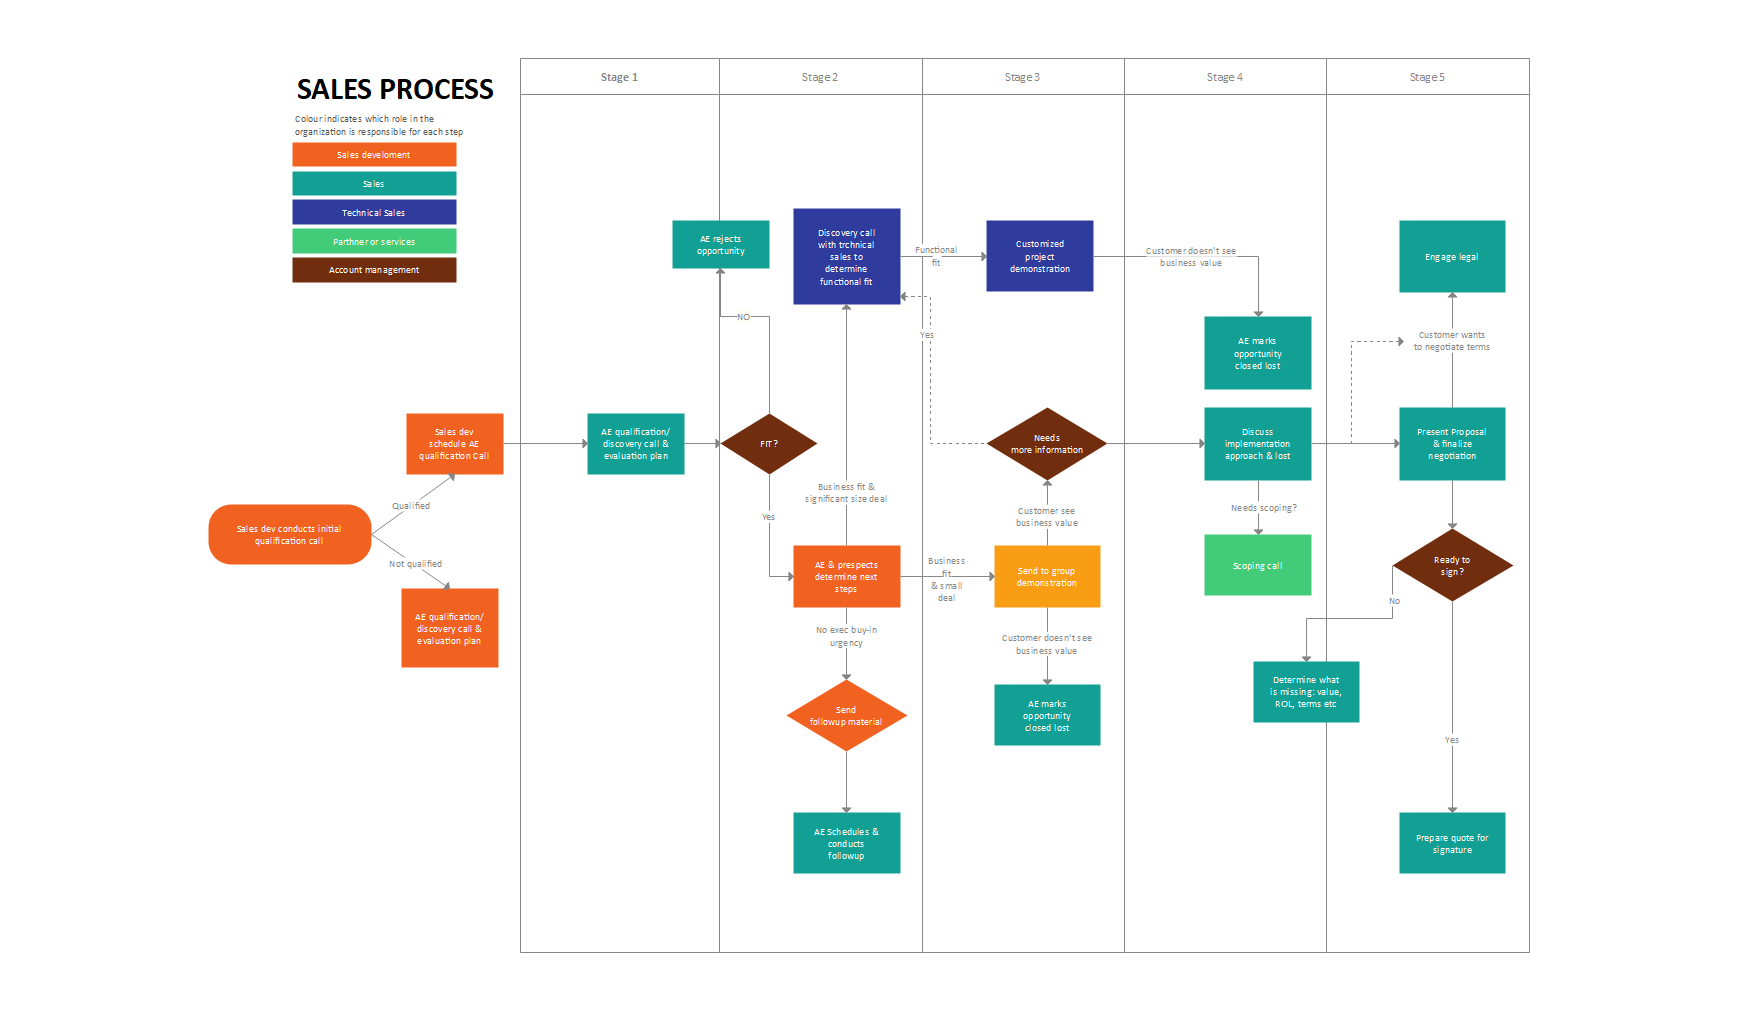
Sales Process Flowchart
A sales process flowchart outlines the entire sequence of actions in generating and qualifying leads. This type of flowchart can help you spot inefficiencies, better use the resources, and provide clarity on team roles. By visualizing the sales journey, organizations can optimize their strategies and increase the success rate when closing deals.
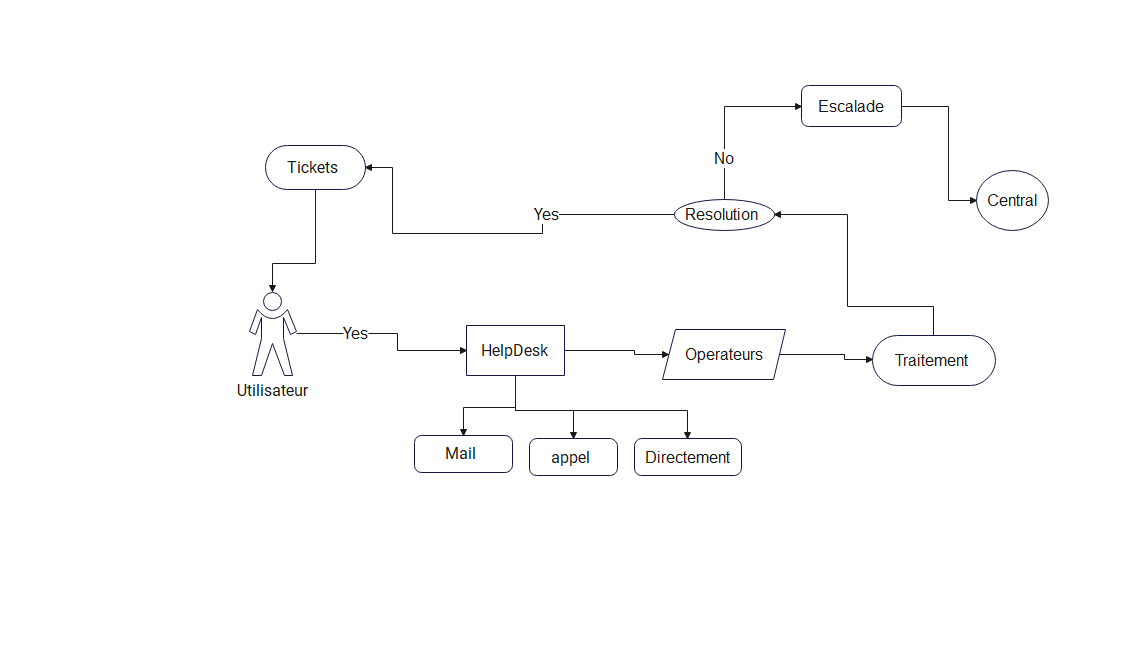
Service Process Flowchart
A customer service flowchart visually maps the stages of the customer service process within a company. By outlining steps from initial requests to ticket resolution, this type of flowchart can enhance team efficiency and improve the overall customer experience. It can also help you facilitate effective communication and manage conflict, ensuring smooth operations and timely resolutions.
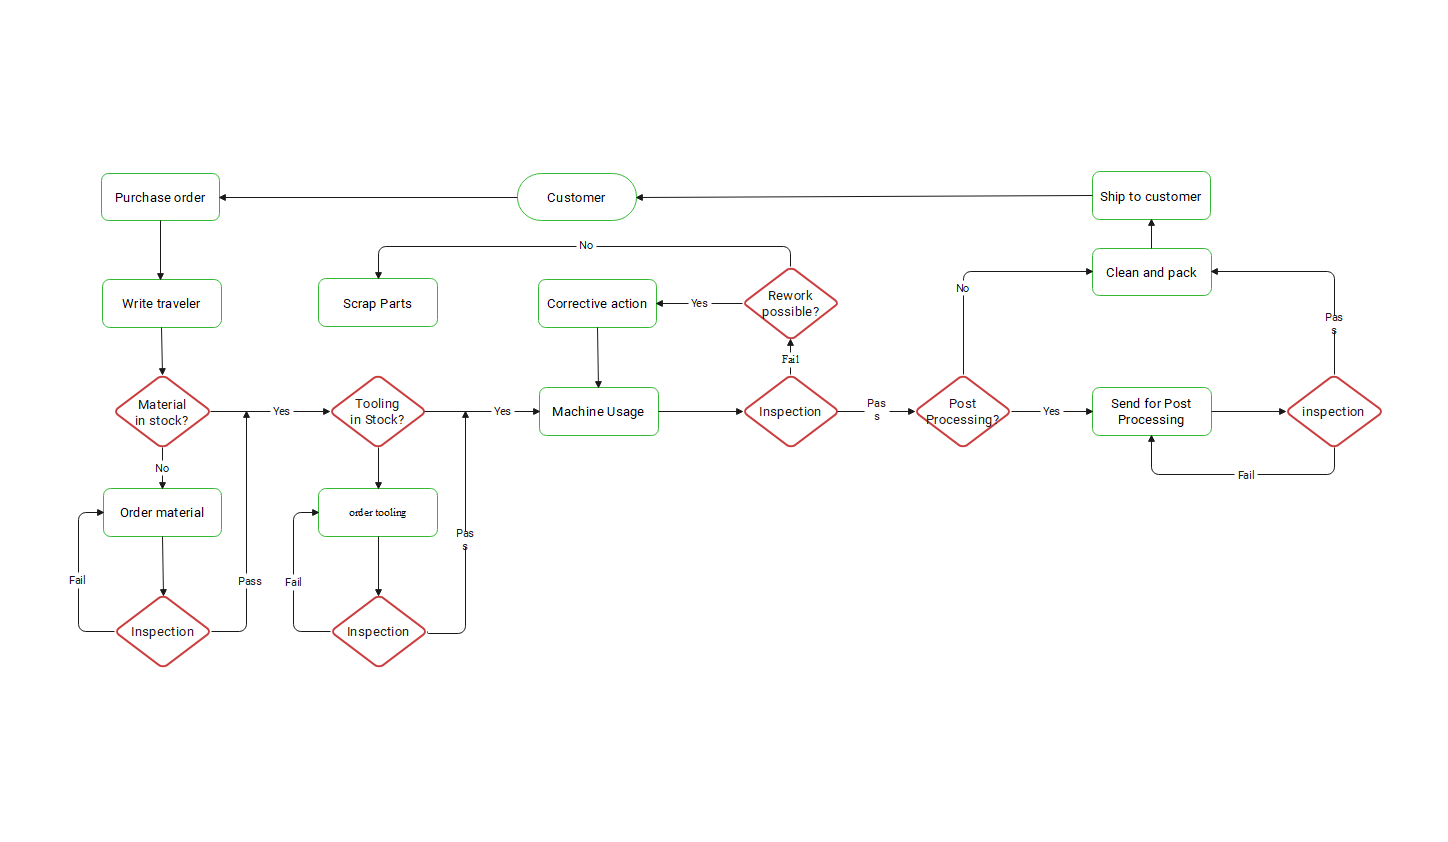
Manufacturing Process Flowchart
The Manufacturing Process Flowchart outlines the detailed steps in manufacturing and shows how raw materials are produced into finished products.
It helps organizations better their operations by adhering to established guidelines and identifying any areas for improvement. This type of flowchart could help managers effectively analyze and optimize the production processes.
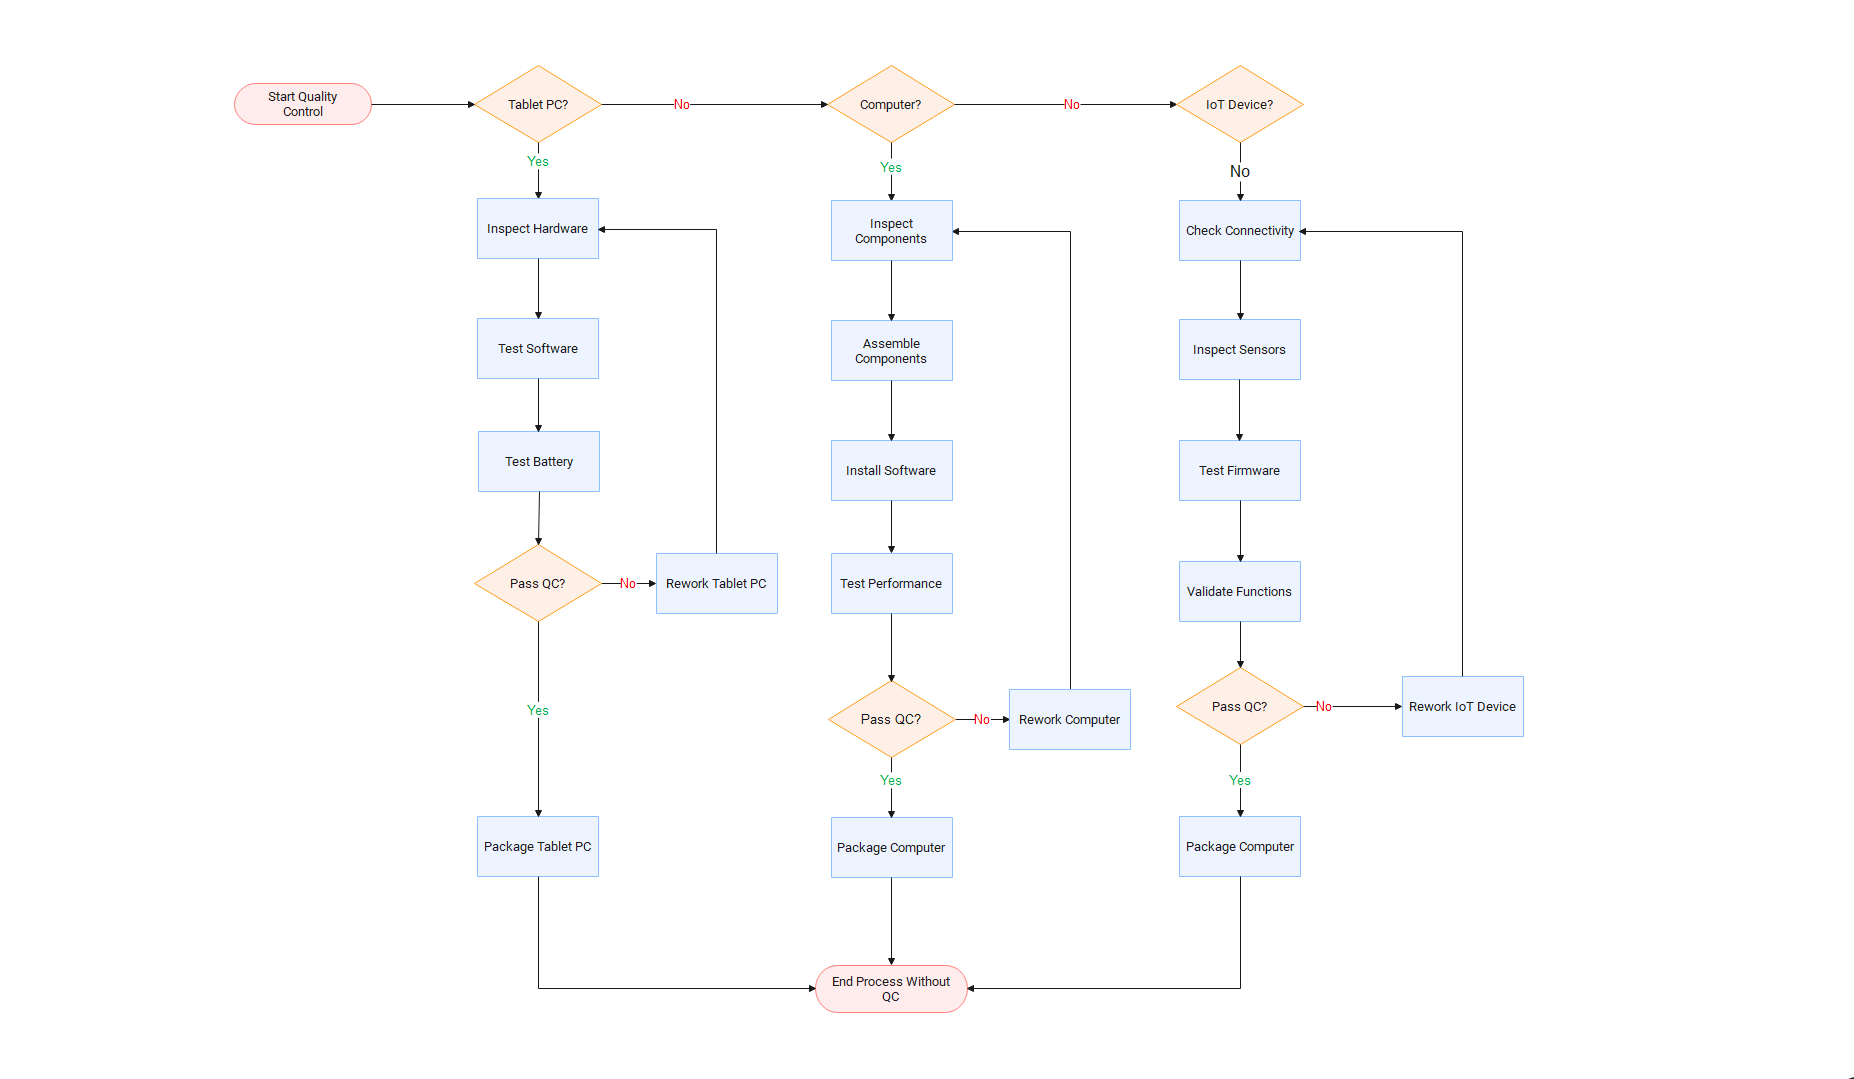
Quality Control Flowchart
The quality control flowchart enhances process efficiency by visually outlining each step. It is like a checklist that ensures everything is done according to the standards to improve product quality. By identifying potential issues early, this type of flowchart will help you save time and resources to maintain high-quality production.
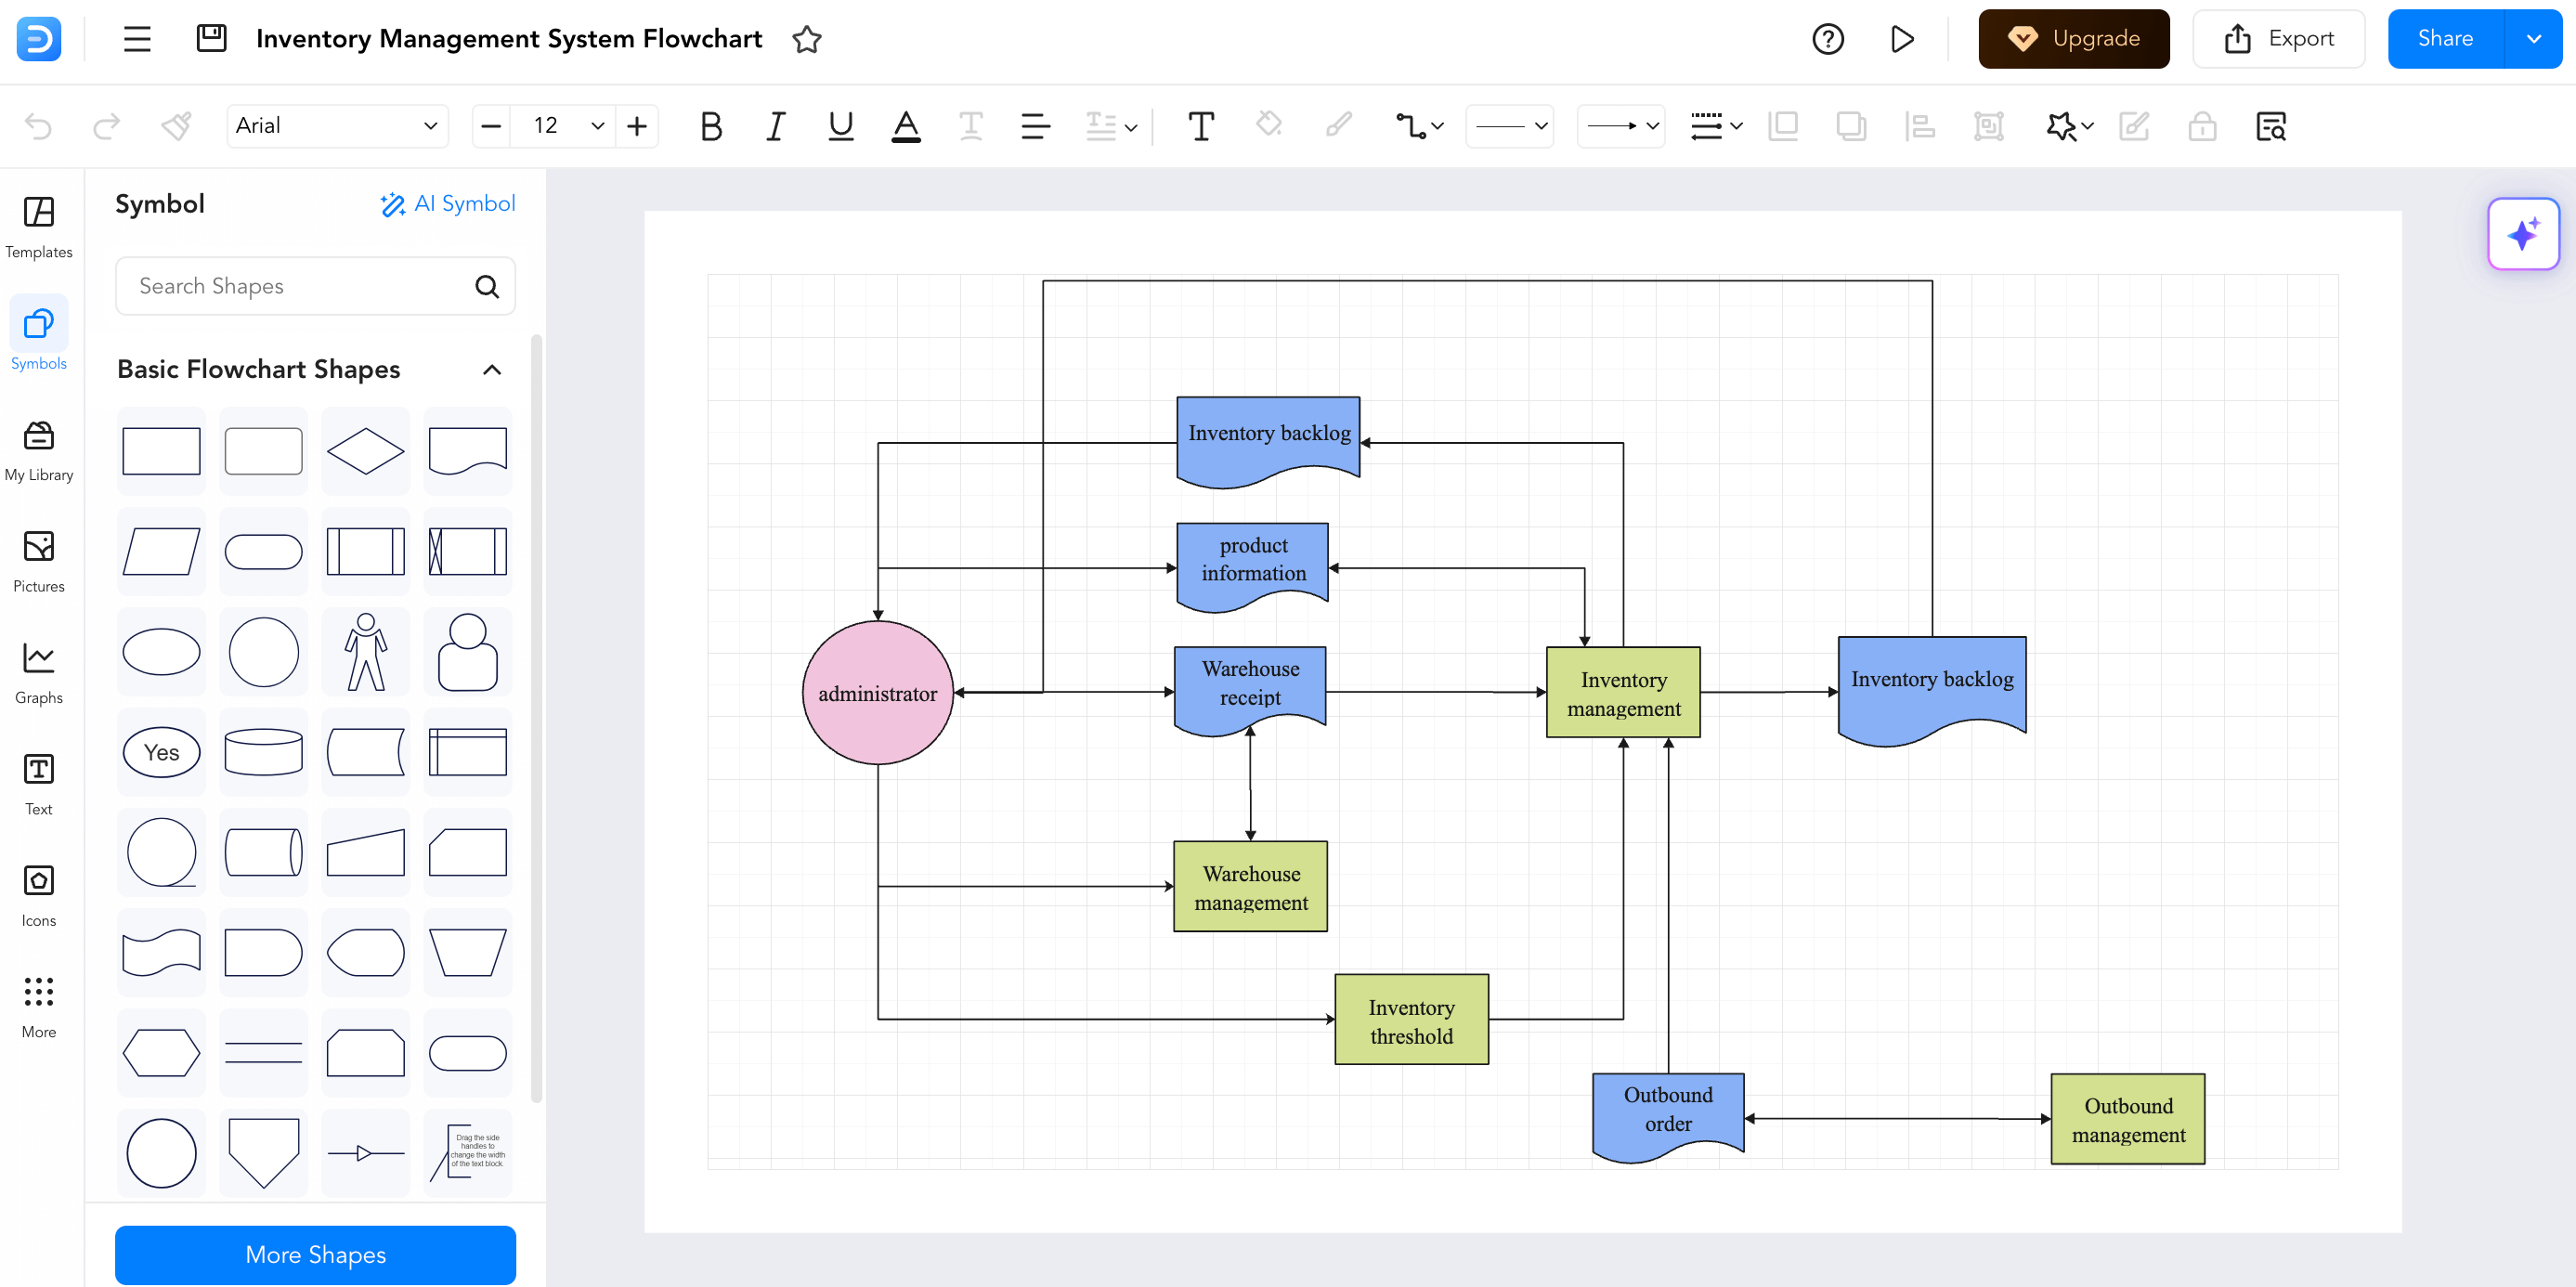
Inventory Management Flowchart
This inventory management flowchart can help companies streamline operations by tracking and managing inventory. It visually simplifies complex processes, ensuring clarity in stock supervision. By using such flowcharts, companies can effectively manage their inventory and minimize costs.
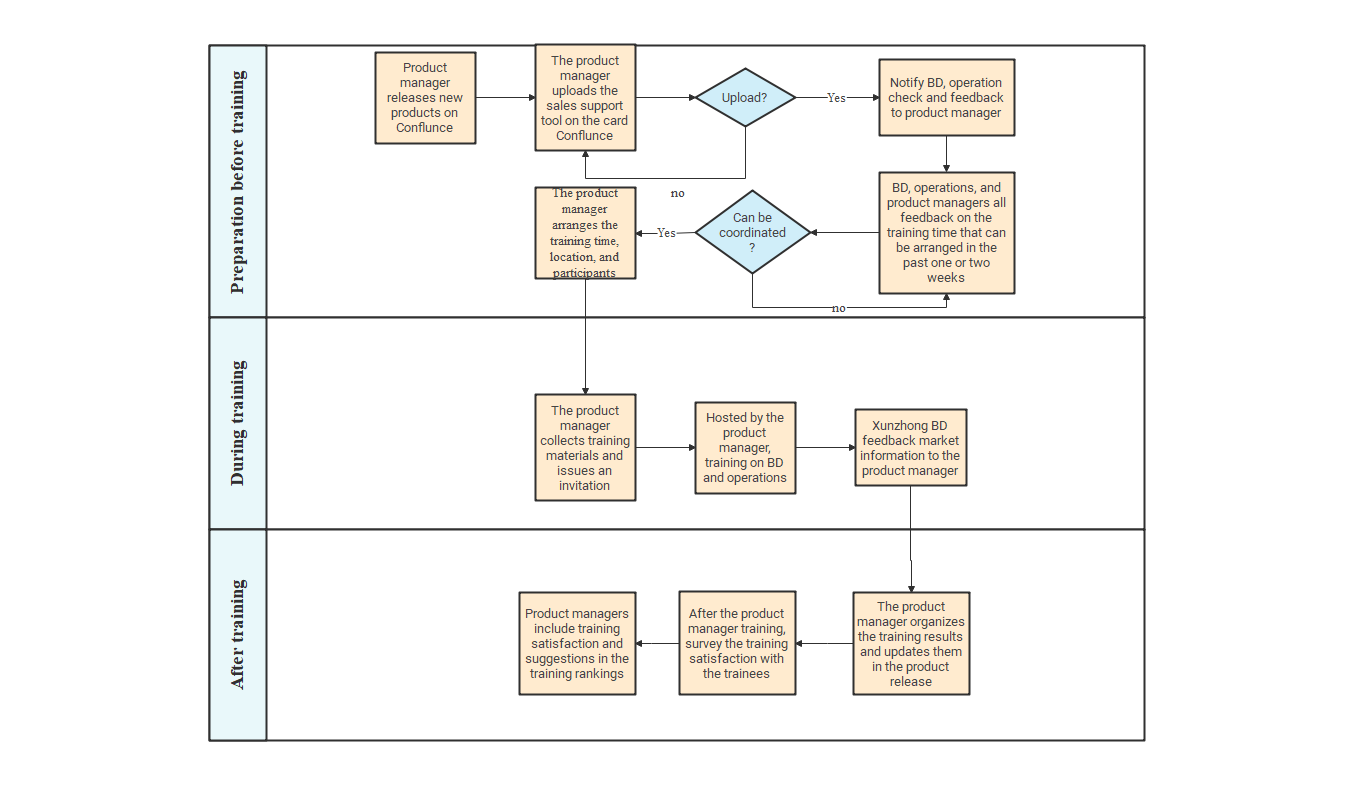
Training Process Flowchart
The training process flowchart outlines the essential steps for developing an effective training program. It usually consists of three phases, the one before, during, and after the training. This type of flowchart can be designed for both internal and external customers to make it easier for them to grasp and follow the training process.
Project Management Flowchart
The project management flowchart visually outlines key stages of a project. This could include initiation, planning, execution, refinement, and closeout. By presenting each step as connected boxes, the flowchart can help users understand and analyze the project process.

Start Flowcharting with Edraw.AI for Free
Now that you’ve learned about all types of flowcharts, it’s time to make a flowchart. Using Edraw.AI, you can make a flowchart of your own within minutes.
This all-in-one visual collaboration platform, powered by AI, allows you to quickly design over 210 types of diagrams using ready-made templates. This helps you to brainstorm, and visualize your ideas effortlessly.
Step 1:
First, go to your browser and open the Edraw.AI website.
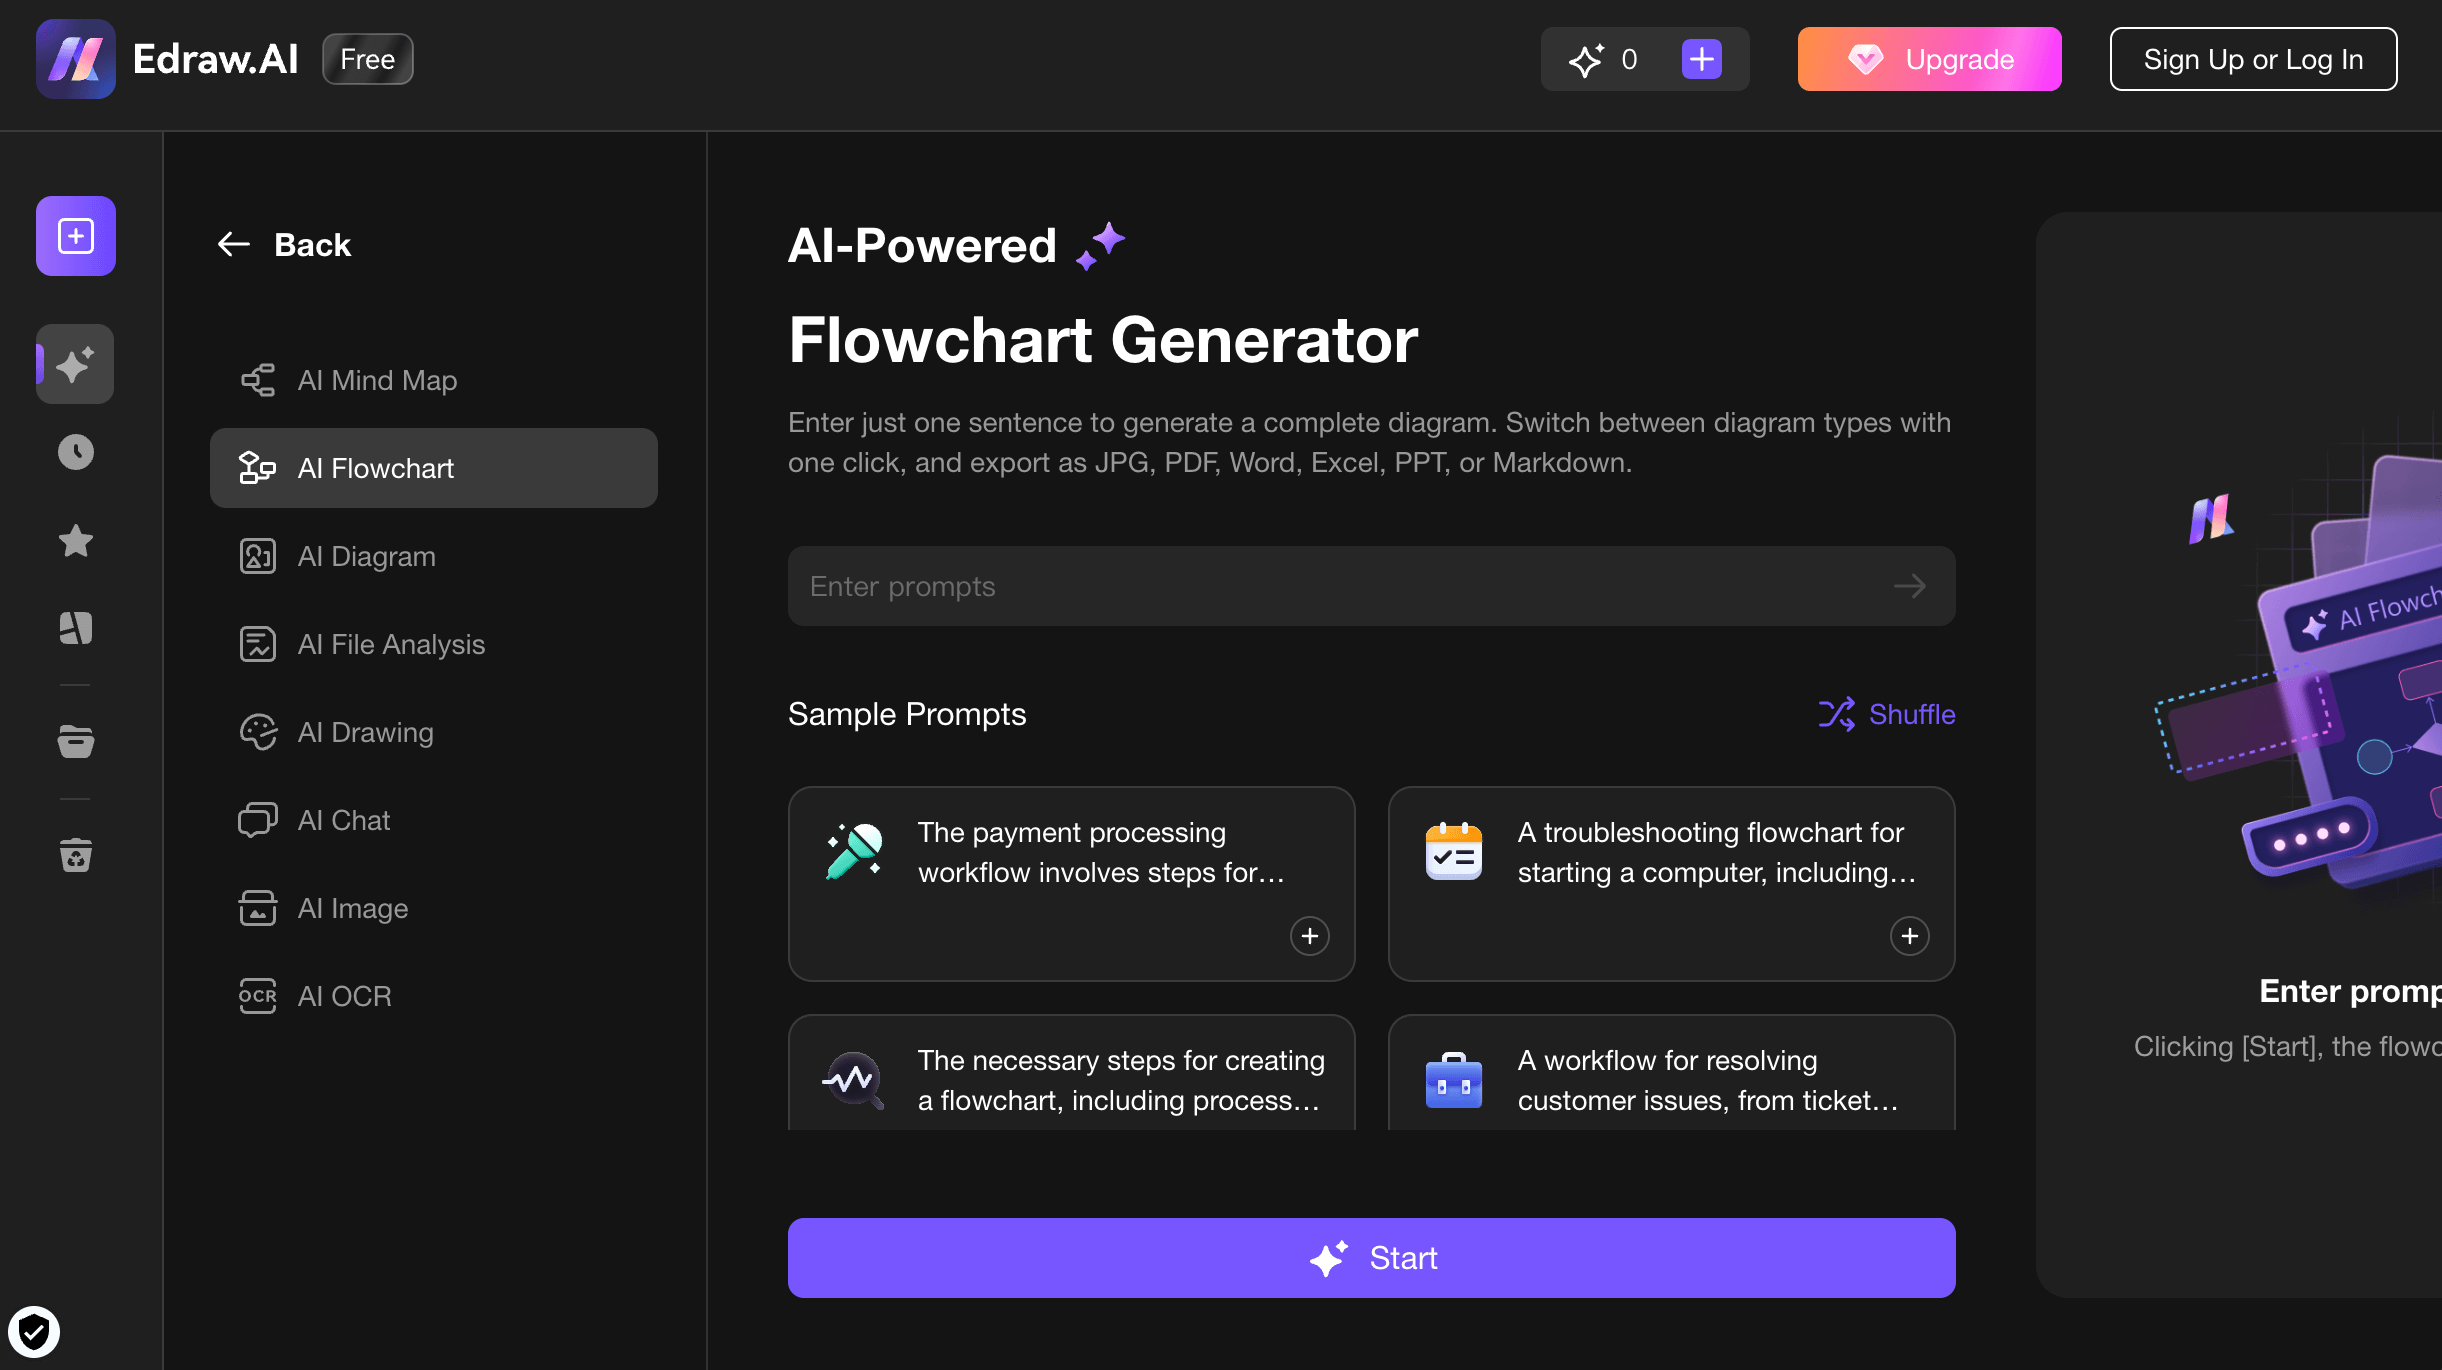
Step 2:
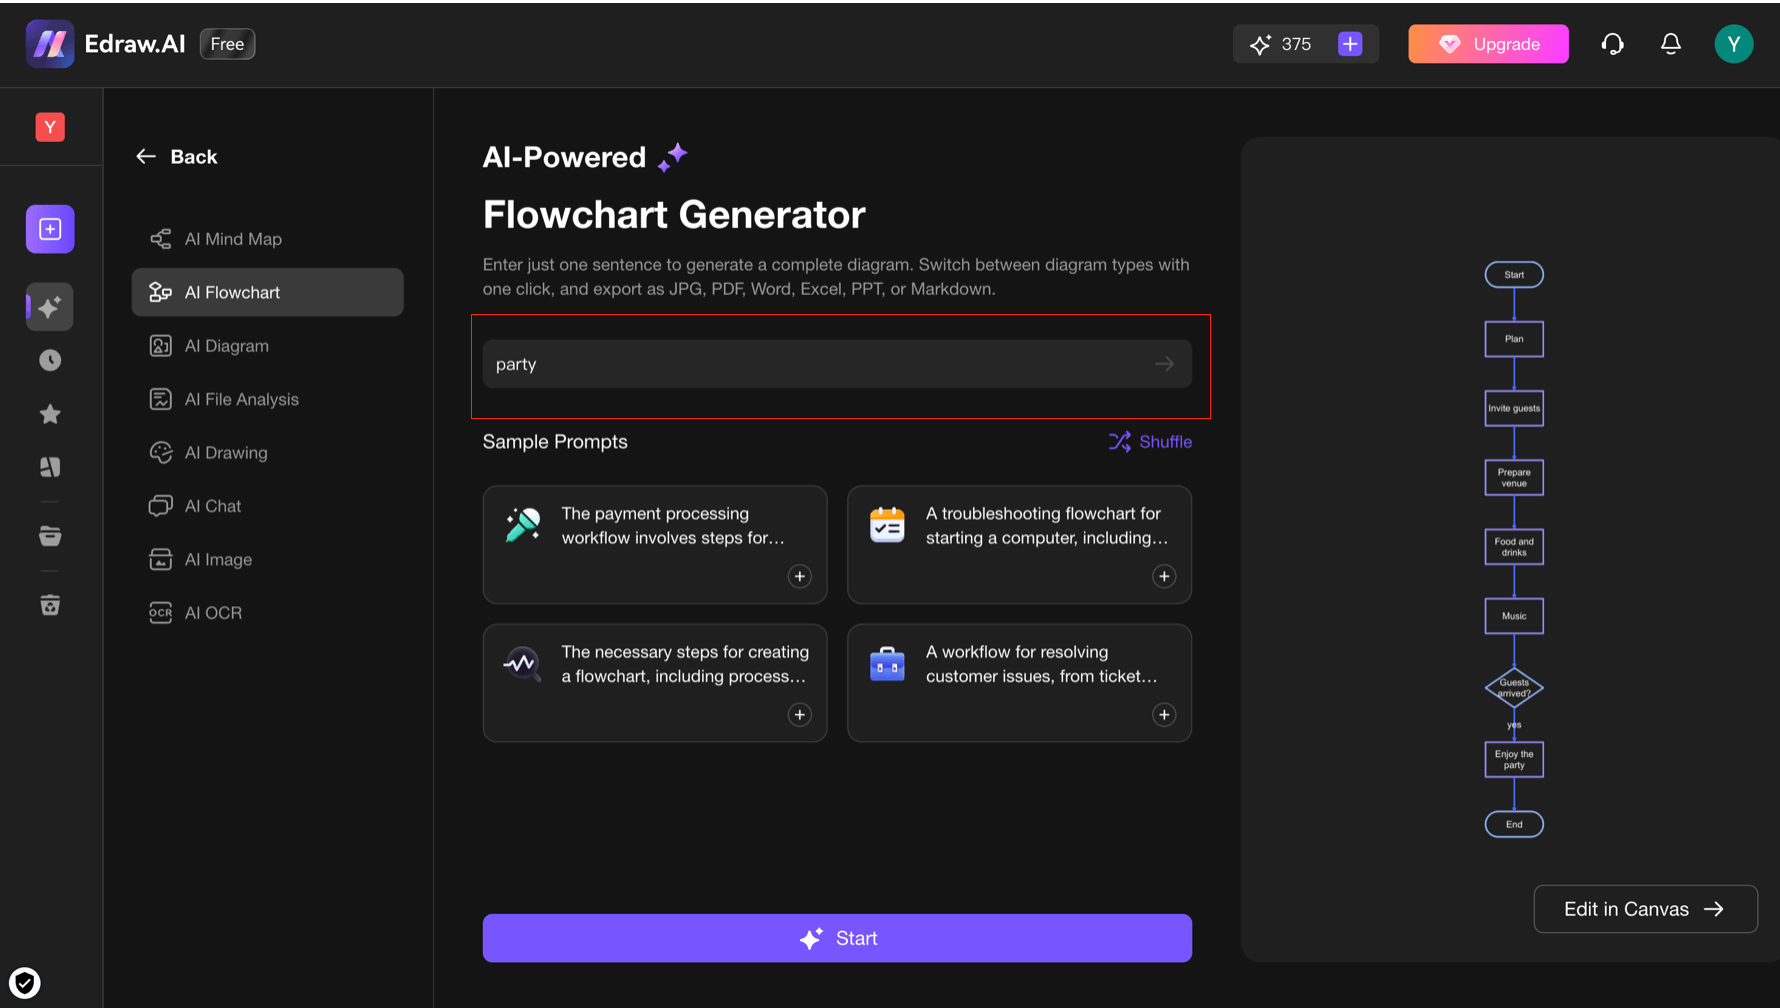
Enter a prompt for the flowchart you want to create. This could either be a keyword of your project or some detailed descriptions, such as “The payment processing workflow involves steps for current and new customers, including approvals for non-US customers.” The website will offer you sample prompts to get inspiration.
Step 3:
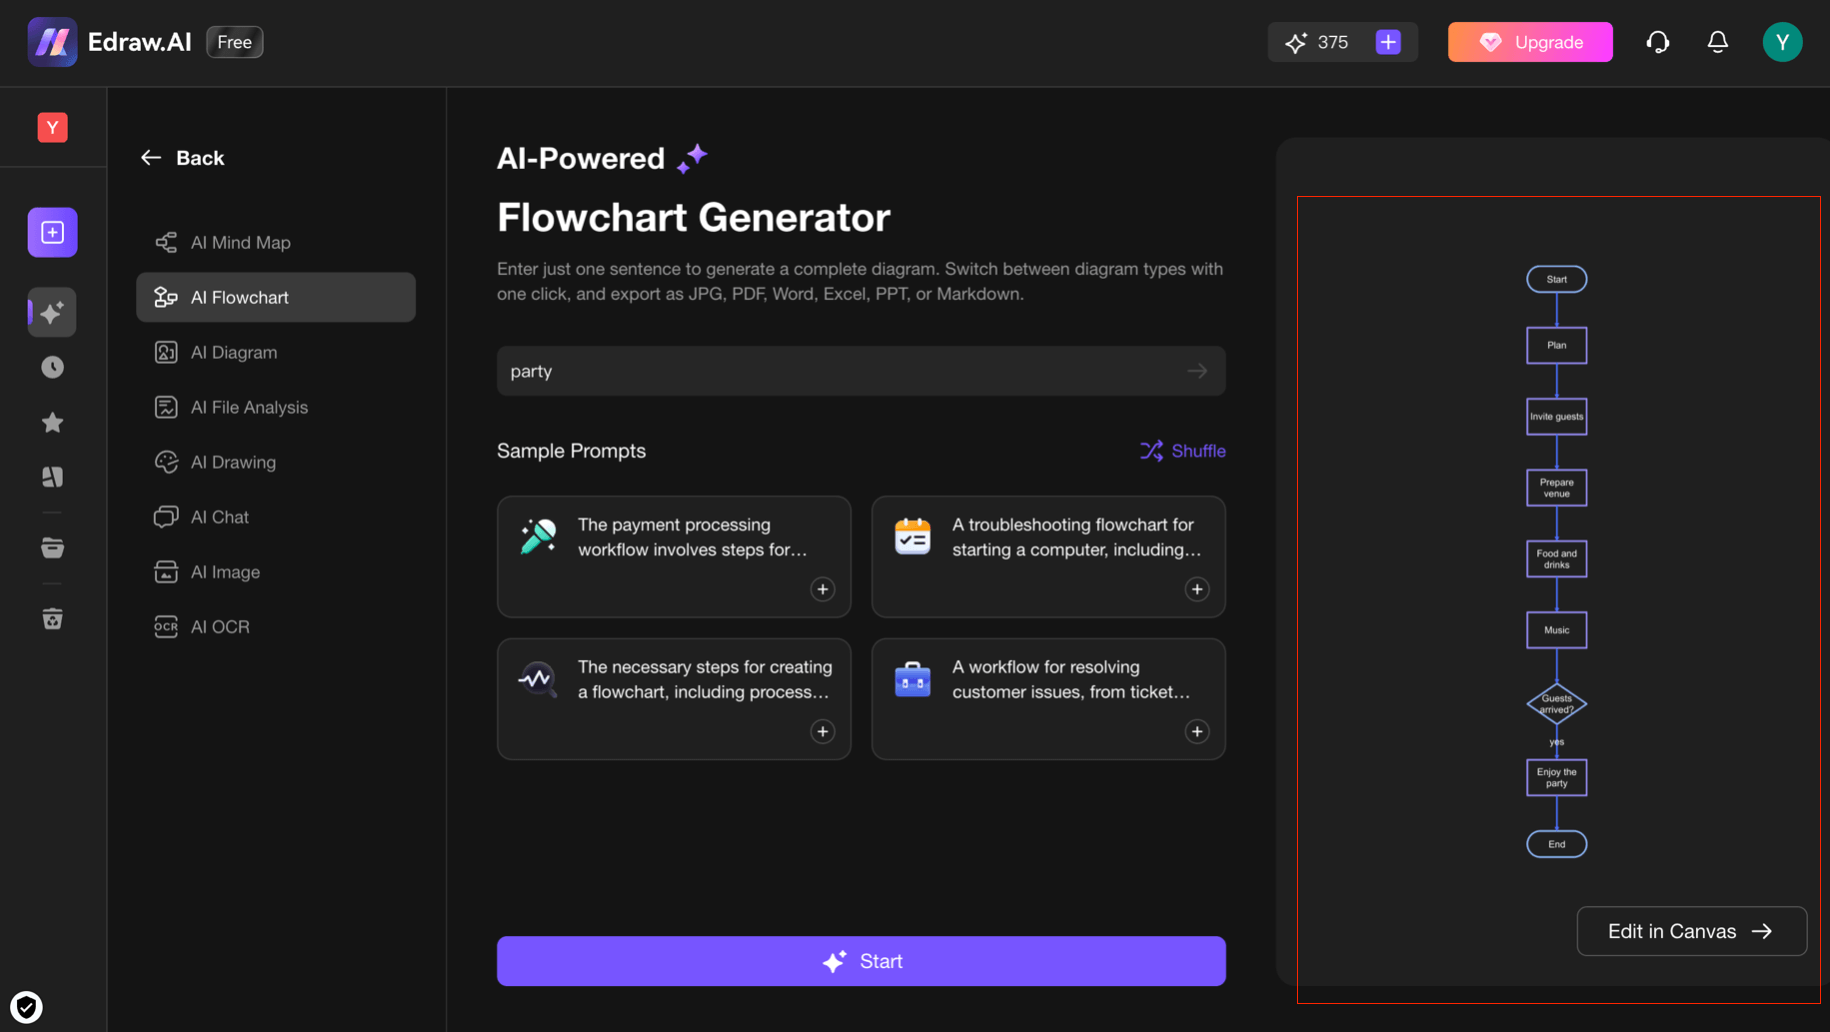
The AI will automatically generate a flowchart based on your description,. You can find this in the lower right corner of the workspace.
Step 3:
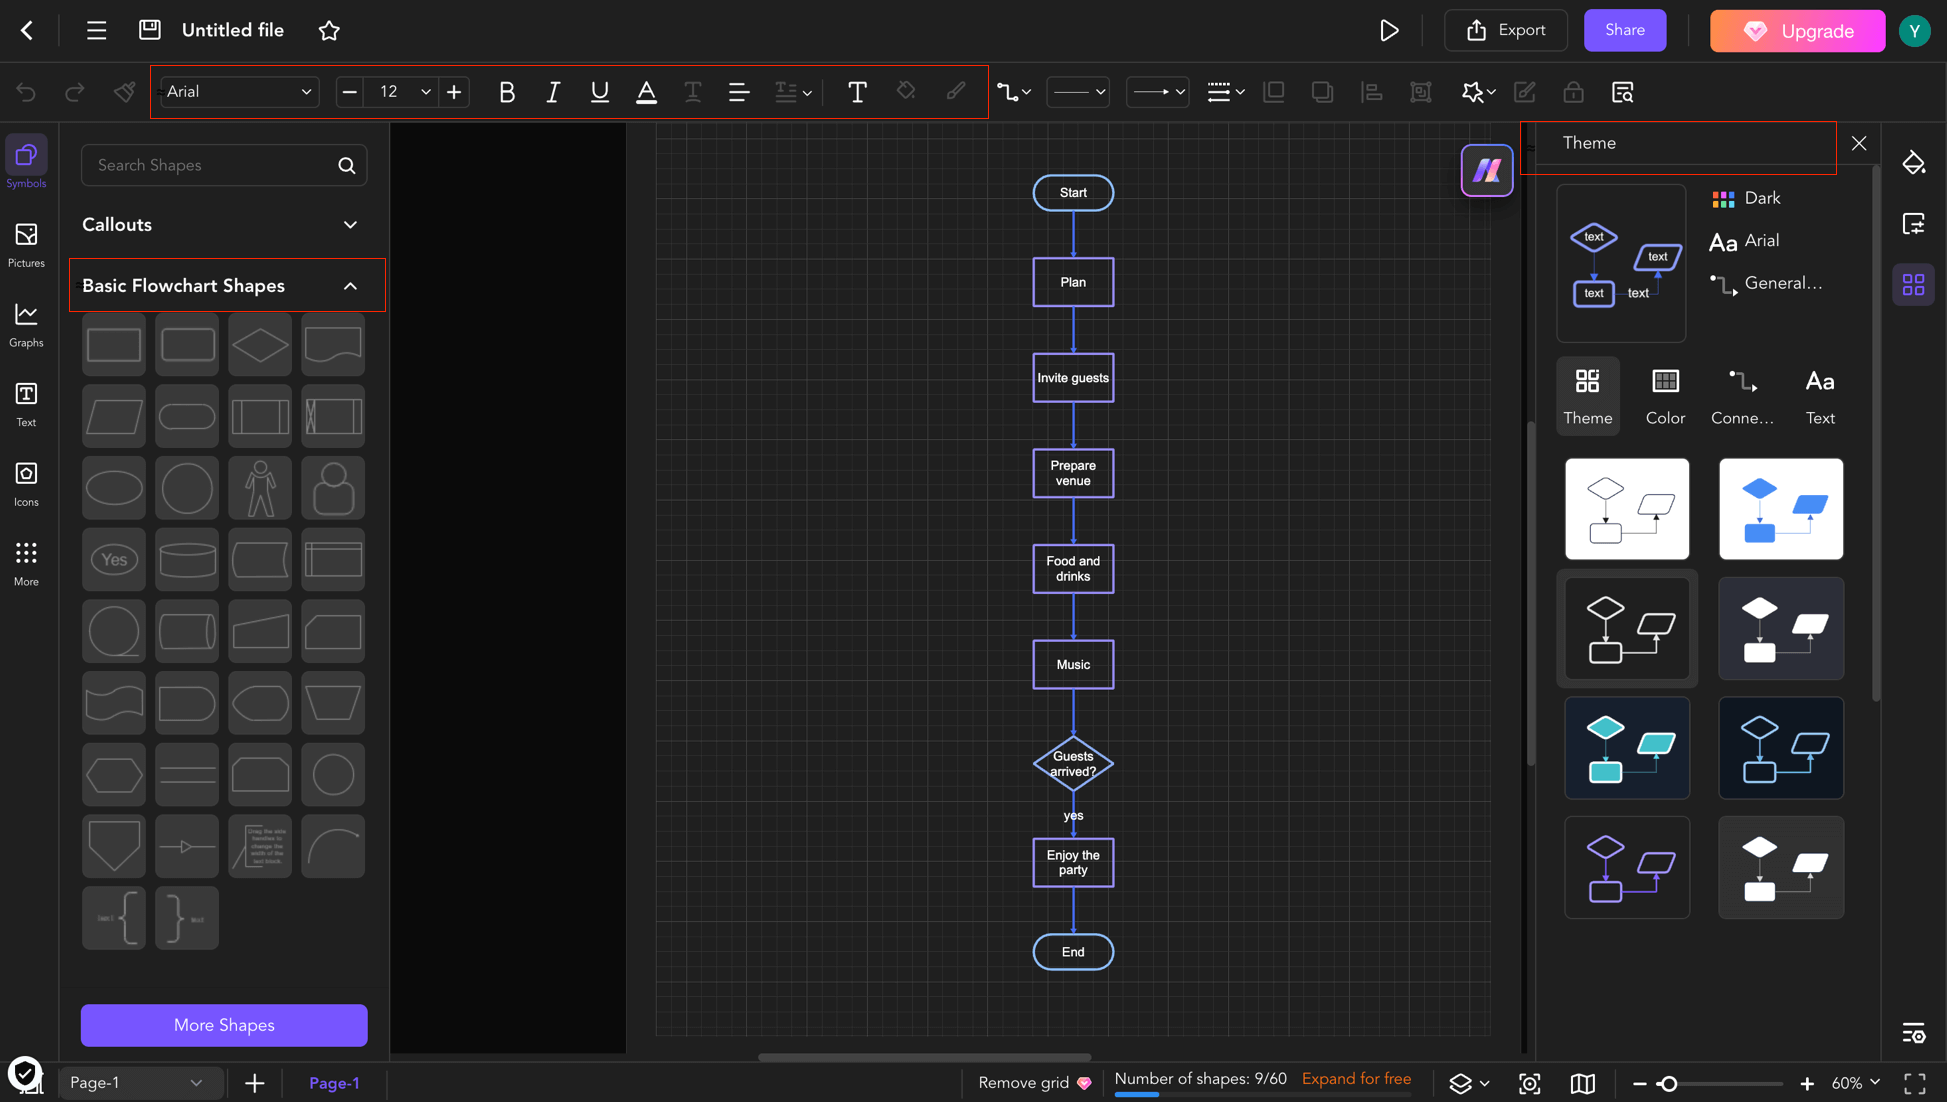
You can then easily customize the flowchart by editing the content, changing fonts, adjusting basic shapes, and selecting different themes to match your style.
Step 4:
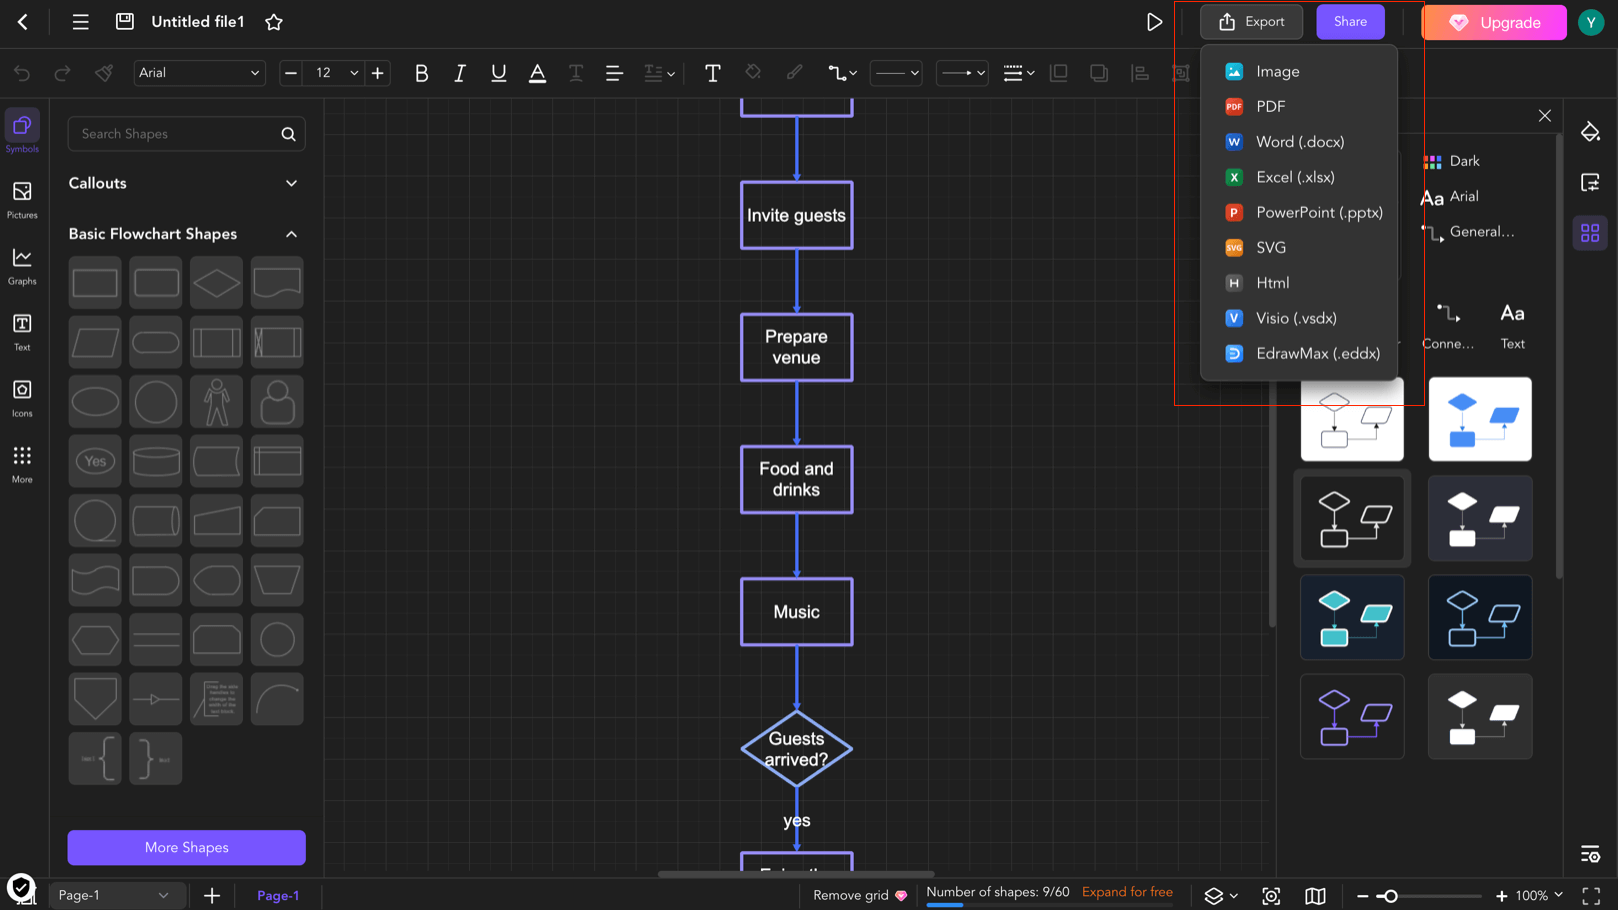
Once you’re satisfied with the design, you can export the flowchart in various formats, including image, PDF, Word, or Excel, and easily share your work with others.
Step 5:
The platform also offers a wide variety of templates to help you complete your tasks, providing a strong starting point and saving you time in the process.
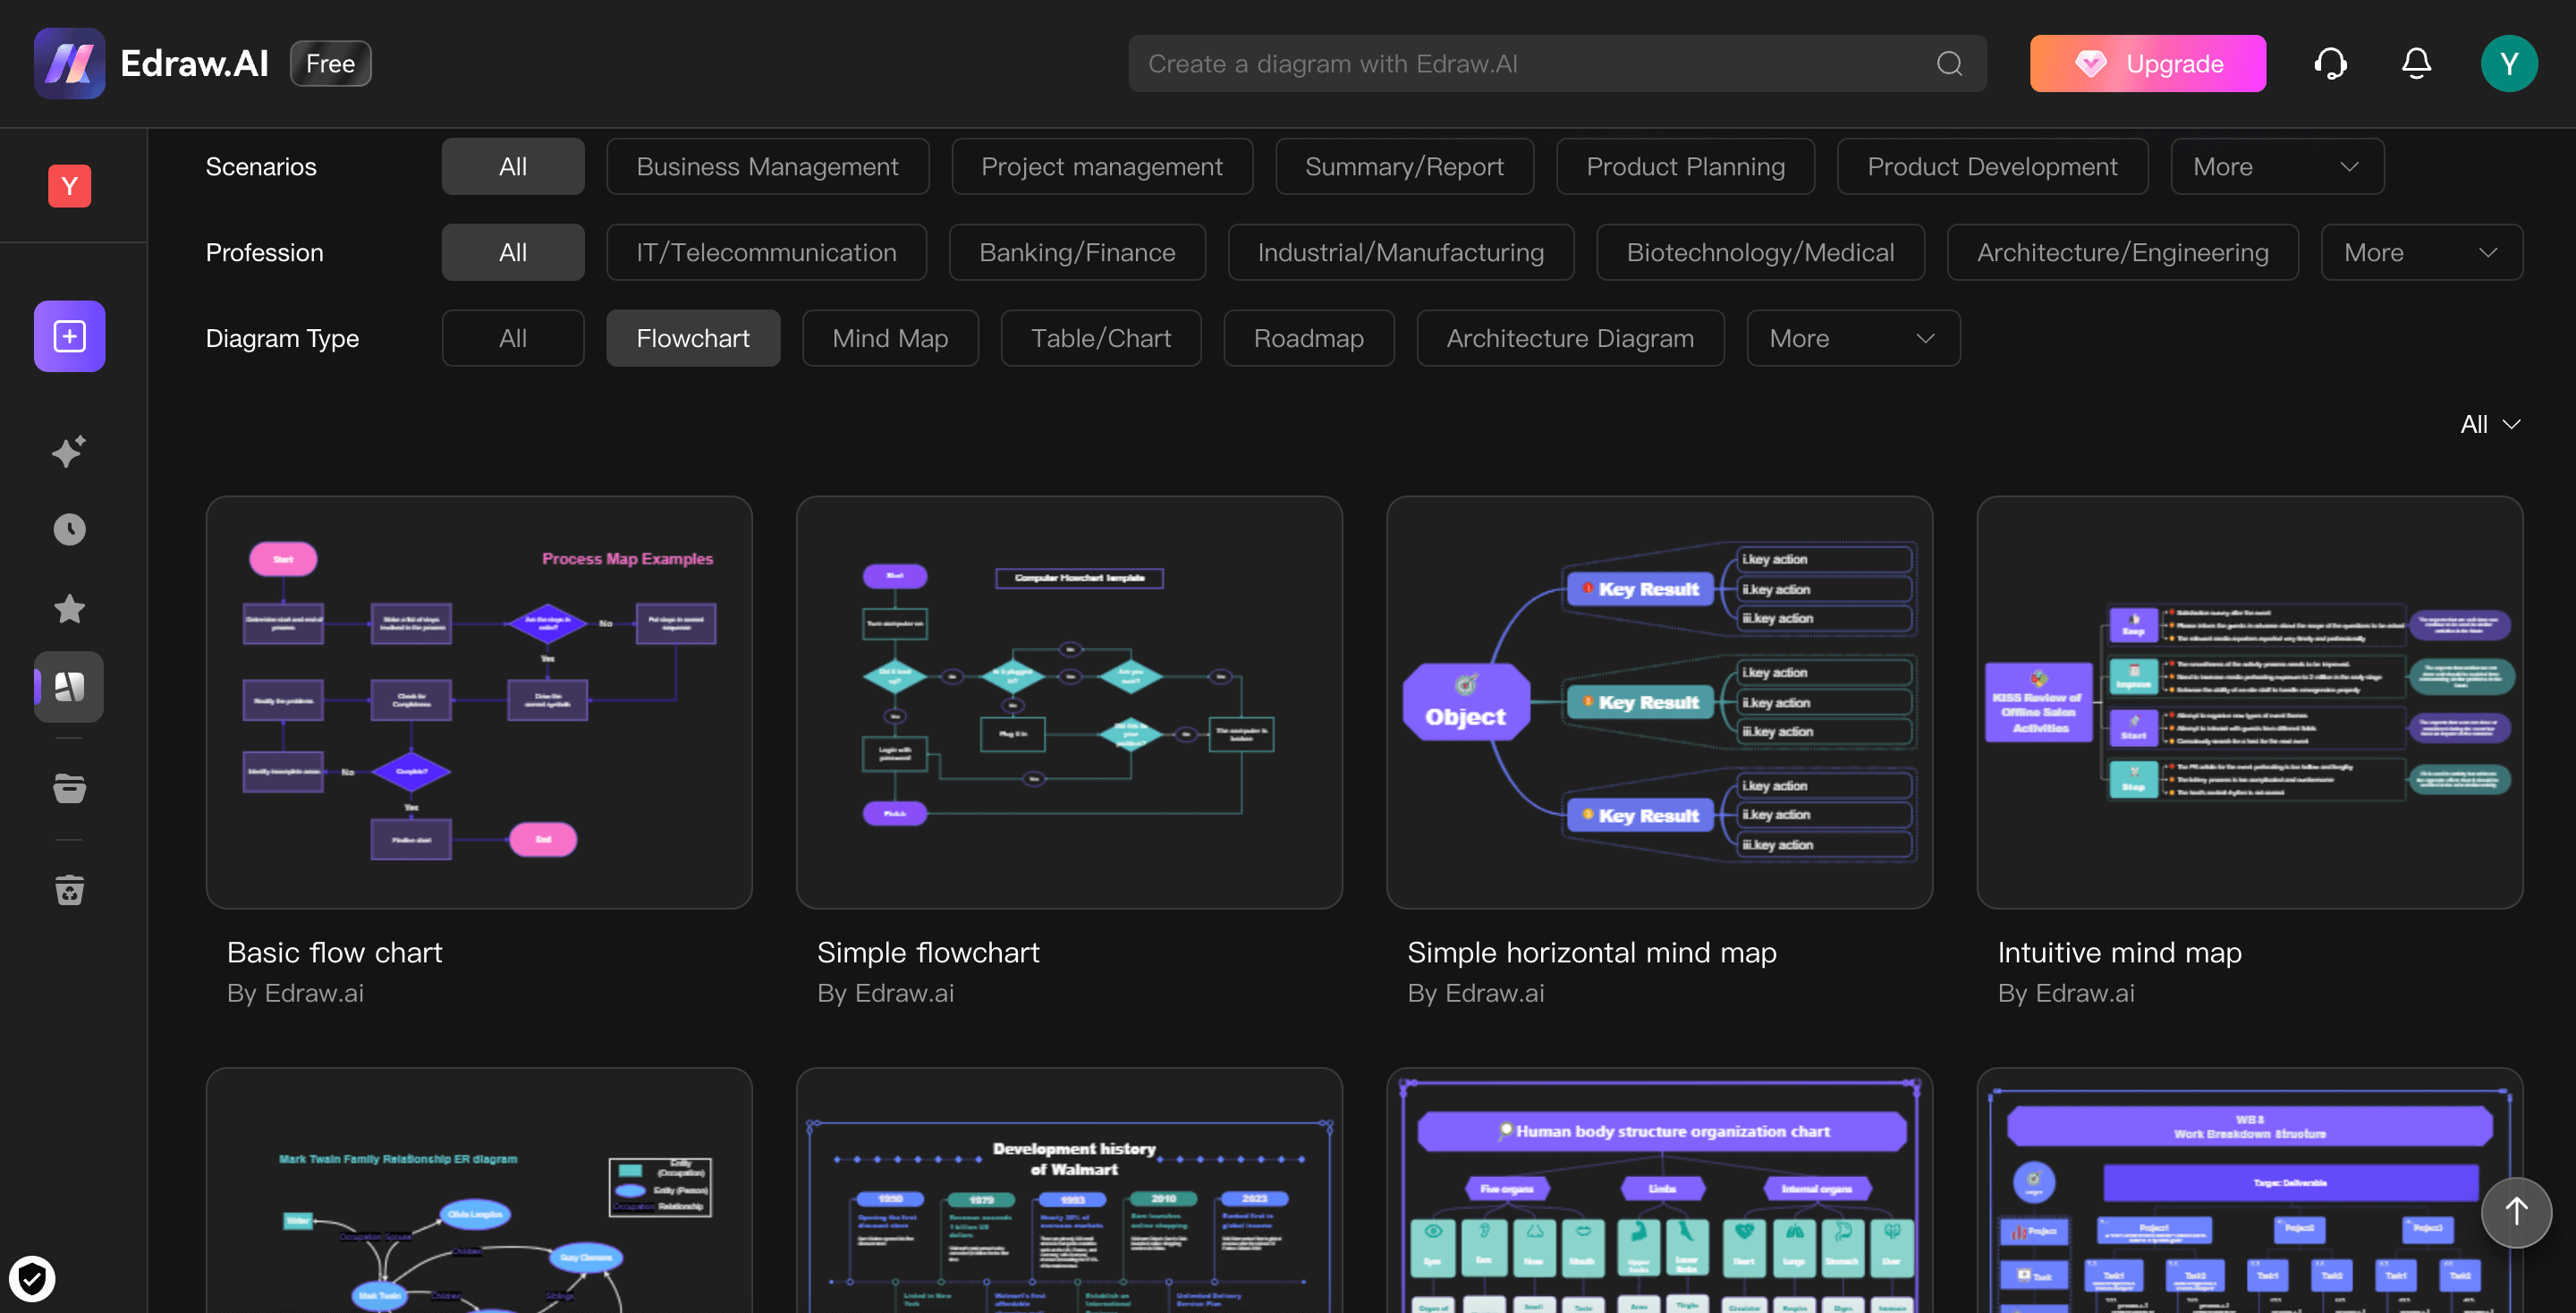
Using Edraw.AI makes creating flowcharts incredibly simple and efficient. The AI-generated features mean that you no longer need to start from scratch. Instead, it will provide you with a foundational template that you can easily modify and refine, significantly boosting your productivity.
With a vast selection of templates and customization options, it also caters to your personal aesthetic preferences. Whether you’re working on a simple diagram or a complex workflow, Edraw.AI would be a pretty perfect place to start.

Try Our Products
Now for Free
