Making complex information simple is a skill I’ve honed over the years. While working on a recent project, I struggled to explain a software feature that depended on user choices. Writing it out in text felt cluttered and hard to follow.
Then, I tried a conditional flowchart, using decision points and branches to map the process visually. The result was far easier to understand. It proved they can be valuable for making information accessible.
In this article
So, in this write-up, I’ll walk you through what is a conditional flowchart with examples and show how Edraw.AI simplifies creating them.
What Is a Conditional Flowchart?
A conditional flowchart simplifies decision-making processes by mapping actions based on conditions. It uses symbols like diamonds to represent decision points, creating a visual guide that outlines steps and outcomes. This type of flowchart is best for showing if-then scenarios.
The diamond-shaped decision symbol is where conditions are evaluated. From here, paths branch—typically yes or no. For instance, in debugging software, a flowchart might check for errors. If an error exists, the chart directs you to fix it otherwise it resumes to the next step.
The flowchart eliminates confusion by turning complex workflows into step-by-step visuals. For example, a customer support flowchart might ask: Is the issue fixed? If yes, the process ends. If not, it escalates to the next stage until it’s fixed.
Conditional flowcharts have diverse applications:
- Programmers use them to visualize algorithms.
- Businesses rely on them for workflows like approvals or troubleshooting.
- Educators and students use them to break down complex topics into simple steps.
5 Conditional Flowchart Examples
1. Motor Conditional Flowchart
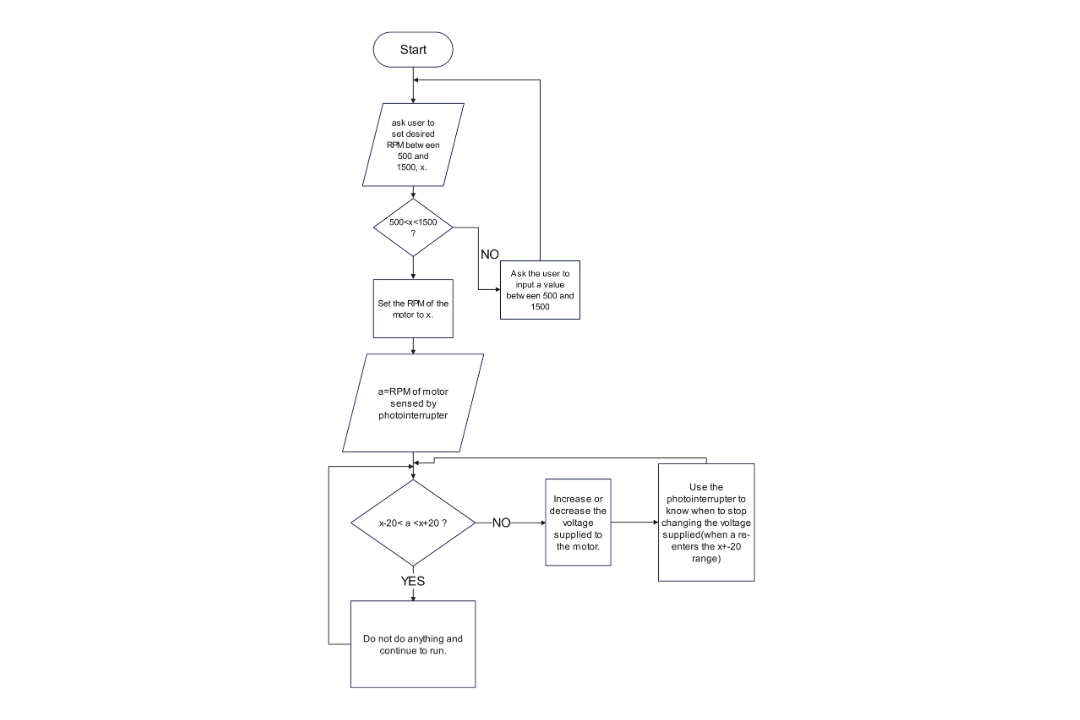
This flowchart controls motor RPM using user input and real-time feedback. A sensor measures the actual speed after the user enters an RPM (500–1500). If the sensed RPM differs by more than +/- 20, the system adjusts the voltage to stabilize it. This loop repeats until the motor’s RPM is within range.
Its clear shapes and flow make it ideal for representing feedback-driven systems. This design is perfect for control systems in robotics, automation, or household appliances. Engineers can validate system behavior and performance by mapping the logic visually.
2. Condition Flowchart Template
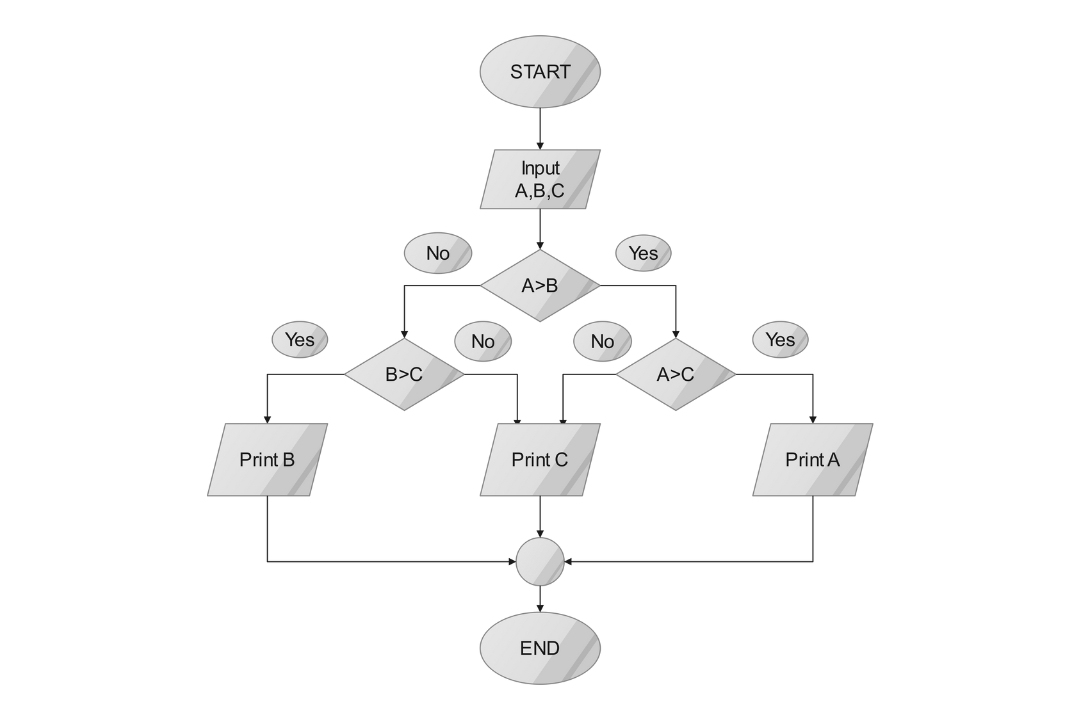
This flowchart is a simple algorithm for finding the largest number between A, B, and C. It compares A with B and then with C to identify the largest after user input. If A is larger than both, it’s the largest. Otherwise, B and C are compared.
The clear top-down structure, with decision diamonds and action boxes, makes it easy to understand. It's a good model for teaching conditional logic or designing basic decision algorithms.
3. UAV Drone Conditional Flowchart
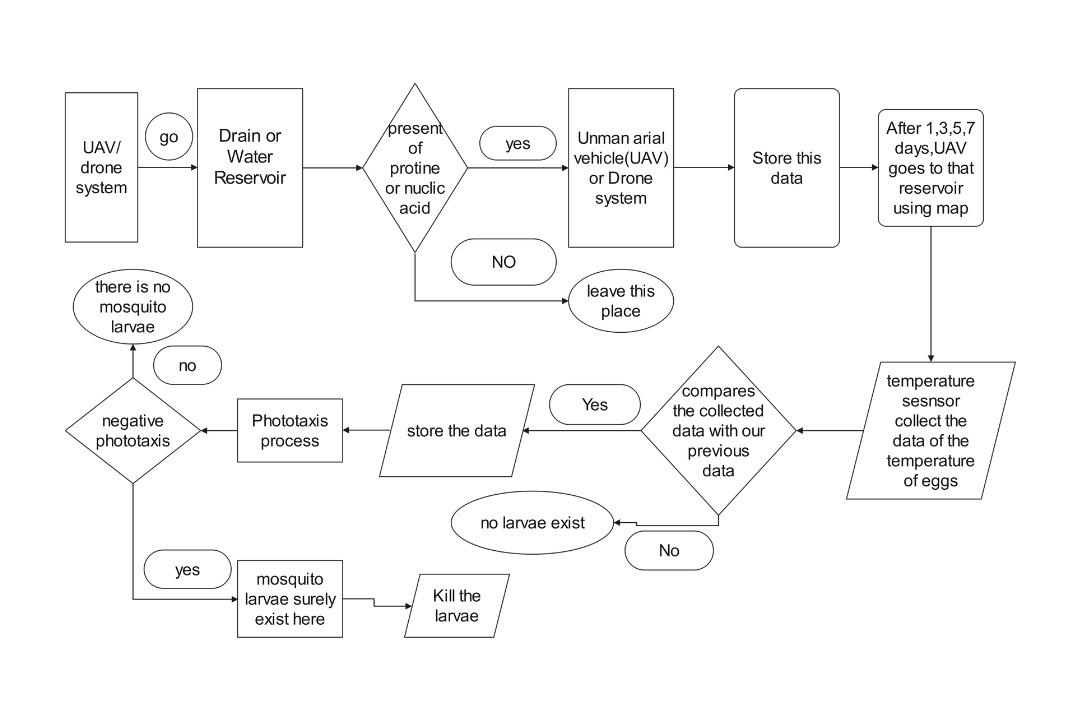
This template illustrates how conditional flowcharts can represent automated systems for mosquito control or environmental monitoring.
It shows the UAV going to a water reservoir and checking for protein or nucleic acids, signaling potential larvae. If detected, the UAV starts a phototaxis process, perhaps using light to control the larvae. If larvae are present, they are killed; if not, the UAV leaves.
The UAV also monitors egg temperatures, comparing them to previous data. After a set time, it returns for continued monitoring.
With clear steps and labels, its intuitive layout simplifies understanding of the automated actions of UAVs.
4. Conditional Flowchart for Lottery System
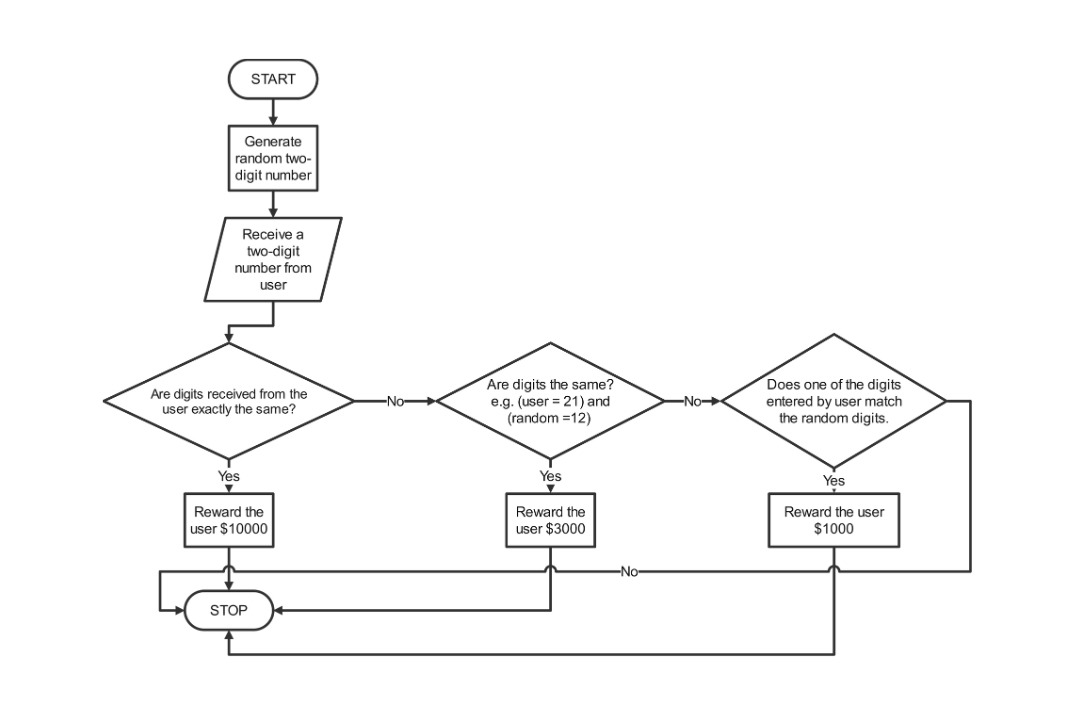
This simple lottery system flowchart starts with generating a random two-digit number and receiving the user’s input. It first checks for an exact match, awarding $10,000 if true.
Next, it checks if the digits are reversed for a $3,000 prize. A single matching digit earns $1,000. If every condition fails, no reward is given.
The flowchart’s clear layout with clear decision points makes it effortless to comprehend. It can be used for various games of chance or decision-making scenarios with multiple possible outcomes.
5. Data Analysis Conditional Flowchart
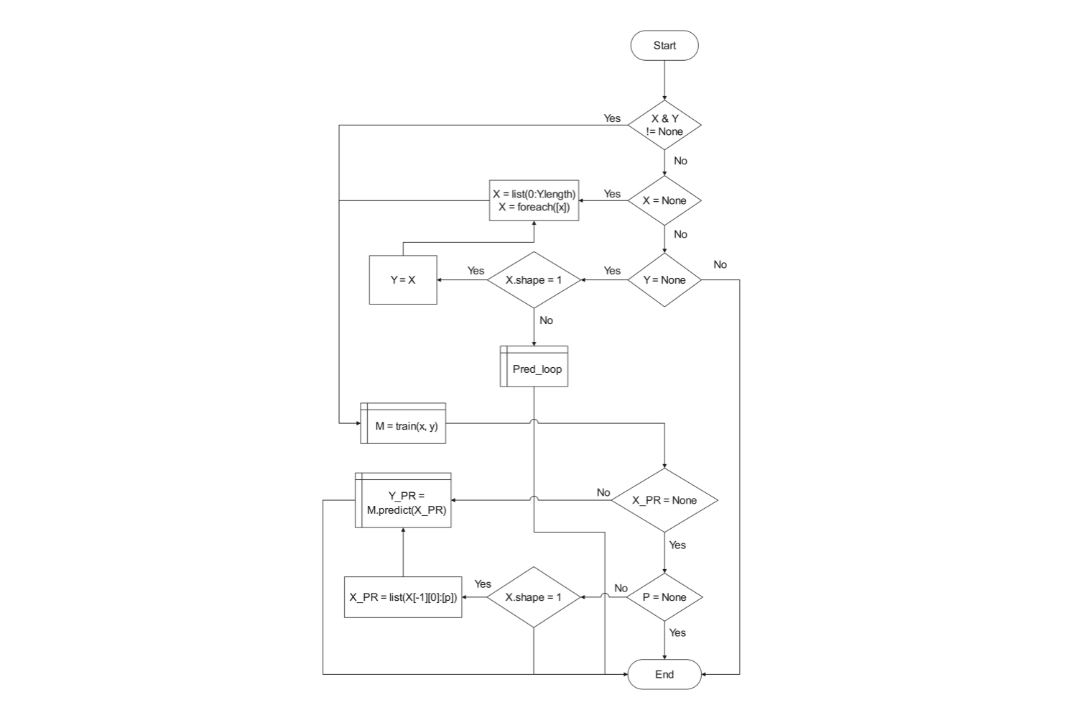
This data analysis flowchart begins by checking if X and Y are present. If both are available, the process continues. If not, X is set to None. X is adjusted according to how long Y is.
It then checks if Y equals X while Y becomes None if X has shape 1. Otherwise, the process enters a Pred_loop where a model (M) trains on X and Y and makes predictions. If X_PR is a list and X has shape 1, P is set to None, and the flow loops back.
This flowchart template is helpful for complex algorithms with multiple branches and color-coded steps. It may need additional explanation for broader audiences.
Easily Make a Yes or No Flowchart in Minutes with Edraw.AI
Edraw.AI is a flexible diagramming tool that makes creating visuals easy. It combines AI with a simple interface, offering templates for everything from flowcharts to mind maps. The result? A more efficient, stress-free process that improves productivity.
How to make a Yes or No Flowchart on Edraw.AI?
Step 1: Generate Your Flowchart Using AI
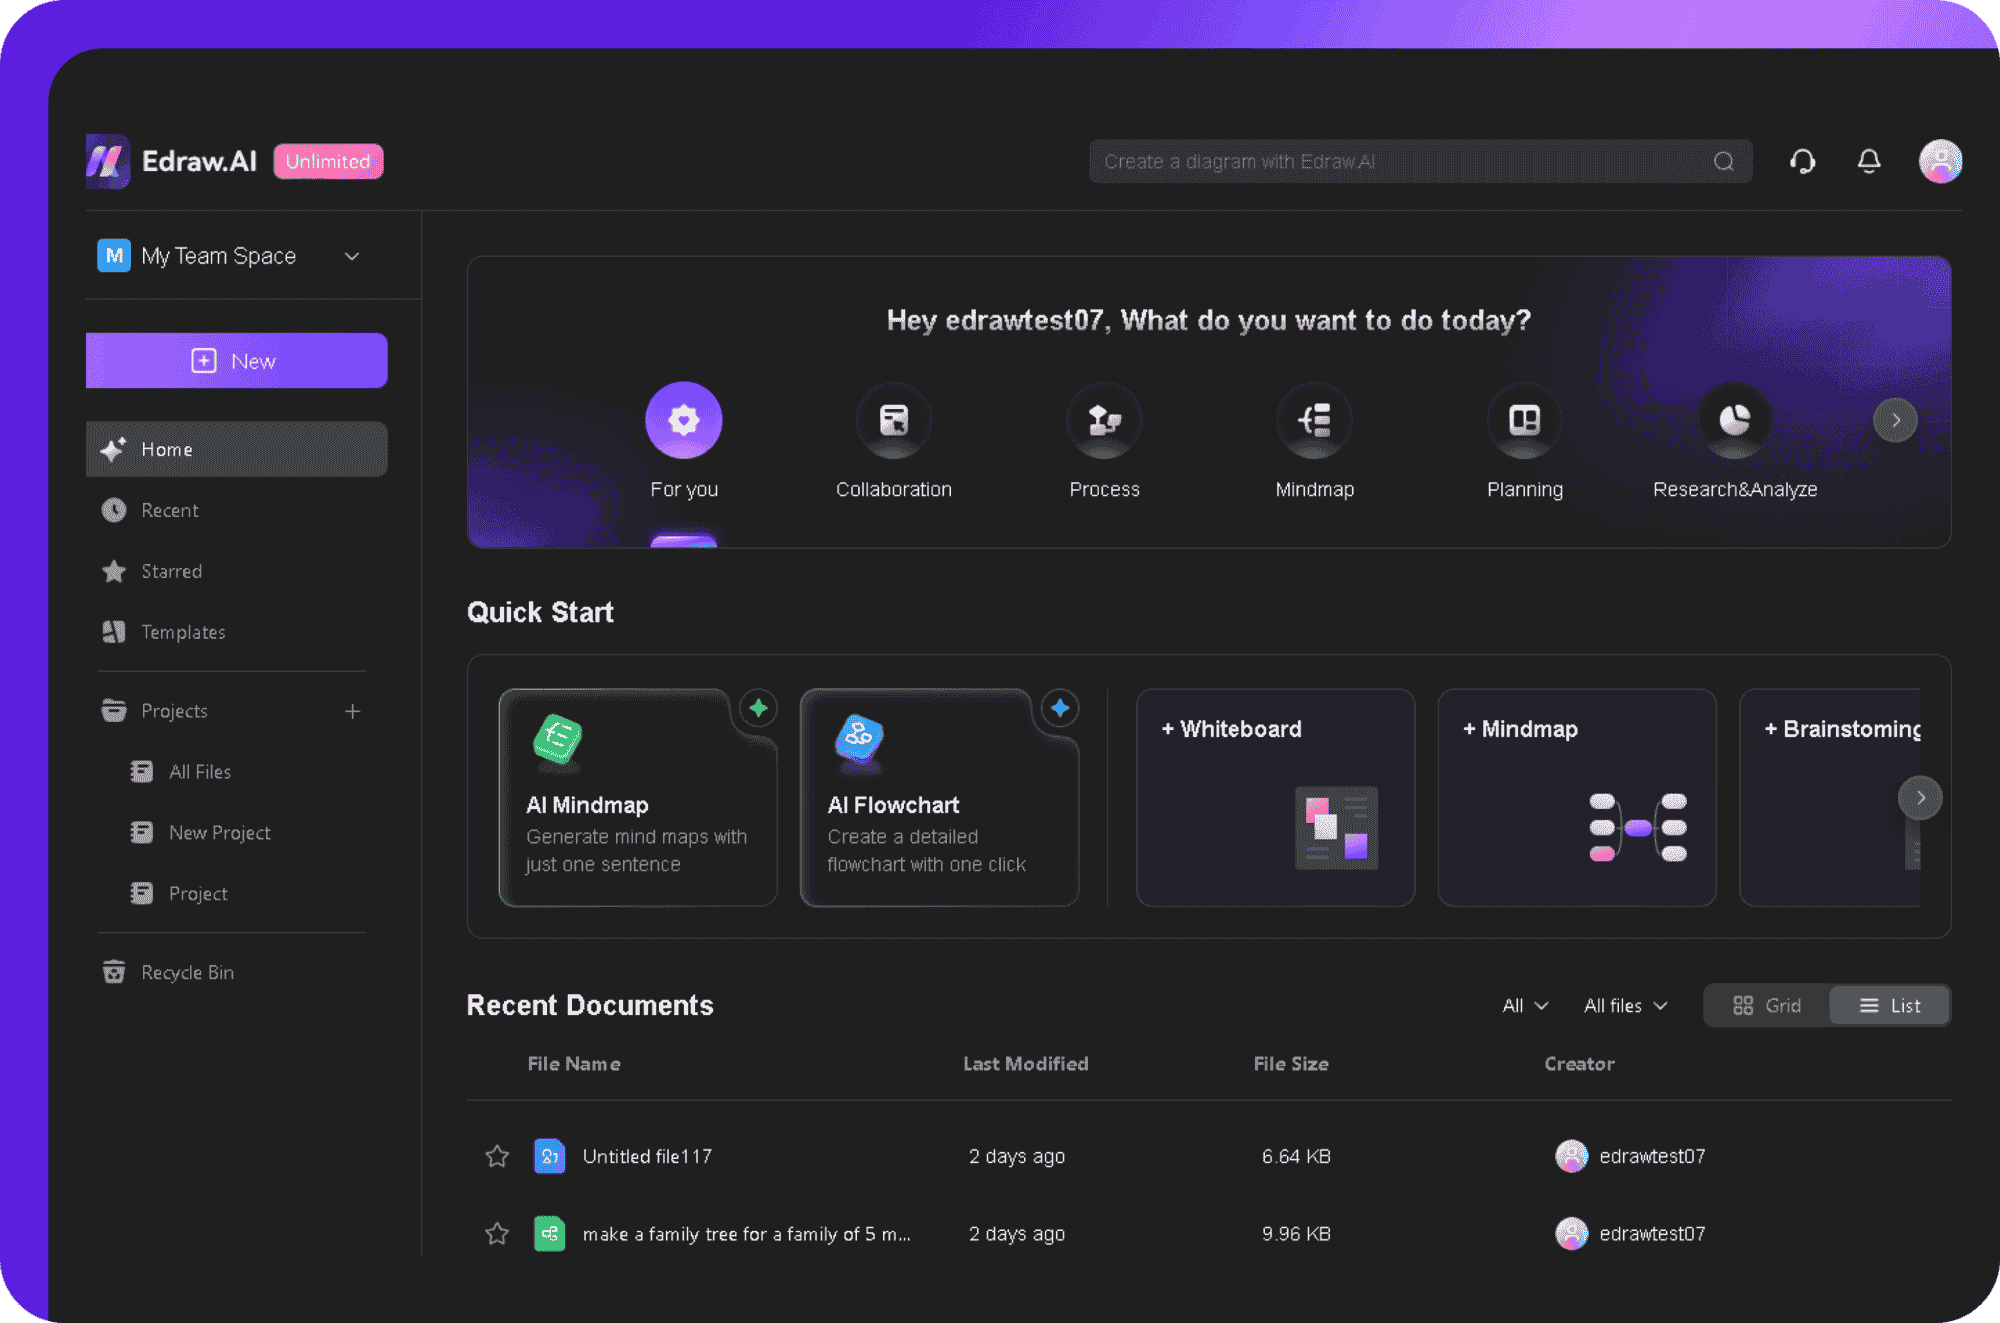
- On your home screen, click on the AI Flowchart.
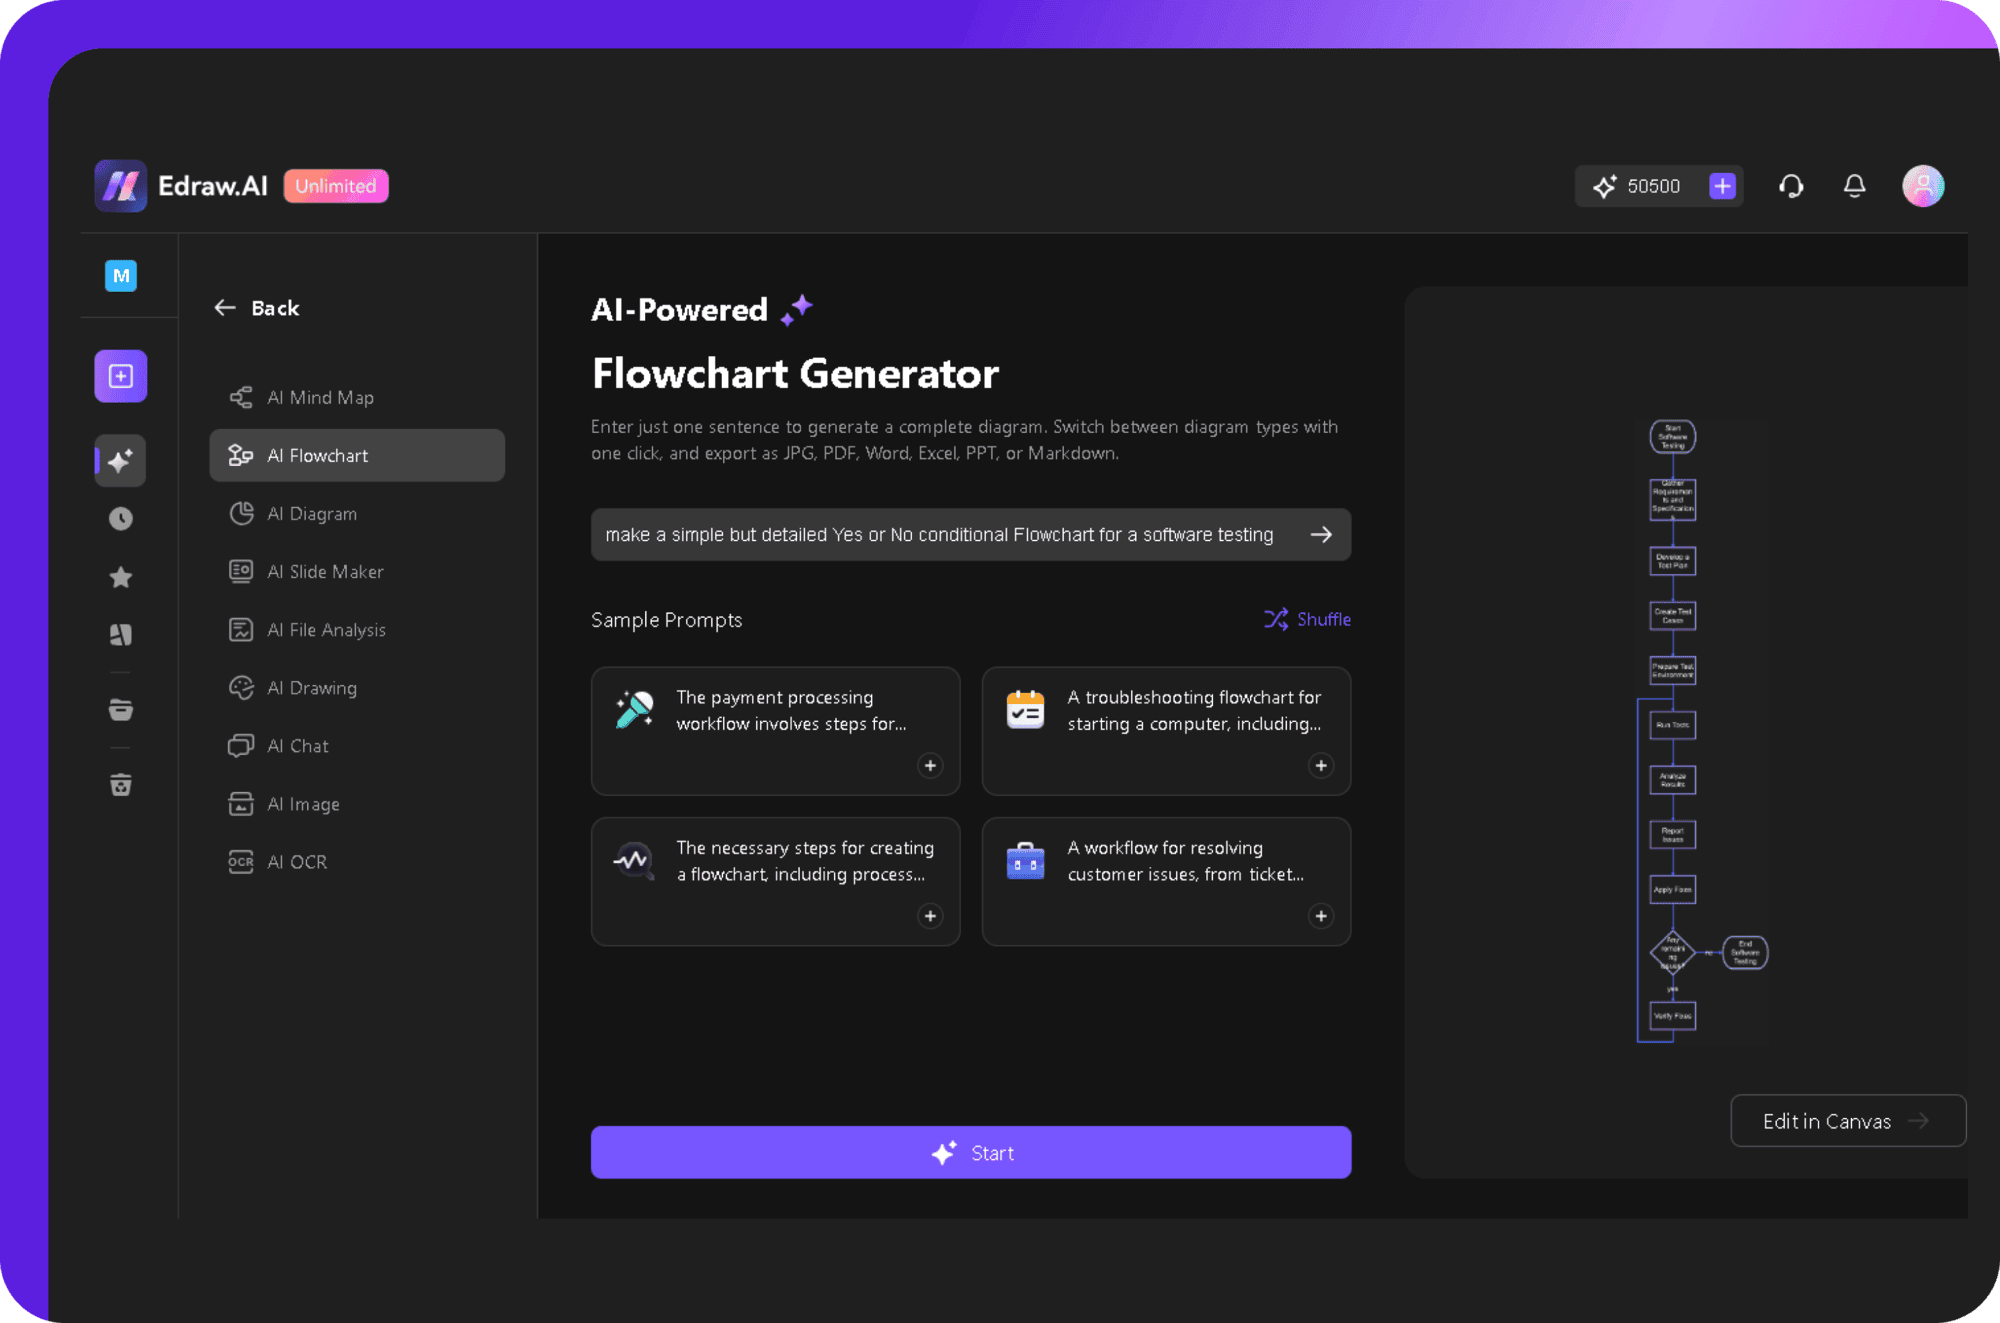
- Then, type in your prompt in the text box. For example, I asked it to create a simple but detailed yes or no conditional flowchart for software testing.
- Click the Start button, and Edraw.AI will then use its artificial intelligence to generate a flowchart based on your prompt.
- Once the flowchart is generated, you can edit it by clicking Edit in Canvas.
Step 2: Edit Your Flowchart
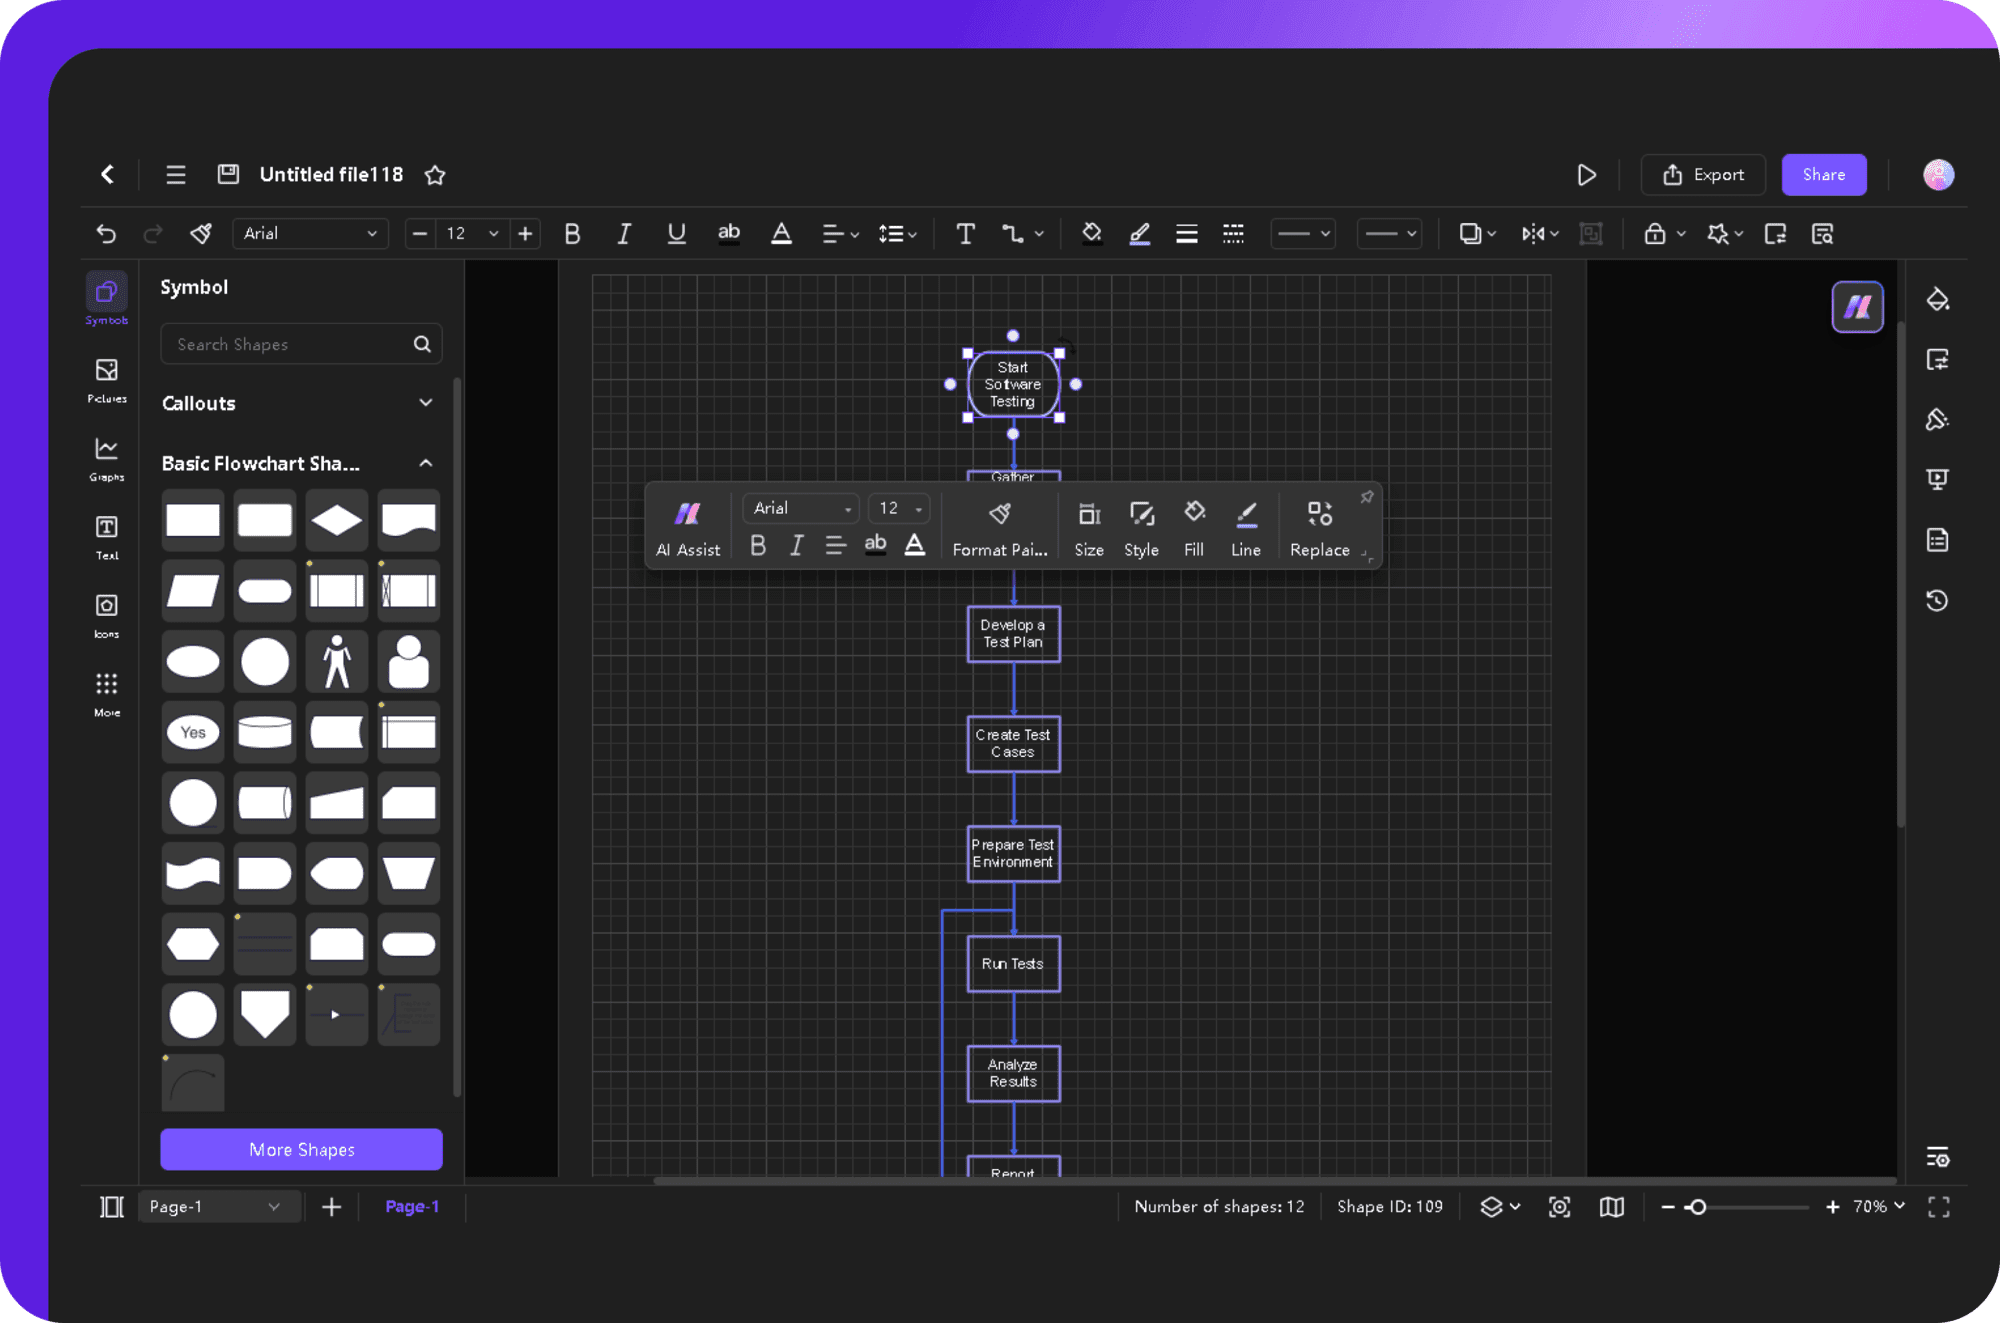
- You can add shapes from the Symbol library.
- Select a shape to remove it or customize its appearance from the pop-up menu.
- Modify the text and format based on your liking.
Step 3: Export the Flowchart
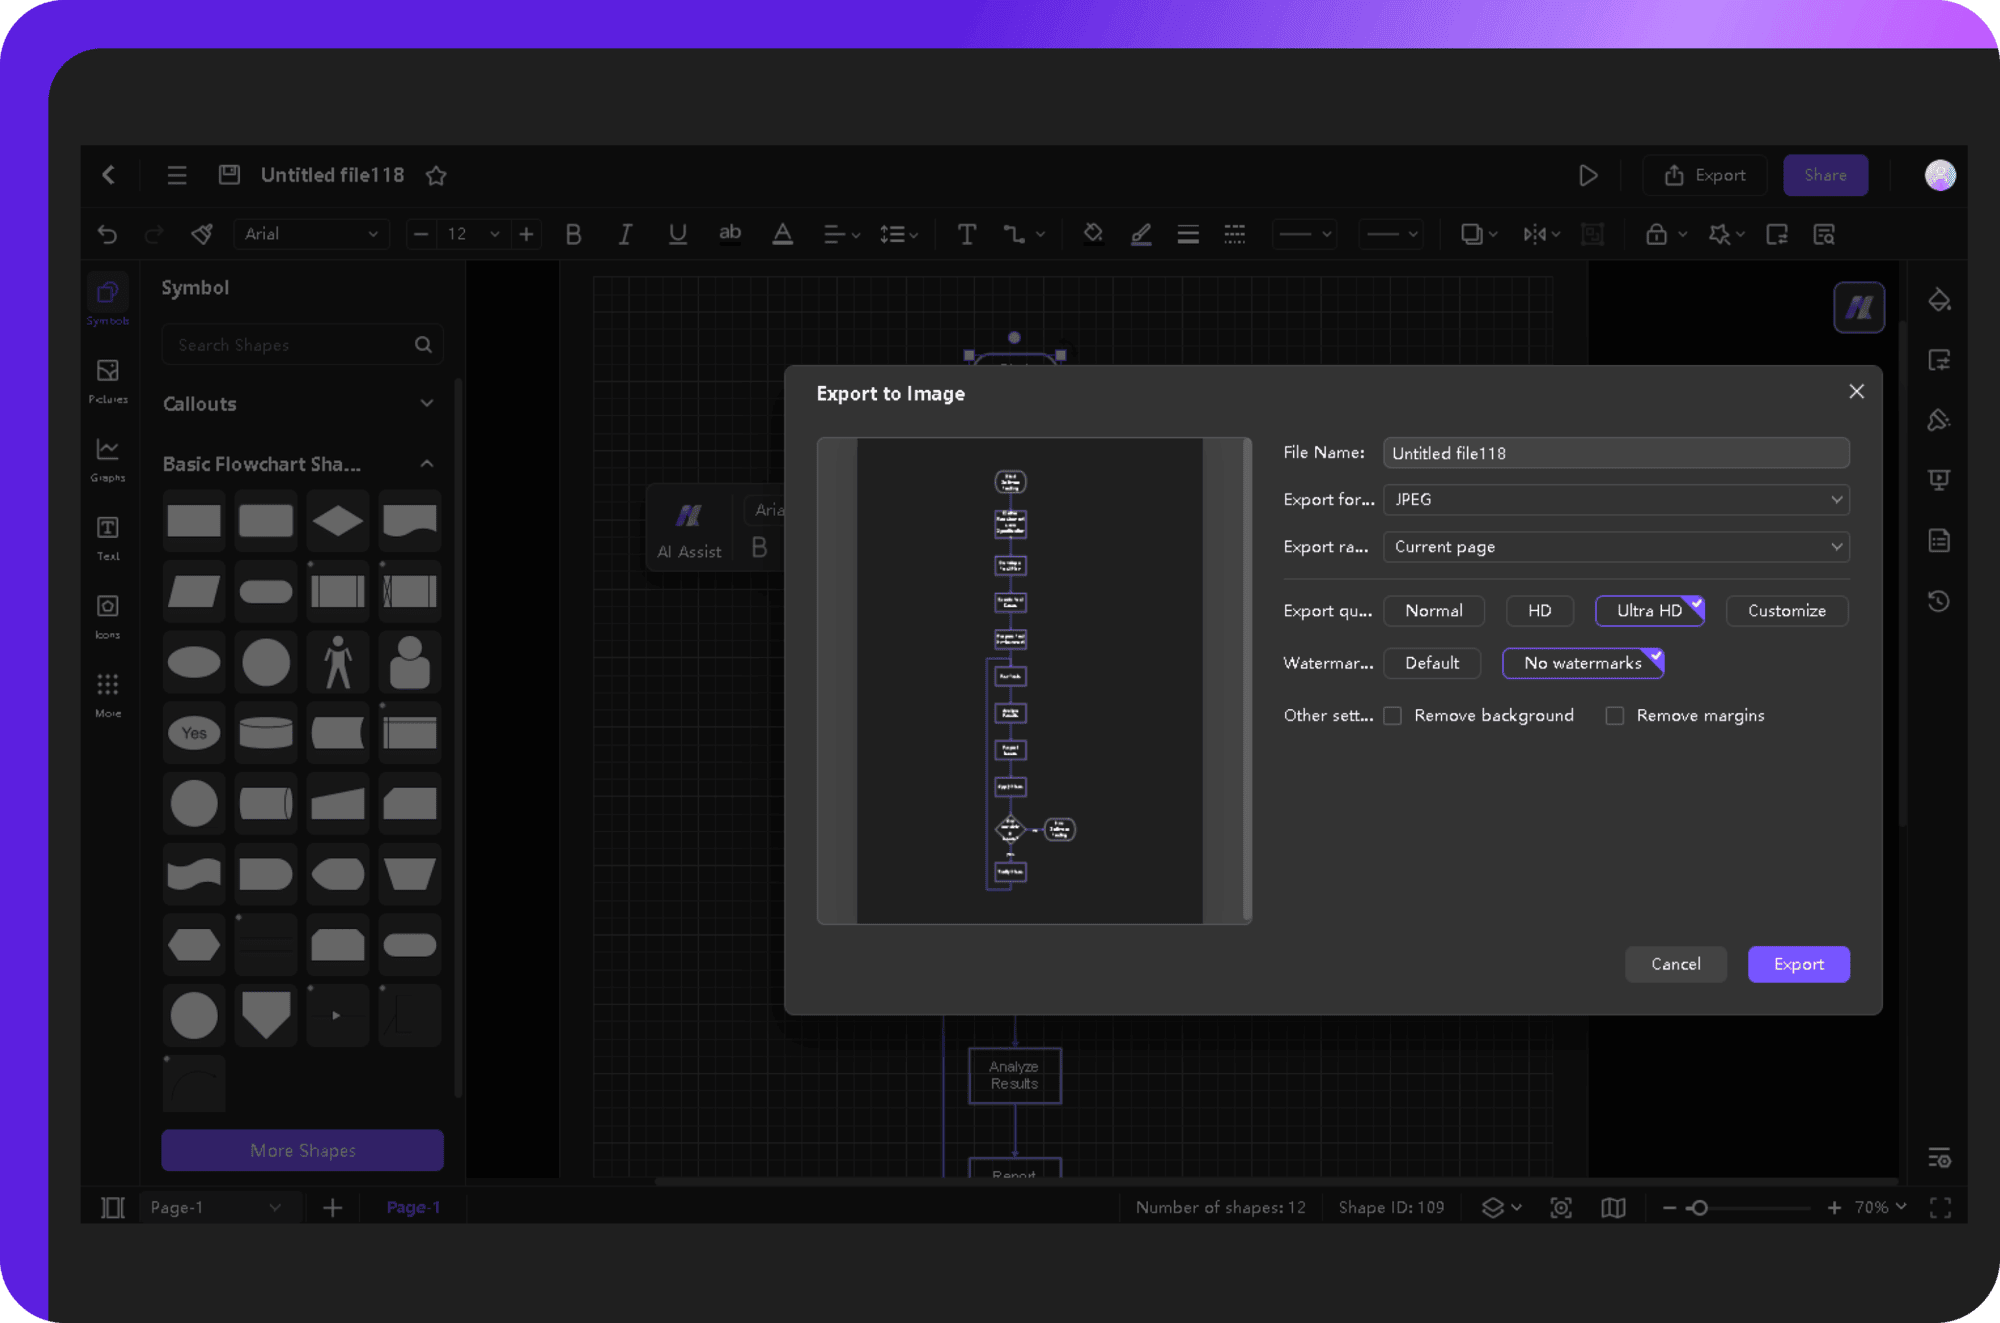
- Export your finished flowchart in formats such as PDF, JPEG, PNG, or SVG, giving you flexibility for sharing or saving.
Edraw.AI: AI-powered Flowchart Maker

Edraw.AI has made visualizing processes simple and faster for me. It’s more than just a tool; it’s a platform built to save time and effort. Here’s why I like it very much:
- The AI-powered diagram generator is my favorite feature. Instead of dragging shapes around, I type a description, and it gets the chores done for me. The results are instant and precise.
- I also love how customizable the diagrams are. From fonts to colors to connectors, I can adjust everything to fit my preferences. Adding icons or images gives diagrams an extra layer of polish.
- The template library is extensive. It’s packed with designs that help me start quickly, especially when I’m in a hurry or stuck for ideas.
- Edraw.AI works everywhere. I can use it on my laptop at work, tablet at home, or phone while traveling.
- Collaboration is another major strength. My team can join and edit diagrams with me in real time, keeping everyone on the same page.
Conclusion
Visual communication has a way of simplifying even the most tangled ideas. Conditional flowcharts highlight this perfectly. They break down complex workflows into steps and decision points, making it easy to follow the logic. Not just for engineers, they work for anyone who needs clarity in their processes.
Plus, tools like Edraw.AI make creating flowcharts effortless. With its AI support and simple interface, you can quickly map out scenarios and find solutions. Whenever you’re stuck on a confusing process, try creating a flowchart—it’s a small step that can bring clarity.

Try Our Products
Now for Free
