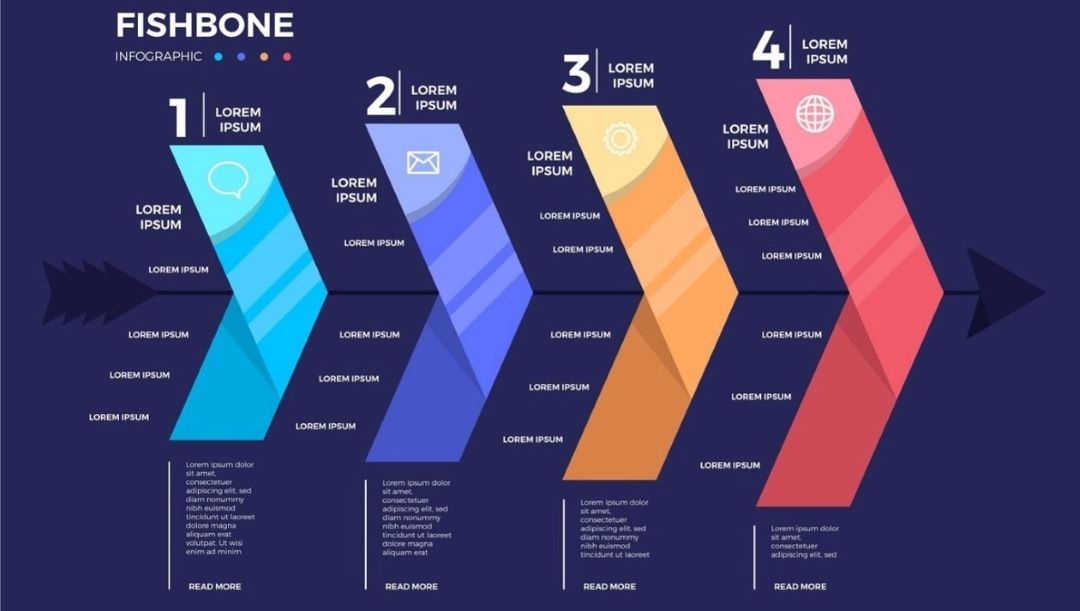
A Fishbone diagram is a great tool for reporting and solving complex problems. Fishbone diagrams, also known as Ishikawa diagrams, help you visualize root causes and find potential solutions.
Though PowerPoint isn’t designed for diagrams, it offers several options for creating one. In this guide, you’ll explore three methods for creating a basic Fishbone Diagram. The page will also dive into professional designs and use an AI tool. Read on to learn more.
In this article
How To Make a Basic Fishbone Diagram in PowerPoint
Creating a basic Fishbone Diagram in PowerPoint is a great way to help you during your presentations. You’ll learn how to form a fishbone diagram from templates or scratch, design them, and edit content with ease. Here are three different methods to get you started:
Method 1: Creating a Fishbone Diagram From a Template
Using templates in PowerPoint is the fastest way to create a Fishbone Diagram. Here’s how you can do it:
Step 1
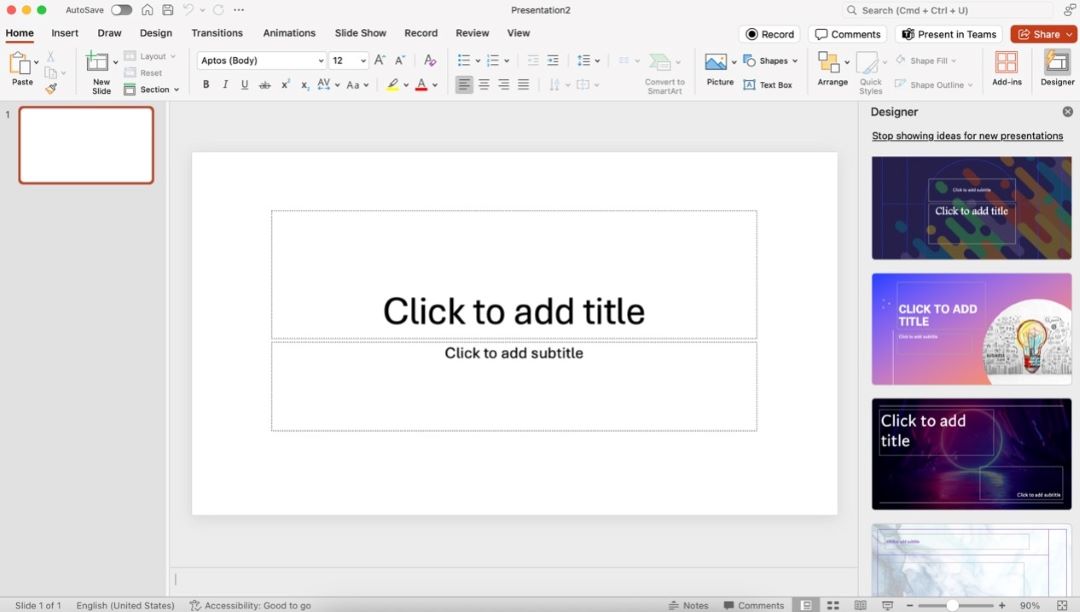
Launch PowerPoint. Create a new slide deck or open an existing presentation to which you want to add the diagram.
Step 2
Go to the Insert tab and click SmartArt. Search for Fishbone Diagram templates or similar diagrams like Process, Hierarchy, or Relationship. Click it to add it to your slide.
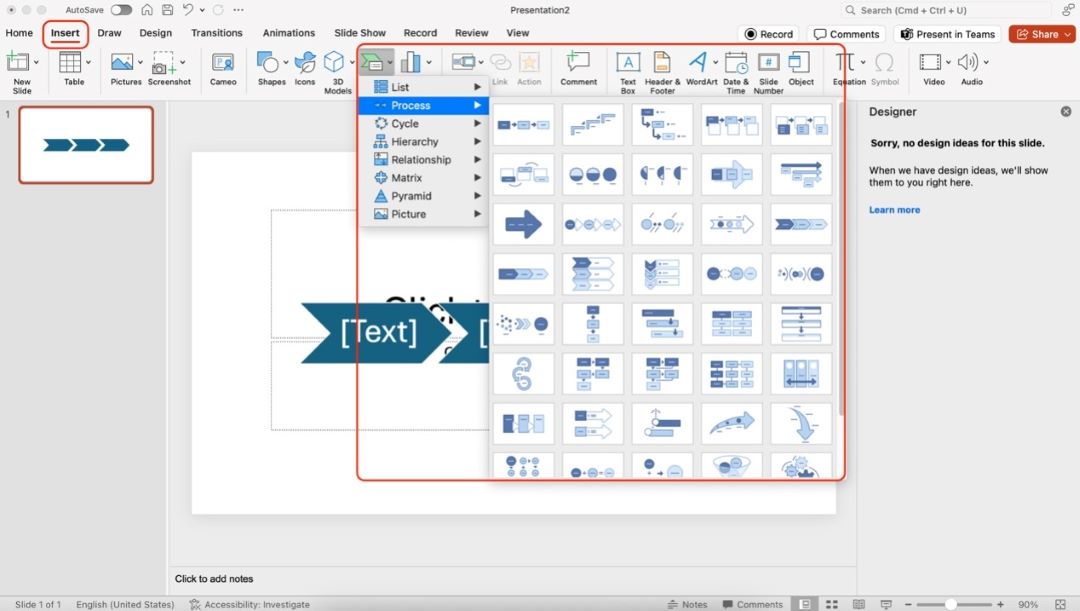
After making a diagram from a template, follow the steps provided in Method 2 to customize it and transform it into a fishbone diagram.
Method 2: Create a Basic Fishbone Diagram in PowerPoint From Shapes
For more control, you can build a Fishbone Diagram manually using PowerPoint shapes. You can also use the steps found here to customize a diagram that you’ve made using SmartArt’s built-in templates. Here are the steps:
Step 1: Drag and Drop Shapes
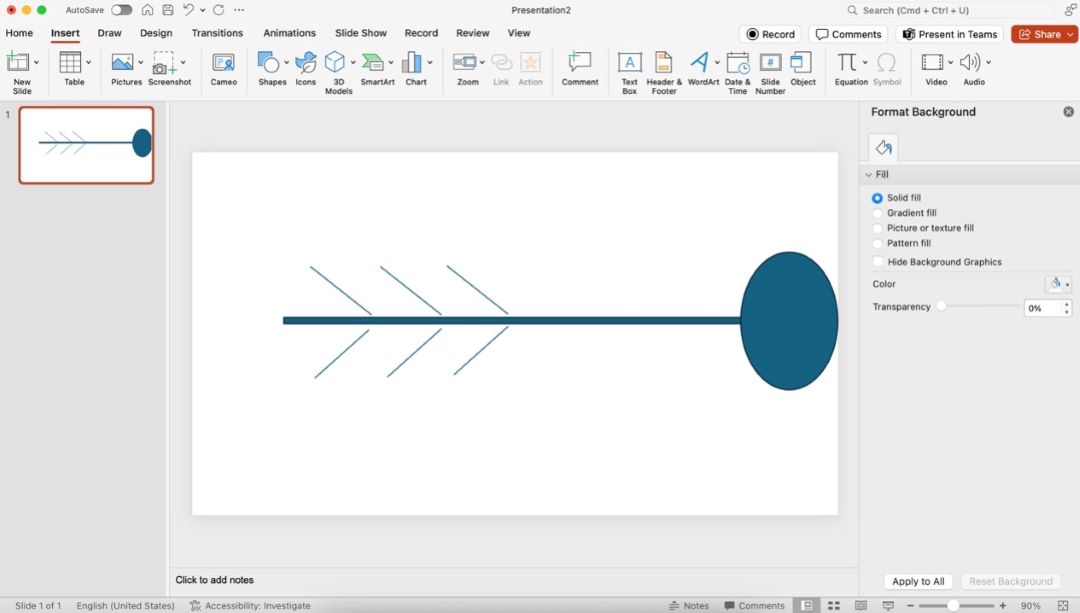
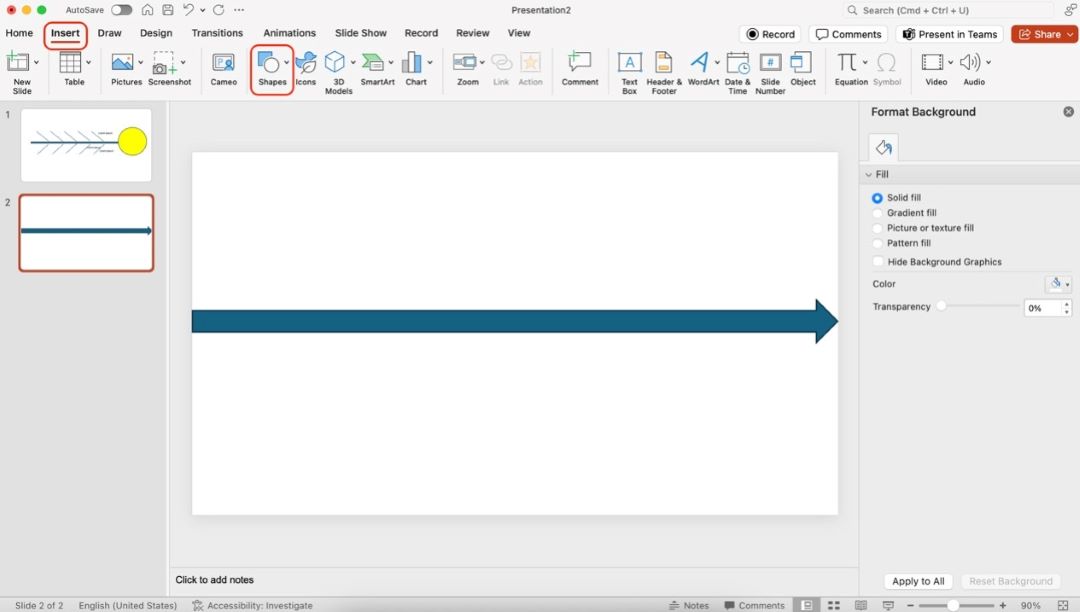
Go to the Insert tab and click Shapes. Select an arrow shape or a line for the “backbone” of the fish.
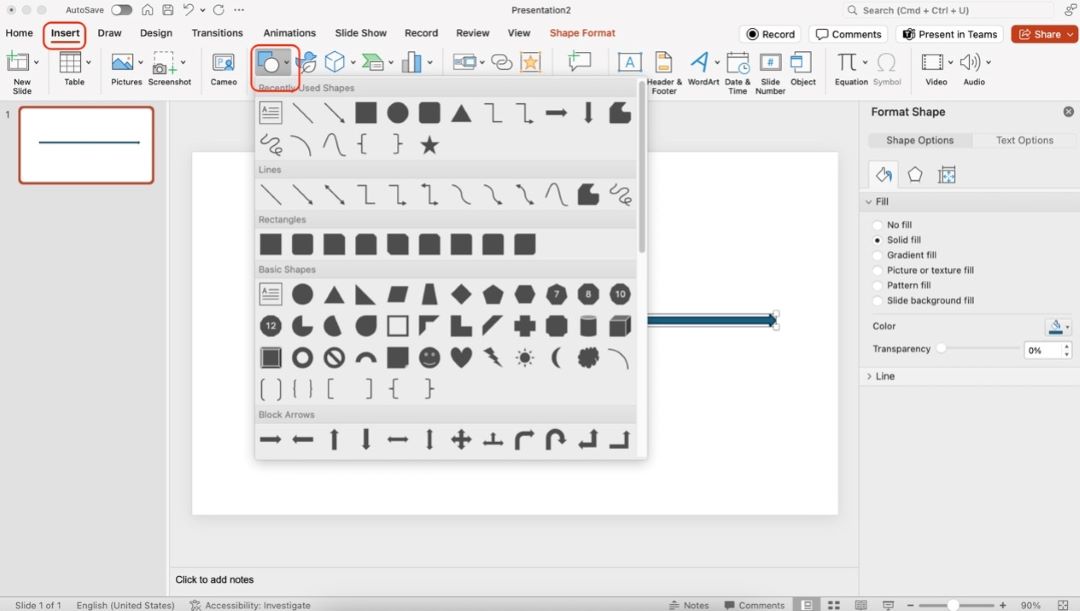
Then, add lines for each category of causes by inserting diagonal lines branching out from the main arrow.
Step 2: Arrange and Connect Shapes
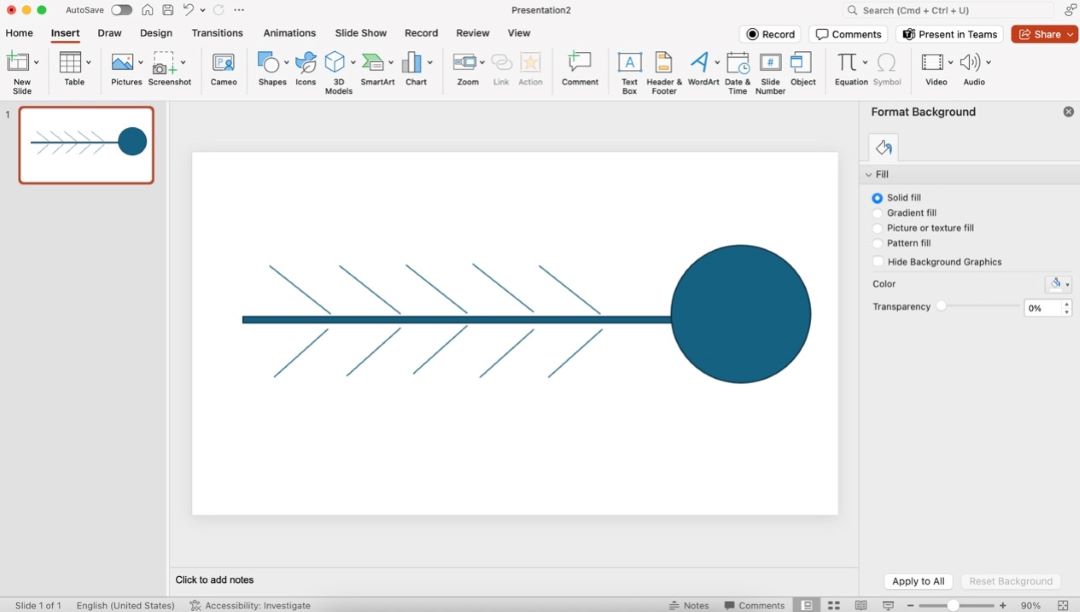
After adding the shapes that you need, make sure to connect them properly. You can just drag all the shapes you’ve added to form your fishbone diagram.
Step 3: Add Text
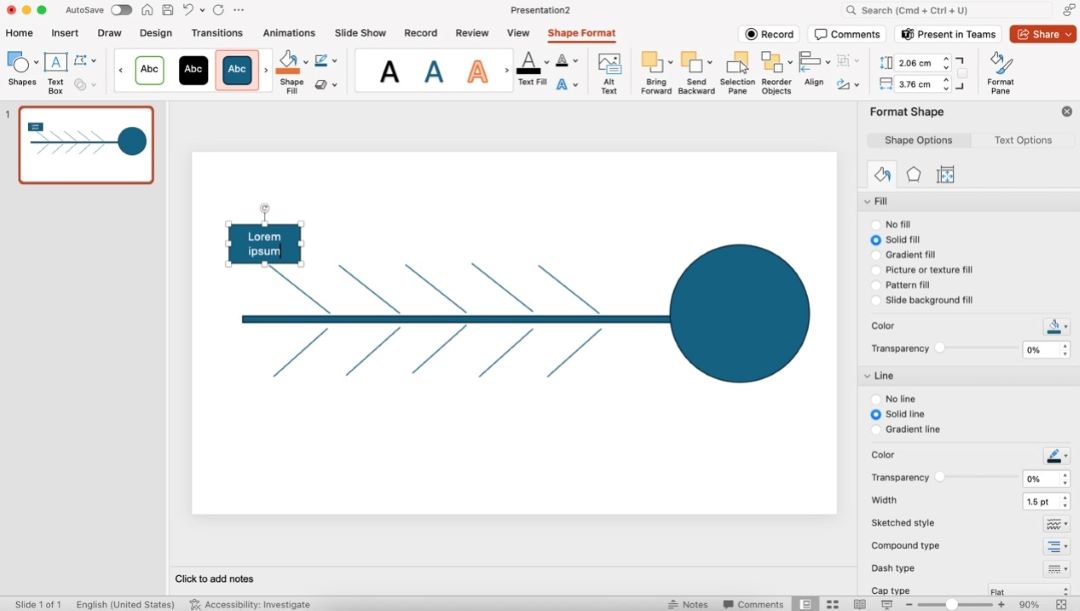
After arranging them, you can now begin to add text to your fishbone diagram. You can do this in two ways:
- Double-click any shape to add text within them if you’ve added shapes on top of the “diagonal branches”.
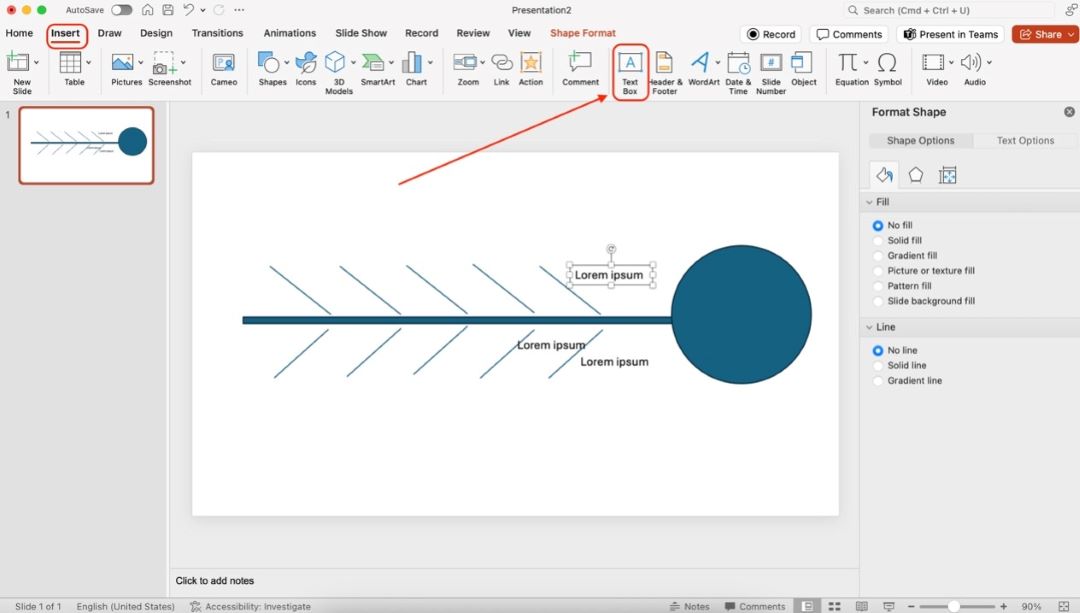
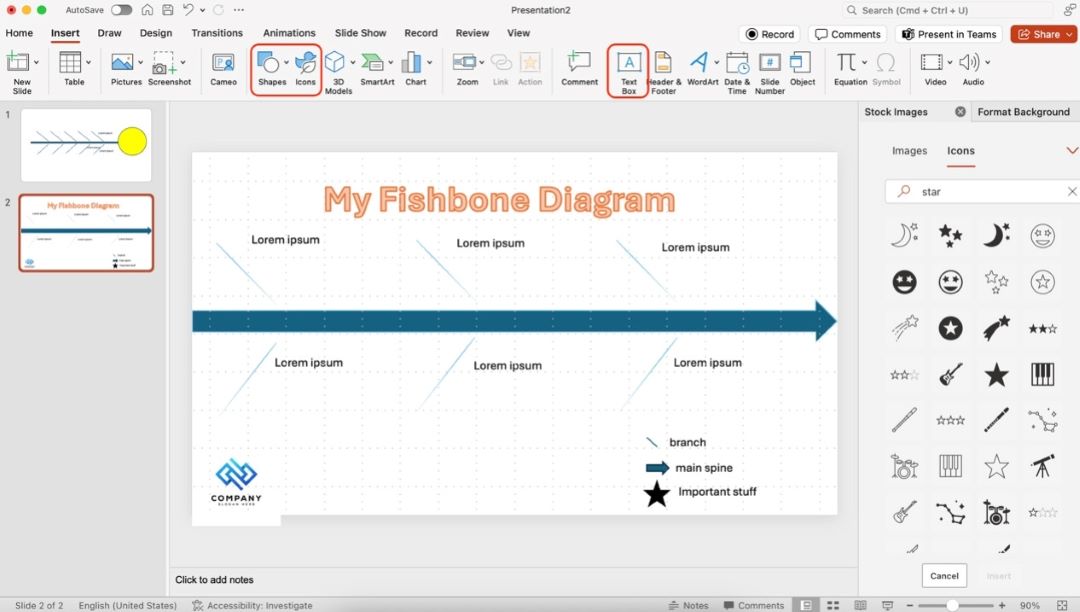
- Go to Insert > Text Box. Using a text box can help you add text beside the diagonal lines without using a shape, which can potentially make your diagram cramped.
Step 4: Change Style
Now that you’ve finished the content of your fishbone diagram, you might want to customize it.
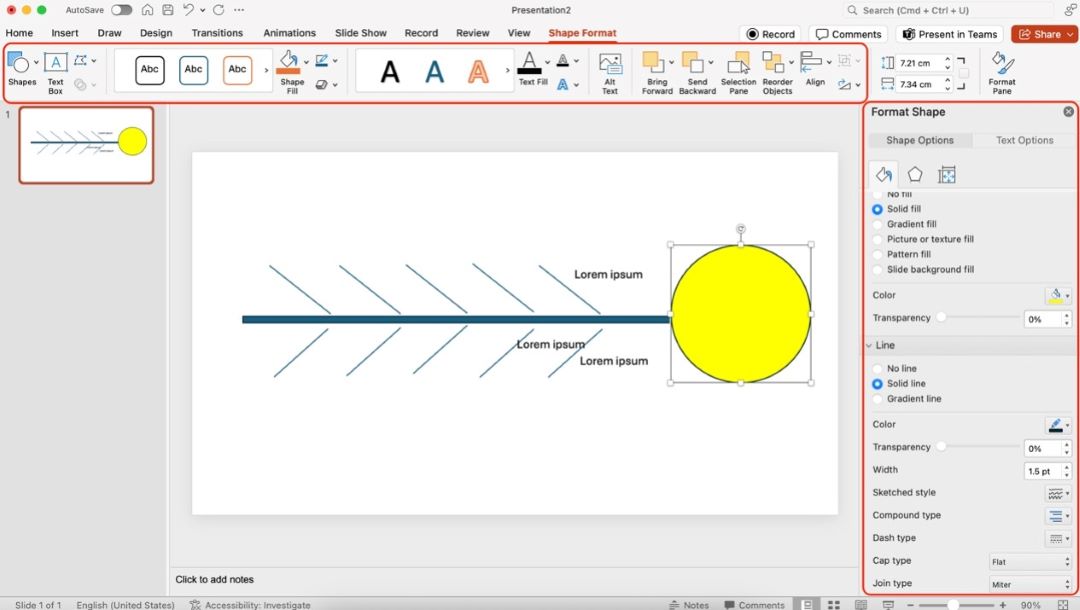
To customize a single shape or element of the fishbone diagram for emphasis or other purposes, select them by clicking them. Then, use the Format Pane to use tools like Fill or Line that will change the appearance of a single element or shape.
Alternatively, you can use the Shape Format toolbar to explore options like layering, shape styles, and more.
How To Edit and Customize a Fishbone Diagram in PowerPoint
Now that you know the basics of creating a fishbone diagram, you have the skillset to take your diagrams up a notch. In this part, you’ll be guided through steps to create professional fishbone diagrams, or at least take inspiration from.
Step 1
Create a new slide or open PowerPoint.
Step 2
Insert any arrow you like from Insert > Shape. This will be your main “spine”, same as above. Extend it to cover most of the slide width.
Step 3
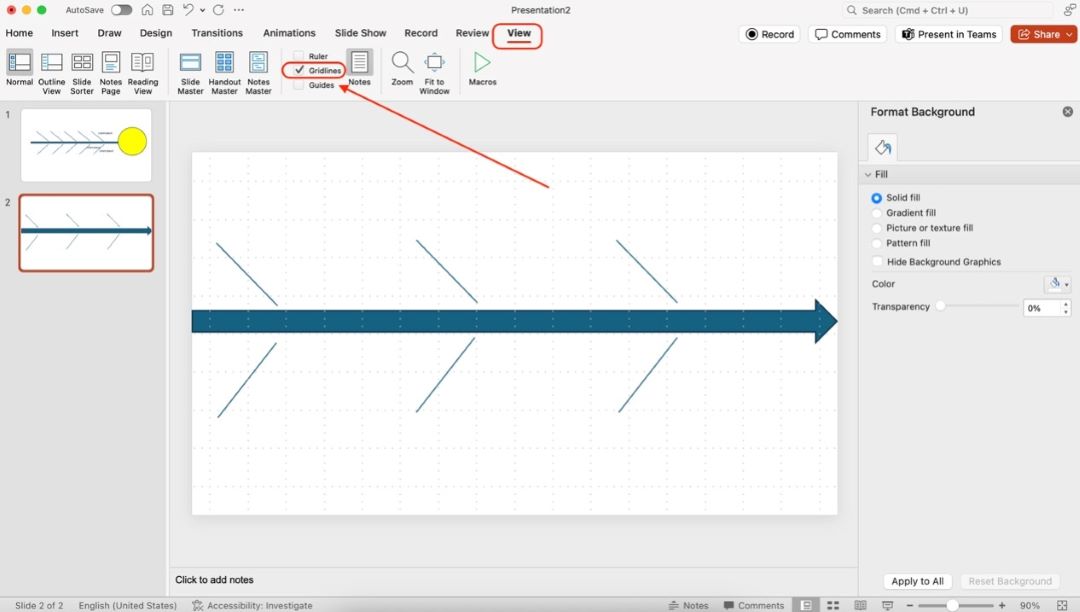
Add six arrows from Insert > Shapes > Lines > Arrow on each side of the main spine, angled at about 45 degrees. Use PowerPoint’s gridlines through View > Gridlines for precise positioning
Step 4
Select all your shapes. Go to Shape Format > Group Shapes > Group to allow group formatting.
Tip
You can group different shapes by selecting those that you want to be grouped and performing the same operation.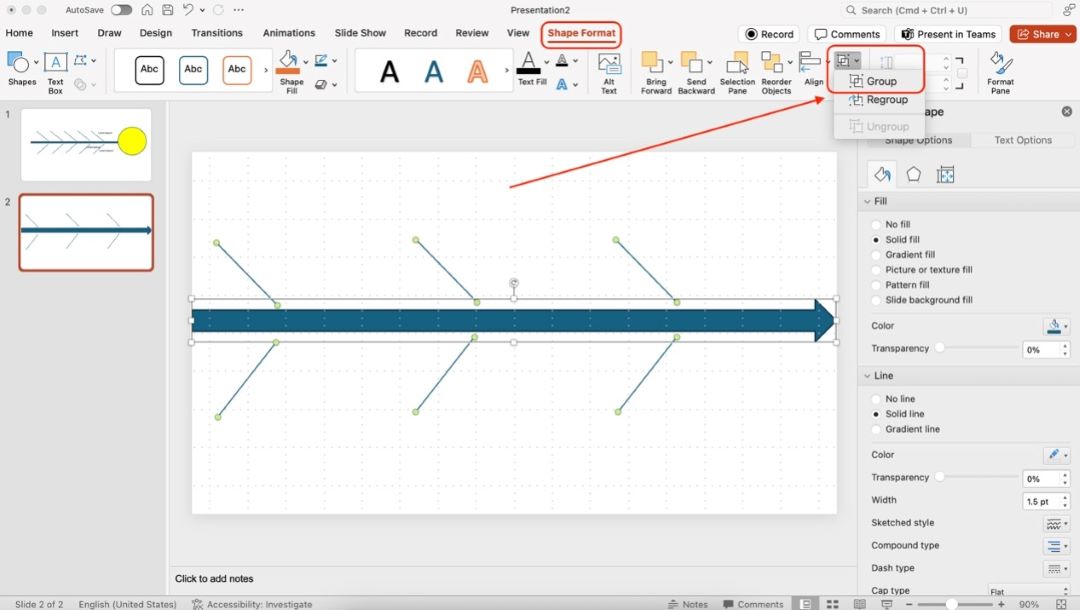
Step 5
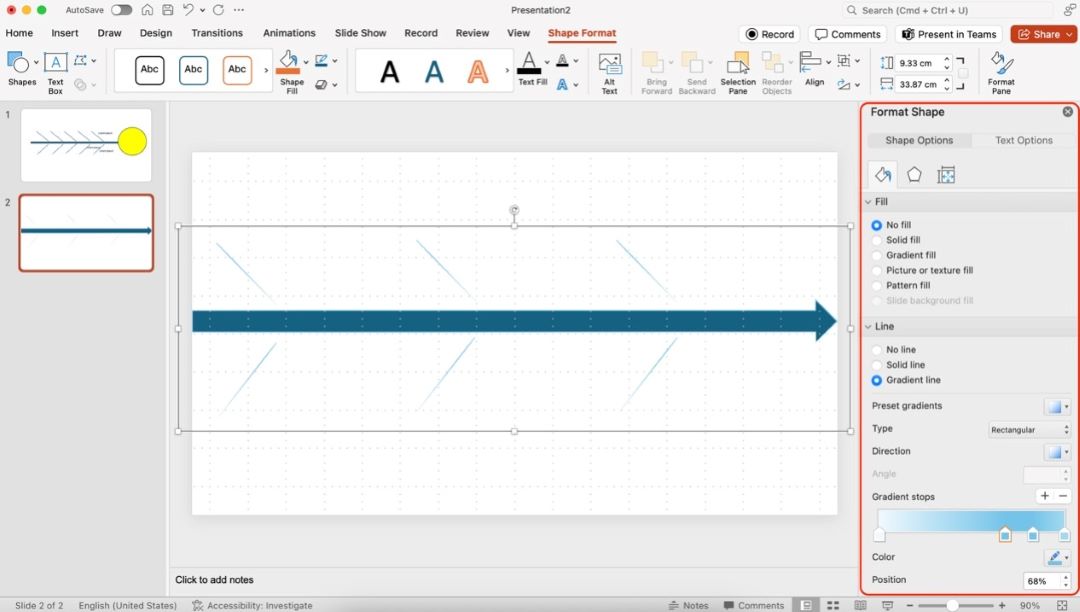
With the shapes selected, go to the Format pane and customize what styles you want for them.
Step 6
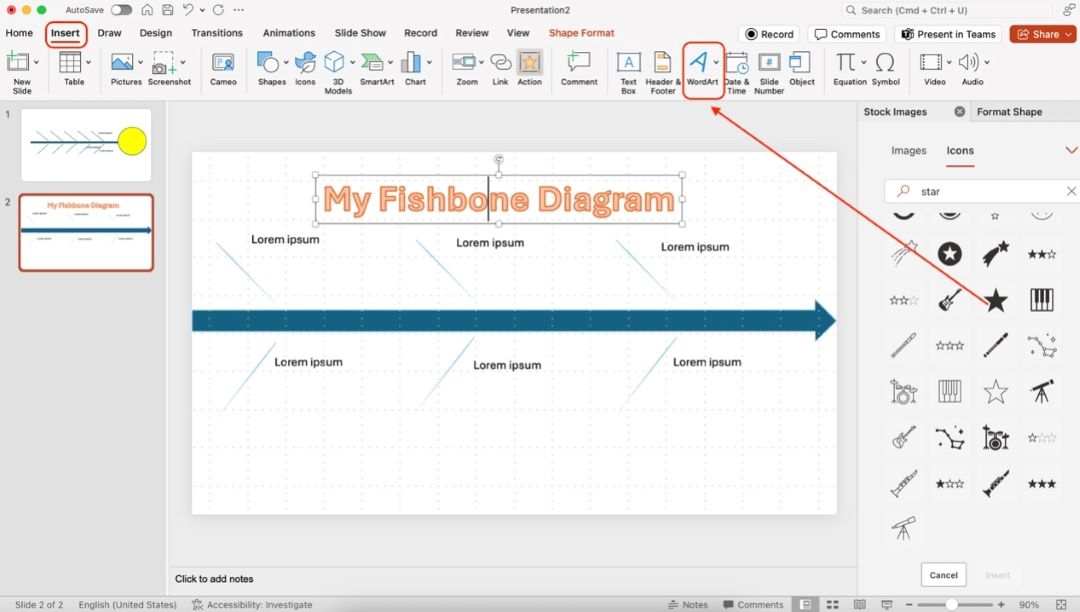
Add a title to your fishbone diagram. To do this, use Insert > WordArt.
Step 7
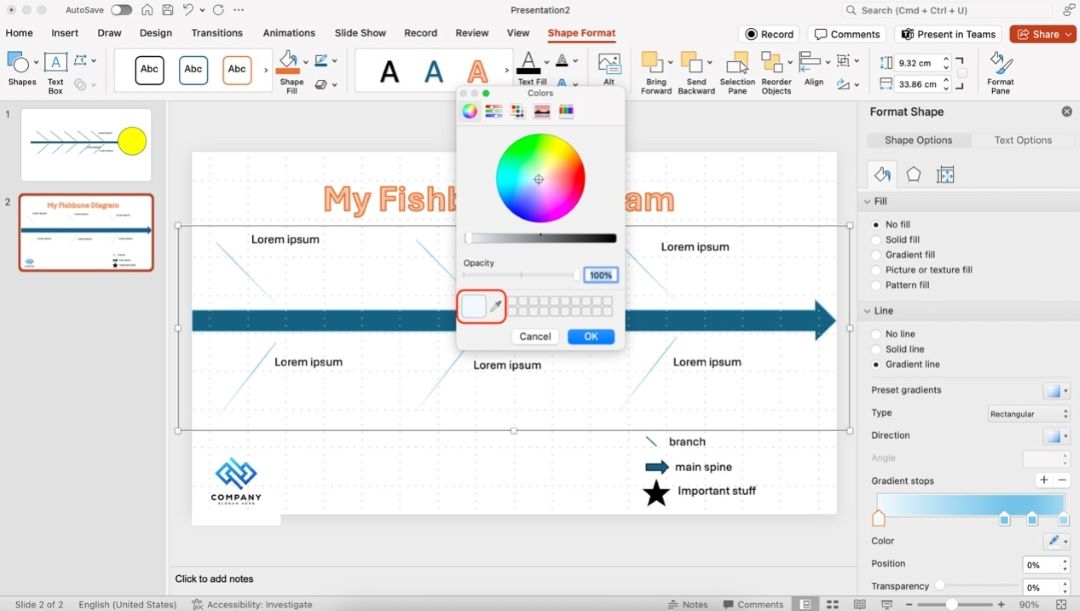
Apply a consistent color scheme. Use the eyedropper tool in More Colors to match the colors in your diagram.
Tip: The tool More Colors can be found on every color picker interface within PowerPoint.
Step 8
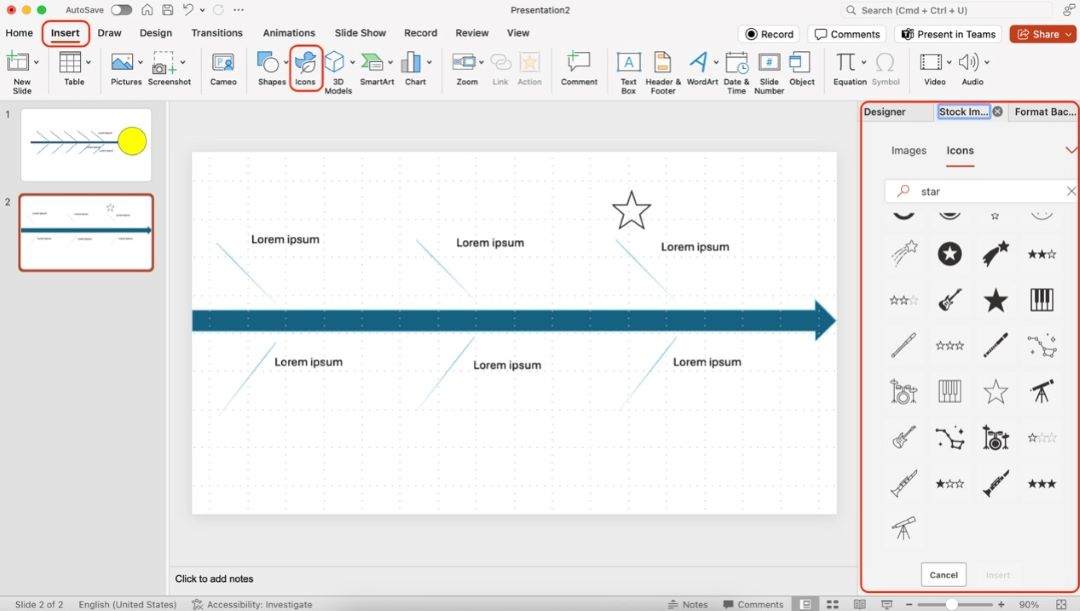
Add icons related to each major cause for visual interest through Insert > Icons. Resize and recolor them to match your scheme.
Step 9
Create a legend. Use Insert > Shapes/Icons/Text Box to explain your color coding or iconography.
Step 10
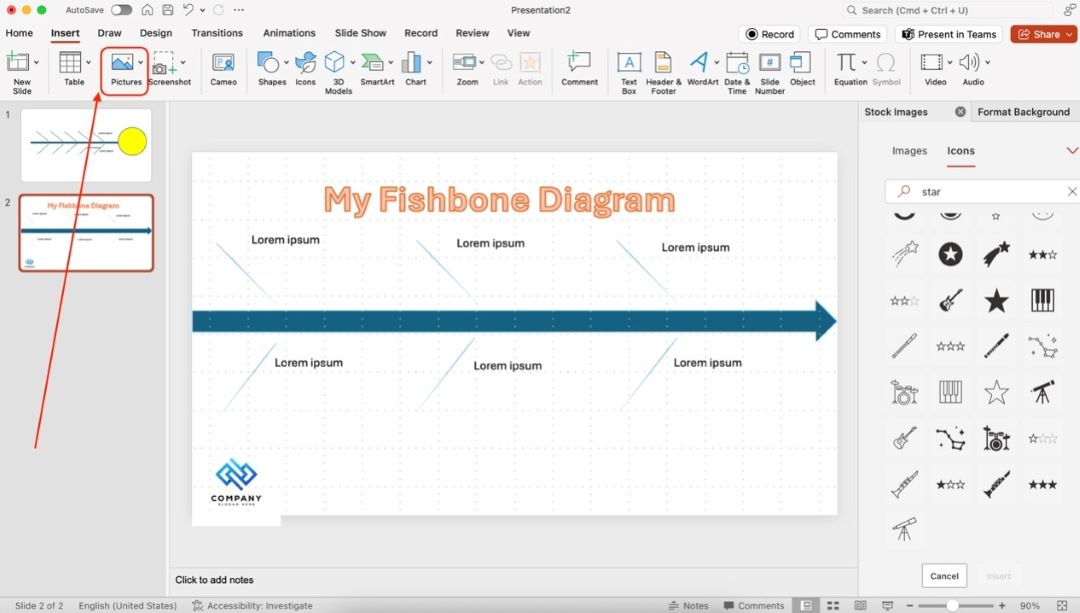
For a professional touch, go to Insert > Pictures to add your company or custom logo as a small watermark in a corner.
How To Make a Fishbone Diagram With AI
Edraw.AI simplifies the creation of Fishbone Diagrams. The platform has AI-powered features and pre-built templates to generate an elegant Fishbone diagram in seconds. If you’re looking for a timesaver, Edraw.AI is the way to go.
Here are the steps to make a Fishbone diagram using two methods, starting with AI:
Method 1: Generate a Fishbone Diagram in Edraw.AI
Edraw.AI allows you to generate a Fishbone Diagram based on text prompts. It’s a fast and innovative solution for making diagrams. Follow the steps:
Step 1
Sign in to Edraw.AI using your Wondershare account or social media credentials. Next, go to Home > AI Mind Map.

Step 2
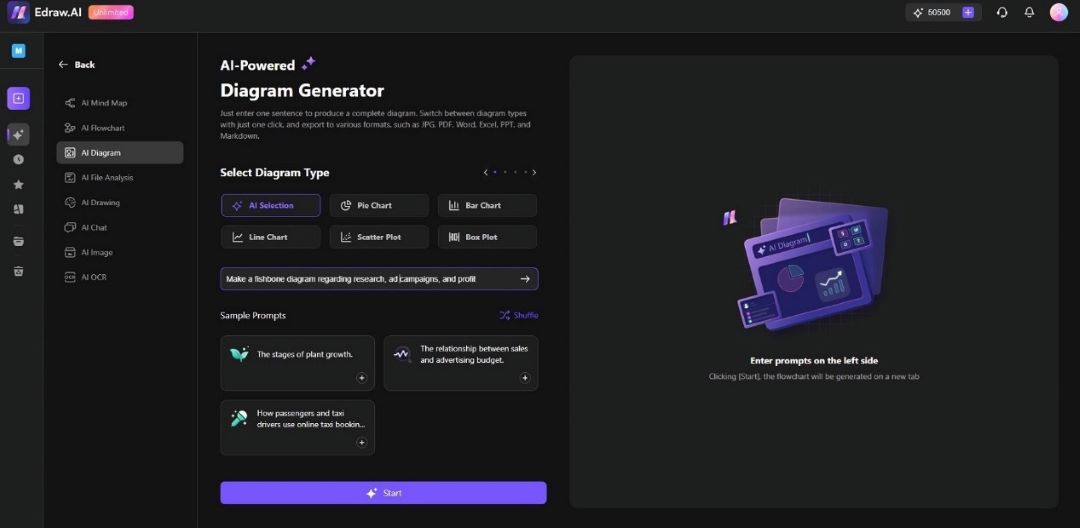
Choose AI Diagram. Enter prompts in the dialog box and click the Start button. Wait for Edraw.AI to generate the structure of the Fishbone Diagram.
Step 3
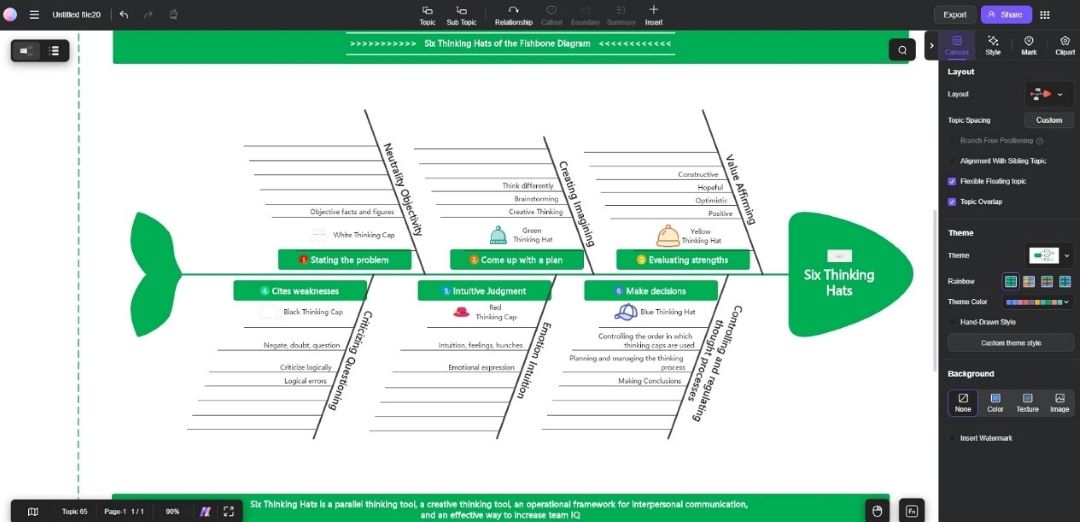
Use the right panel to customize the layout, colors, and font styles to match your presentation’s theme.
Method 2: Creating a Fishbone Diagram Using Templates
For those who prefer a more guided approach, Edraw.AI provides a wide variety of pre-designed Fishbone Diagram templates. Follow the steps:
Step 1
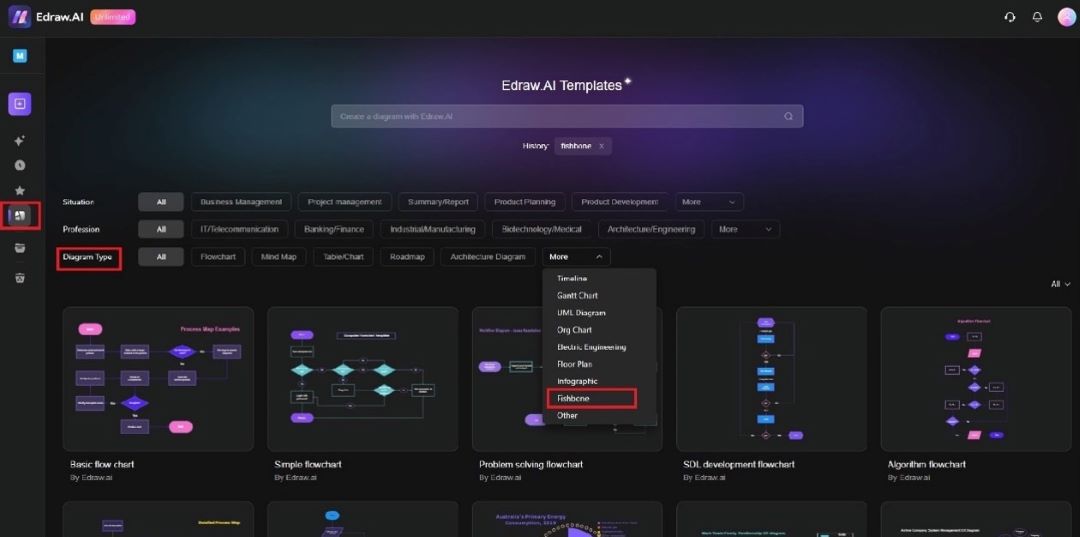
Go to the Templates section. Use the dialog box and search for “Fishbone Diagram.” Alternatively, click Diagram Type and choose Fishbone from the dropdown.
Step 2
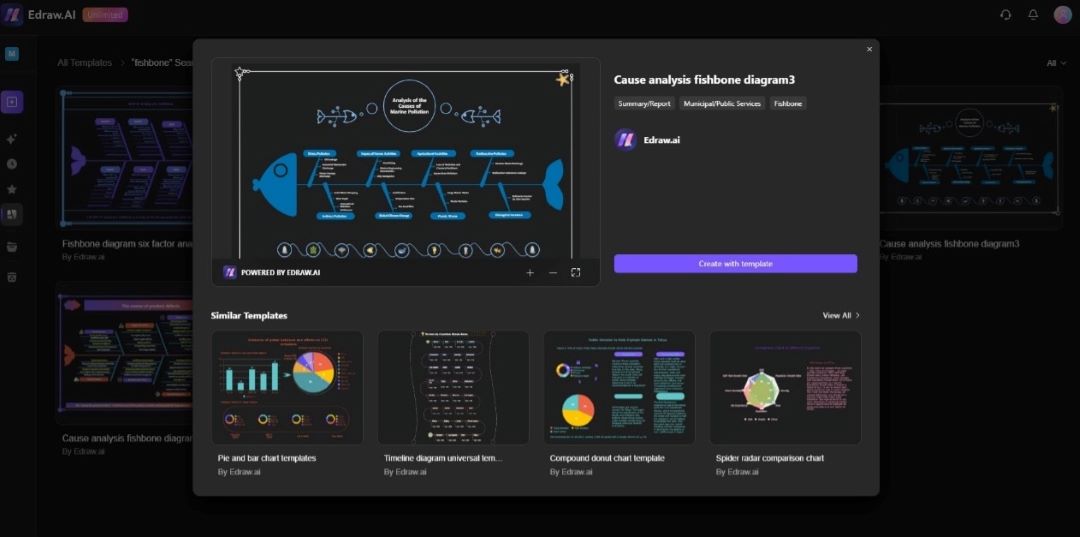
Choose the Fishbone diagram template that best fits your project. Click the Create with template button to go to the editing window.
Step 3
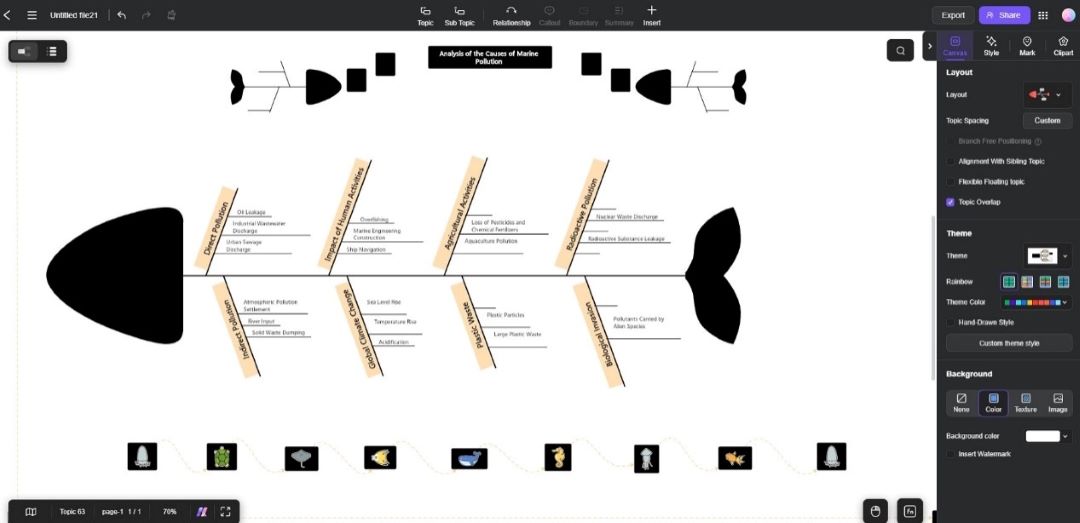
Change the existing categories and causes. Add your content, change the colors, and rearrange the layout to meet your needs. Add icons or more shapes to enhance the visual appeal.
Export the Diagram/Chart to PowerPoint
Once satisfied, export the diagram by clicking Export and choosing the Image format.
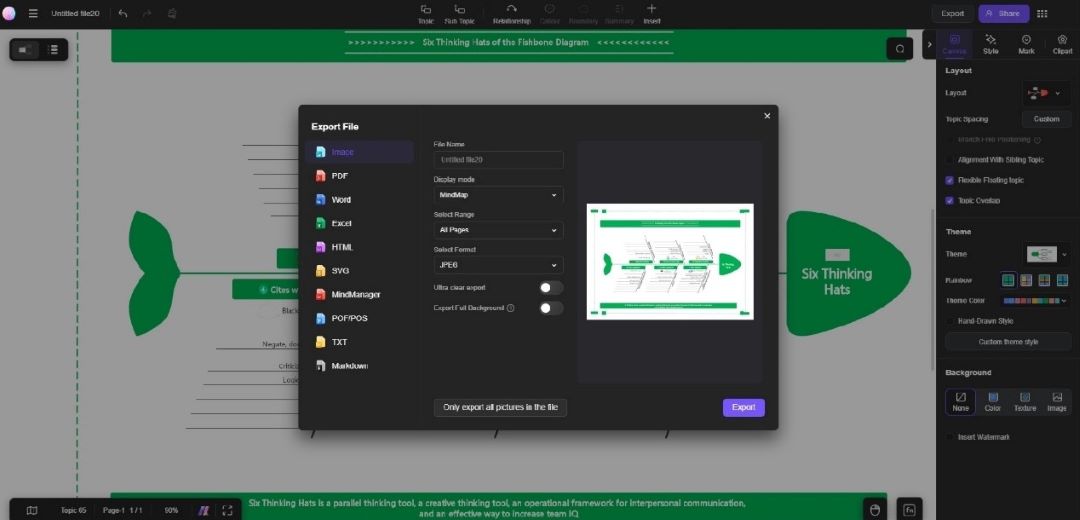
Then, add your fishbone diagram to PowerPoint using Insert > Pictures.
Best Practices for Making a More Appealing Fishbone Diagram
Creating an appealing Fishbone Diagram enhances its effectiveness. It also leaves a lasting impression. Here are some best practices:
- Keep it clean and organized. Avoid clutter by limiting the number of categories and causes. Too many elements can make the diagram difficult to follow.
- Use consistent colors. Maintain a uniform color scheme throughout the diagram. Consider using different shades for each category, but make sure they complement each other.
- Use icons and visuals. Put icons to represent categories or key causes. This adds visual interest and helps the audience quickly understand each part.
- Use contrasting fonts. Ensure your fonts are legible by using contrasting colors for the text and background.
Conclusion
Using Fishbone diagrams is an excellent way to organize problems and their potential causes. Creating basic and professional Fishbone diagrams is possible with templates and manual shapes with PowerPoint.
Or, AI-powered tools like Edraw.AI can help you make a Fishbone diagram in seconds. By following the steps outlined above, you can create an effective Fishbone Diagram and improve your presentation’s clarity and impact.
FAQ
-
Can I customize the templates in PowerPoint to suit my needs?
Yes, PowerPoint templates are flexible. You can edit the text, change the Fishbone diagram’s layout, adjust colors, and even add or remove categories. You can also change shapes and lines. -
What’s the best way to make a Fishbone Diagram quickly?
The fastest way to create a Fishbone Diagram in PowerPoint is by using the built-in SmartArt or pre-made templates. These options let you start with a structured format. If you need even more speed, using an AI tool like Edraw.AI can generate a diagram for you in seconds. -
Can I use icons in a Fishbone Diagram?
Yes, adding icons can enhance its appeal and make it easier to understand. Icons can represent categories like “People” or “Processes.” It gives viewers a visual reference for each section. PowerPoint allows you to insert icons from the Insert tab. Choose from a wide range of options or upload your custom icons. -
How can I export my diagram from Edraw.AI to PowerPoint?
Click the Export option and choose PowerPoint as the file format. Your diagram will be converted into a PowerPoint slide. You can edit or use it in your presentation.


