
Organizational charts help teams work better by simplifying communication and workflow. They clarify roles, making them valuable for managing a team, running a small business, collaborating on a project, etc.
Over time, I’ve tested many tools for creating org charts, and Google Slides stands out as a free org chart builder. However, it can be tricky to use without clear instructions.
In this article, I will guide you step-by-step and share practical tips for smoother workflows. I'll also introduce the top Google Slides alternative, Edraw.AI, a versatile tool for creating polished charts.
So, whether you're new to org charts or need advanced options, you’ll find everything you need to get started.
In this article
How to Make an Org Chart in Google Slides?
With its flexible features, Google Slides allows you to design a professional chart in no time. Just follow any of the methods to get started.
Method 1: Built-in Diagram Tool
Step 1Access the Diagram Tool
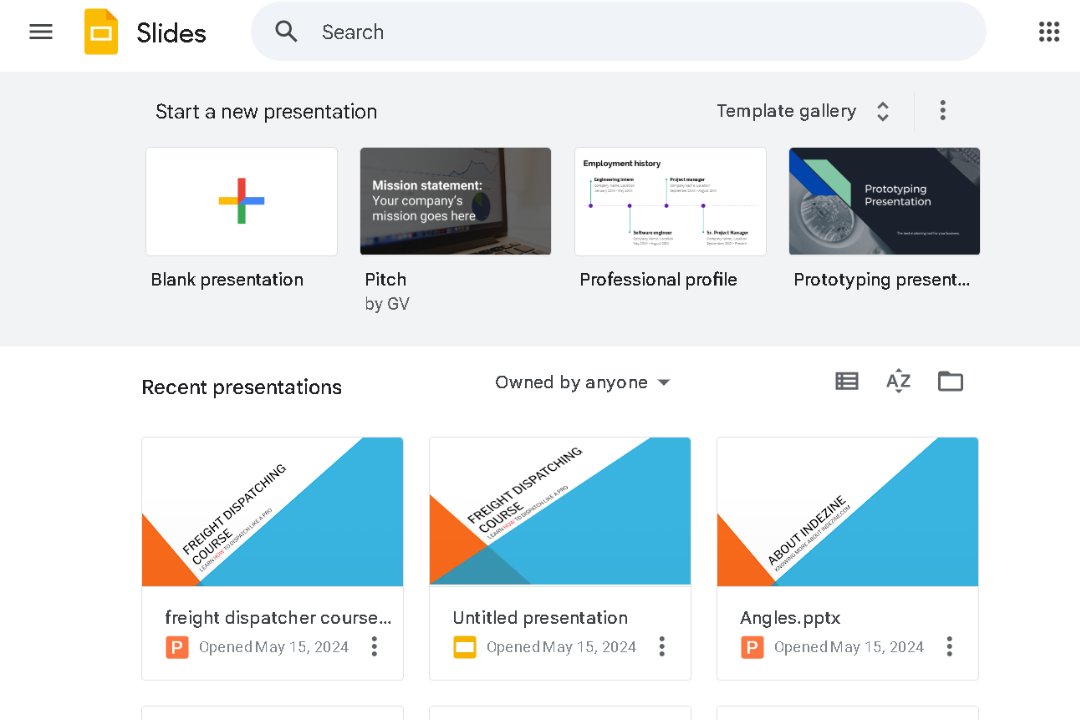
Start a Blank presentation on Google Slides or navigate to the desired page to insert your org chart.
Find Insert > Diagram to open a sidebar with various diagram types and select the Hierarchy option.
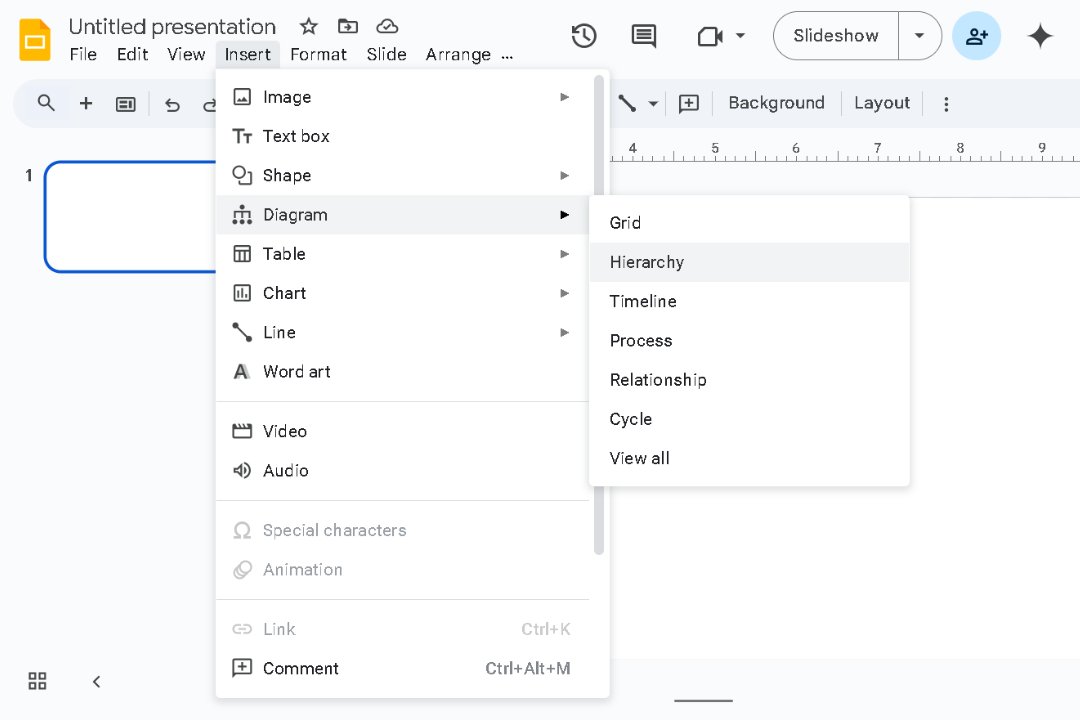
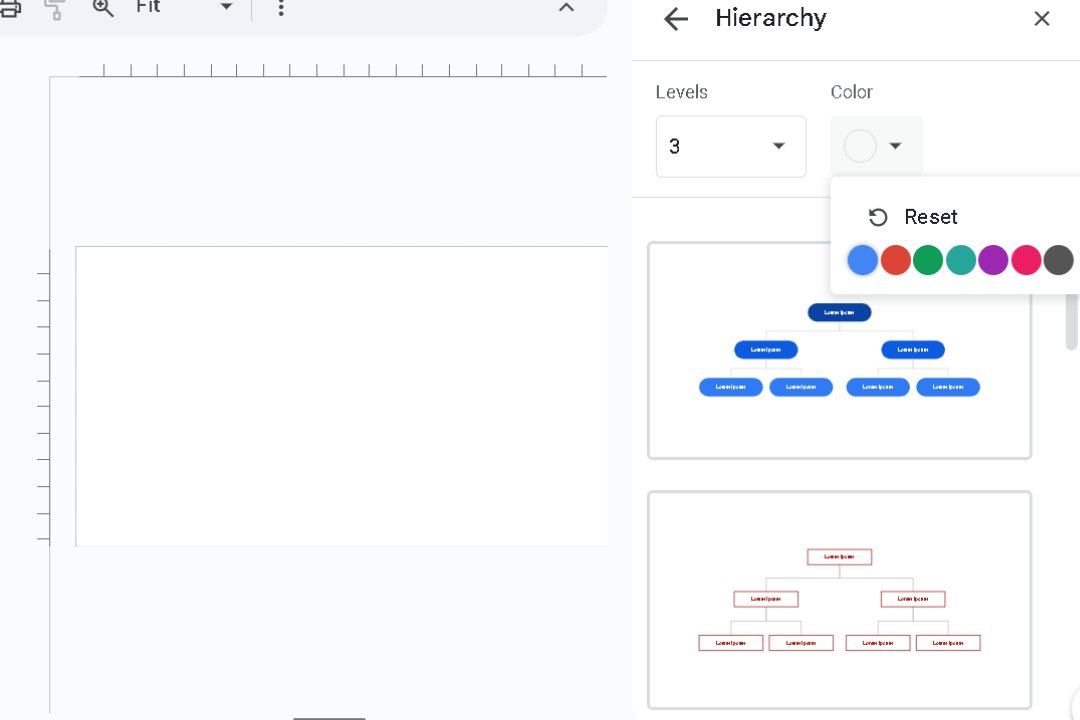
Pick one from various org charts available on the right side.
You can adjust the required chart Levels and Colors. Choose the one that best suits your organizational structure.
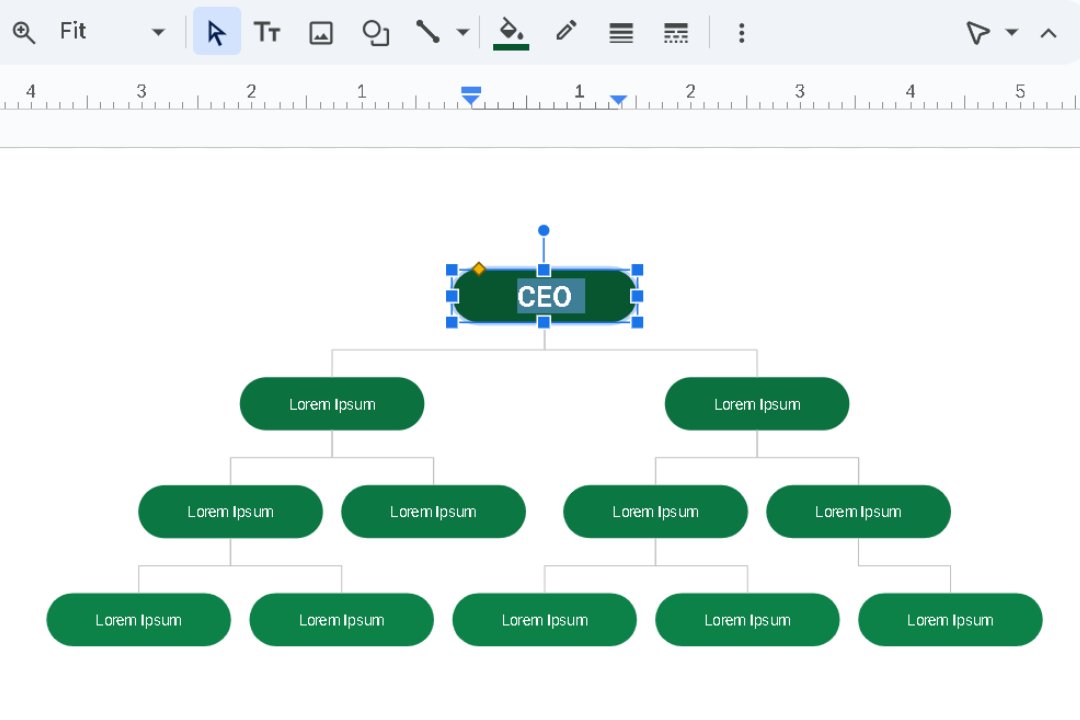
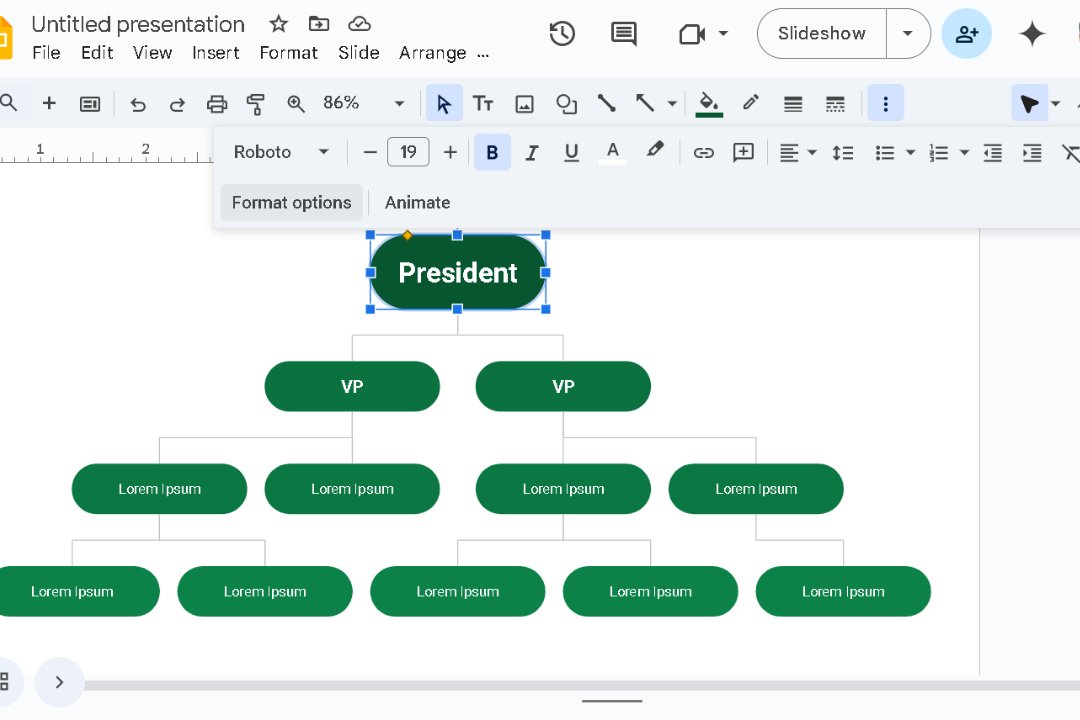
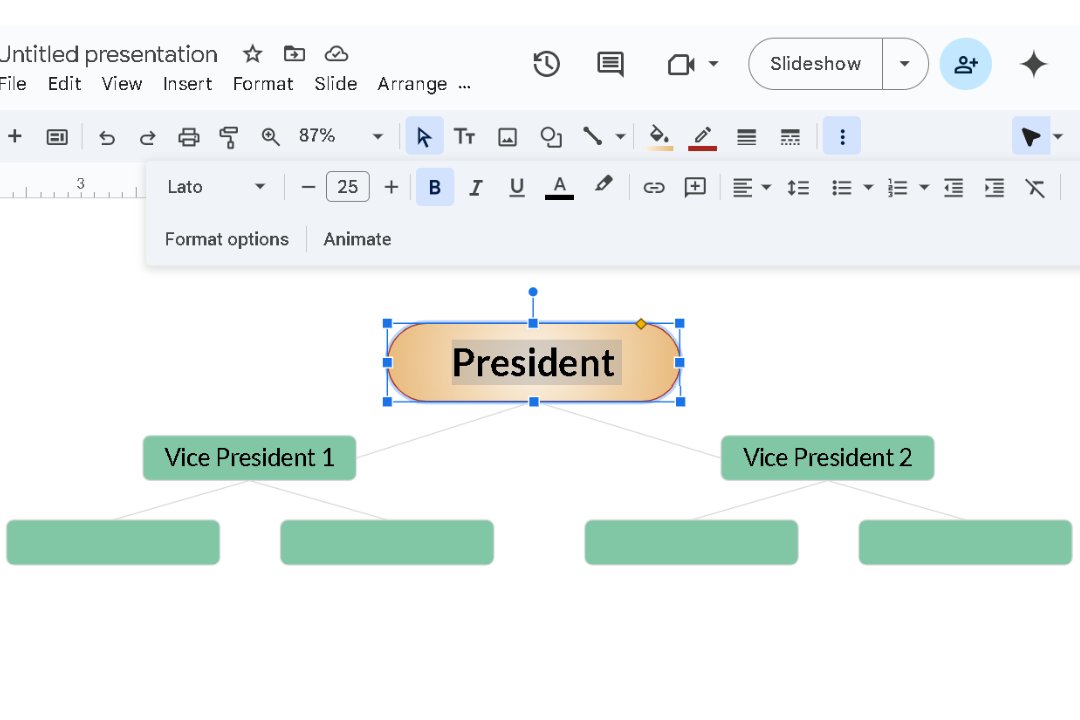
Step 2Customize Org Chart Text
Tap on any shape to modify the placeholder text with your text. e.g. change the title of the highest-ranking person in your organization (e.g., CEO, President).
Step 3Tweak Its Layout and Format
Drag the shapes to replace them anywhere. You can also use the instant blue guides to align elements neatly.
Select a shape and modify it using the toolbar:
Select the text within the shapes to:
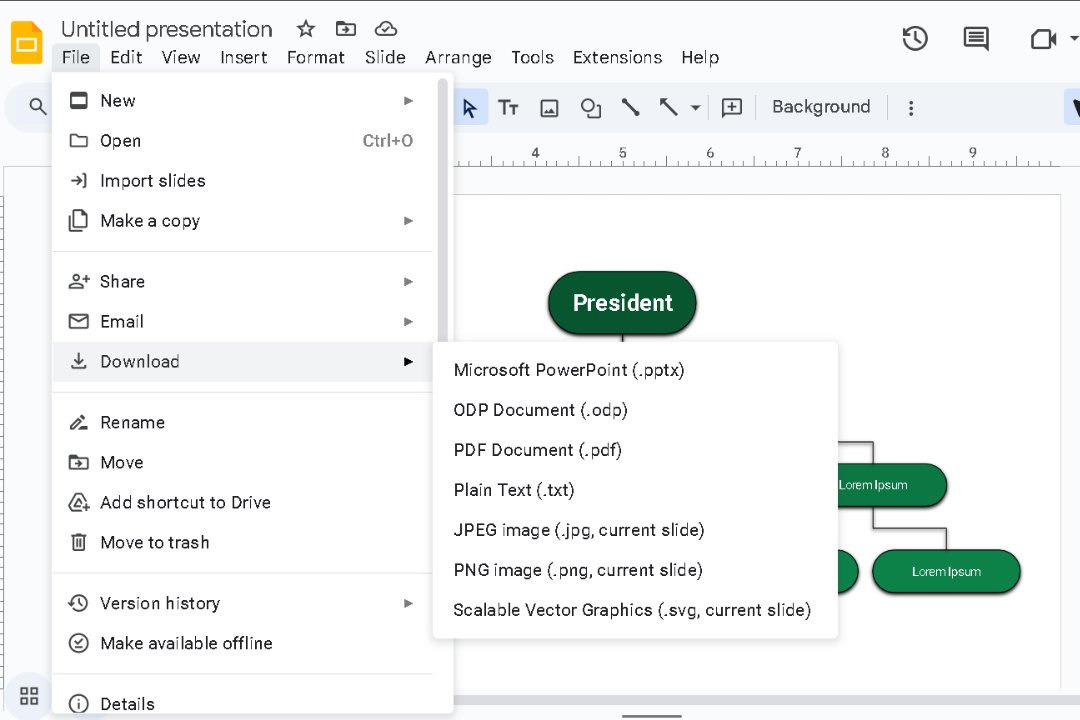
Step 4Review and Download the Final Org Chart
Once finalized, give it a quick review to tweak anything. If everything is fine, download it or share your presentation with others.
Method 2: Build an Org Chart Yourself from Scratch
Step 1Add Shapes and Lines
Start with a blank slide to design your chart from scratch, just like the previous method.
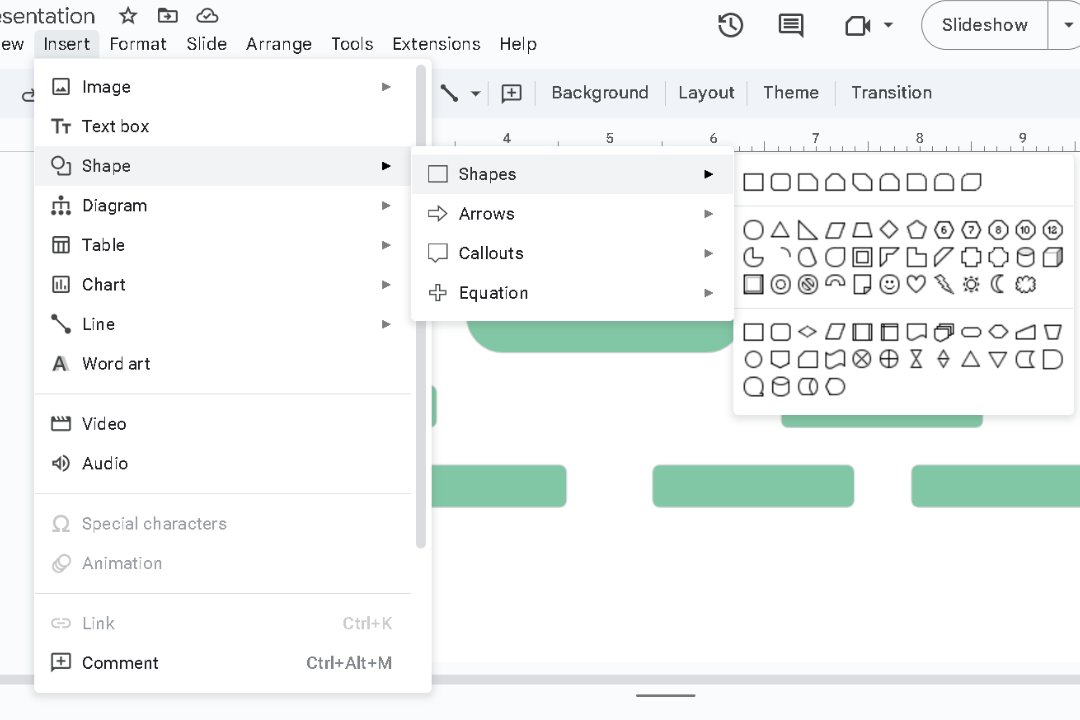
From the Insert menu, choose a Shape to represent each person or role. Rectangles are common, but you can experiment.
Use the simple drag-and-drop feature to replace the shapes wherever you need.
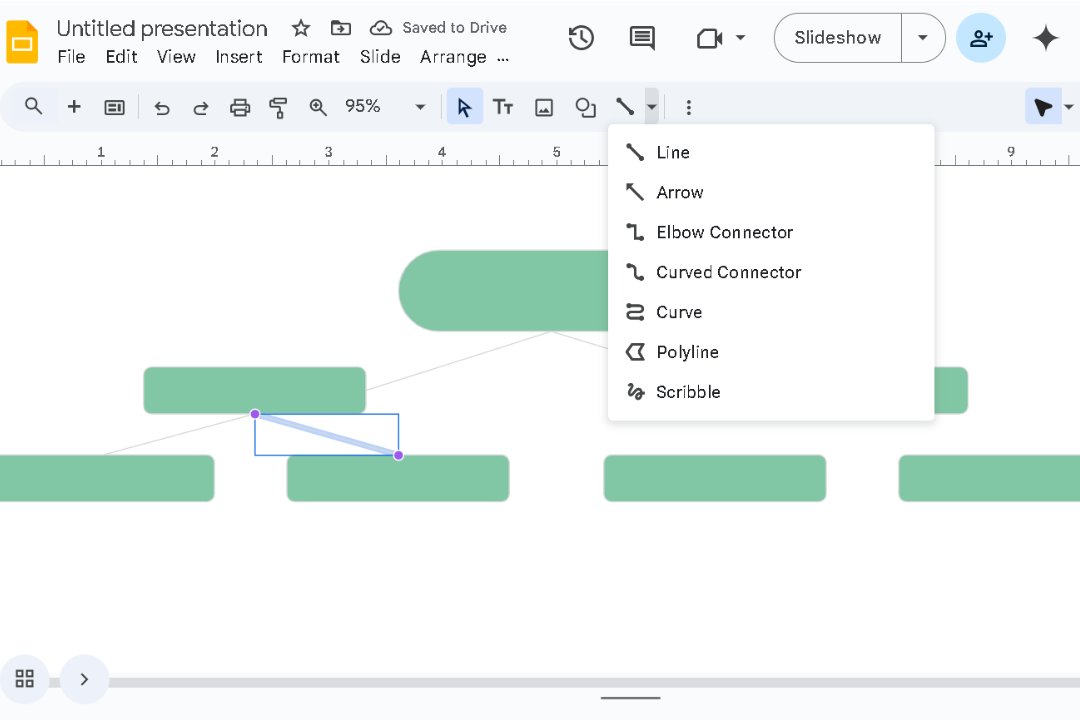
The Line tool lets you connect the shapes, indicating reporting relationships. Select the line style and then click and drag it from one shape to another to draw it.
Step 2Add Details and Customize
Click any shape to add text, including names, titles, or additional key details.
Format shapes and text with your preferred fonts, colors, and borders.
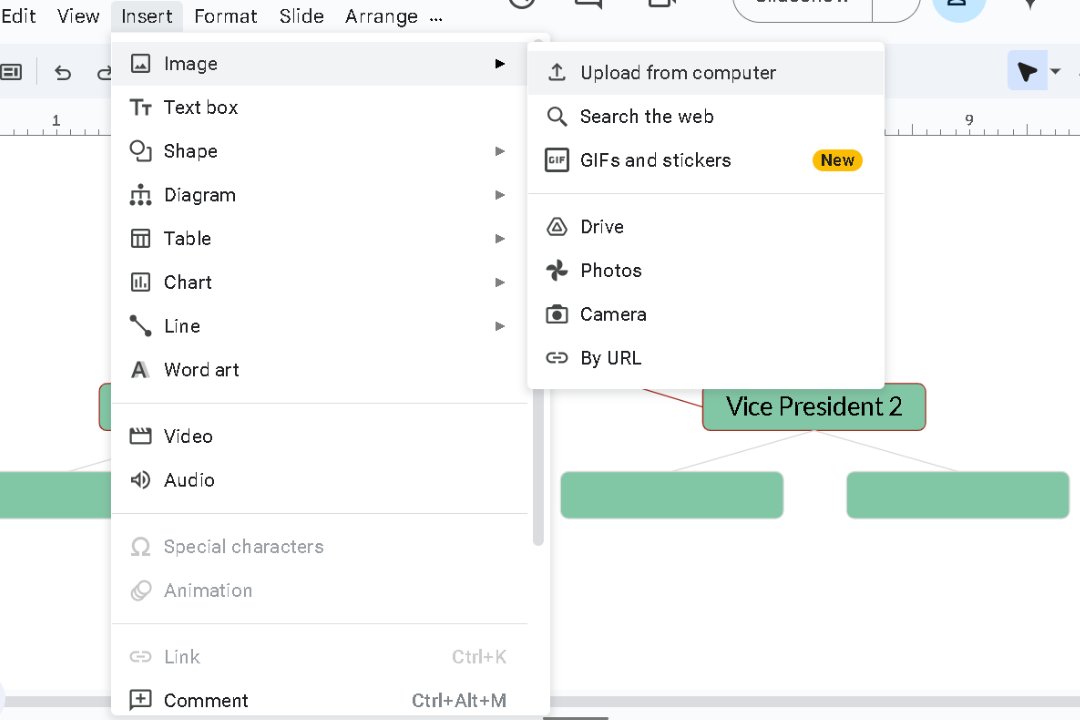
If needed, upload images via Insert > Image.
Step 3Final Checks and Finishing Touches
Double-check everything for accuracy and consistency.
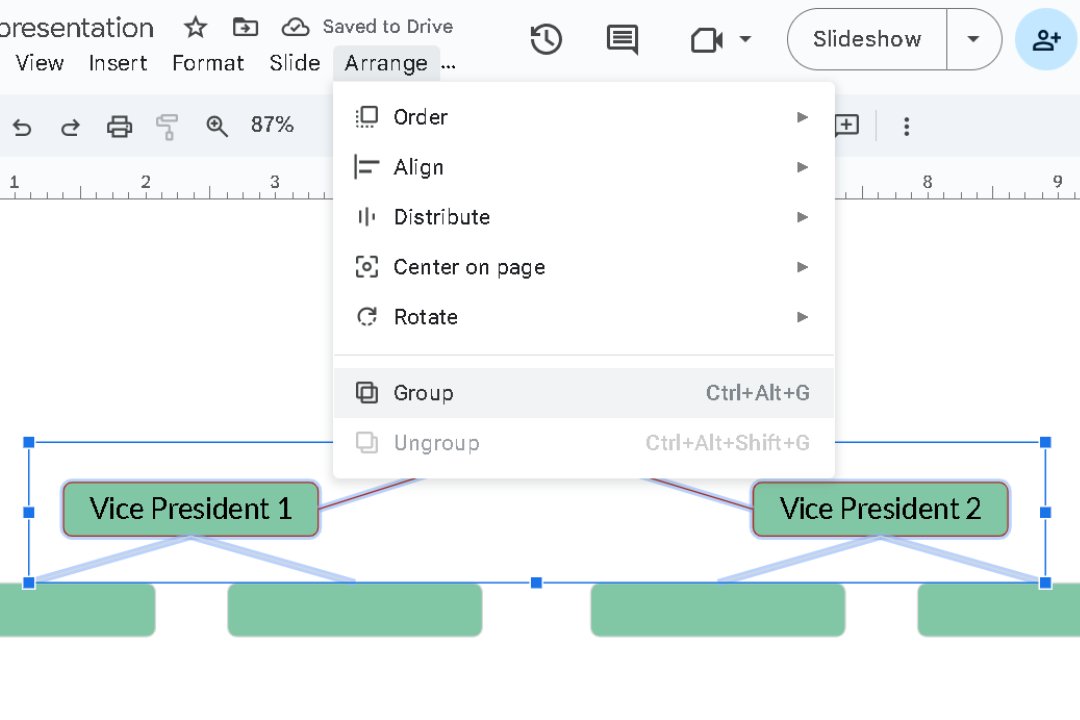
Group related items (Arrange > Group) to simplify future adjustments.
Use the Zoom feature to inspect your layout and ensure everything is aligned.
Finally, download it in the required format.
How to Make an Org Chart in Edraw.AI Quickly
While Google Slides offers basic diagramming tools, it often falls short in customization and ease of use.
Edraw.AI steps in with 40+ AI-driven features, providing smarter and faster solutions for visual collaboration. It can help you create detailed diagrams with seamless brainstorming and improved workflow efficiency.

How to Create an Org Chart Using Edraw.AI?
You can build an organizational chart in Edraw.AI using various methods:
Method 1: Make an Org Chart from Scratch
Step 1 Start Edraw.AI
Head to the New option on your Edraw.AI home screen.
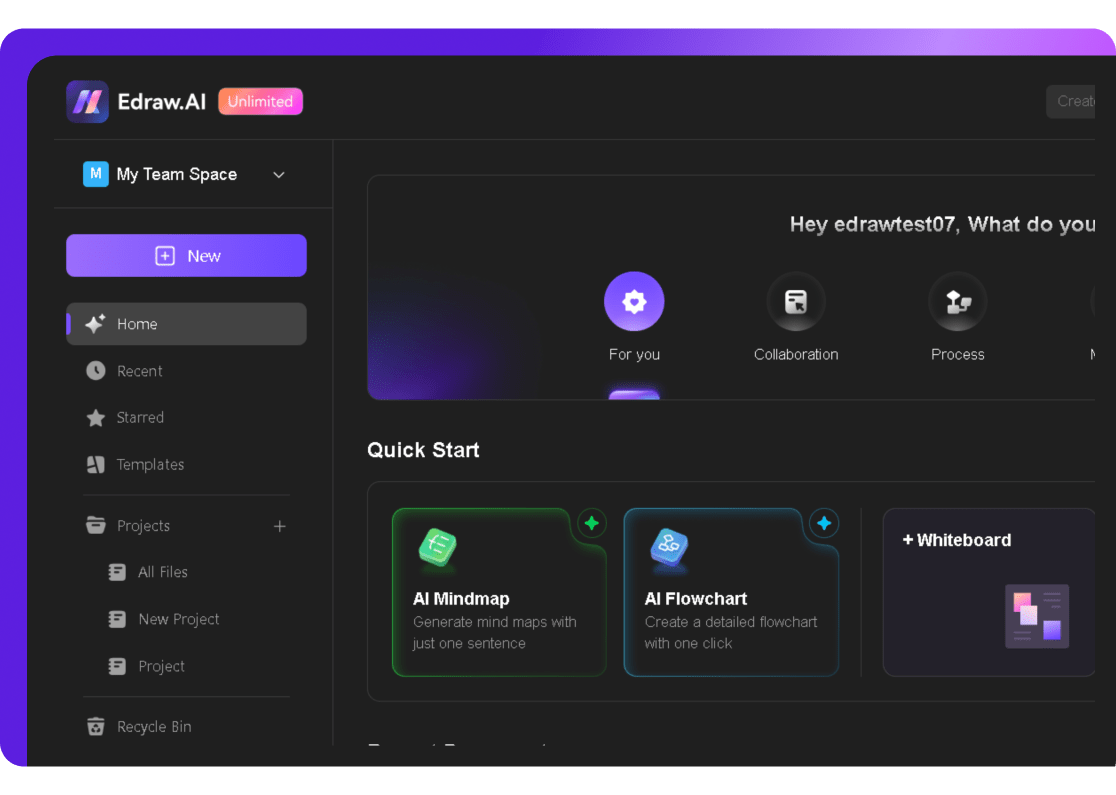
Select the Org Chart category and then New Org Chart to start building your chart from the ground up.

Step 2 Make Your Organizational Chart
You’ll get a basic org chart with two levels for an easy start.
For more levels, click a shape and add a sub-topic below or on the right from the + sign that appeared on the edges.
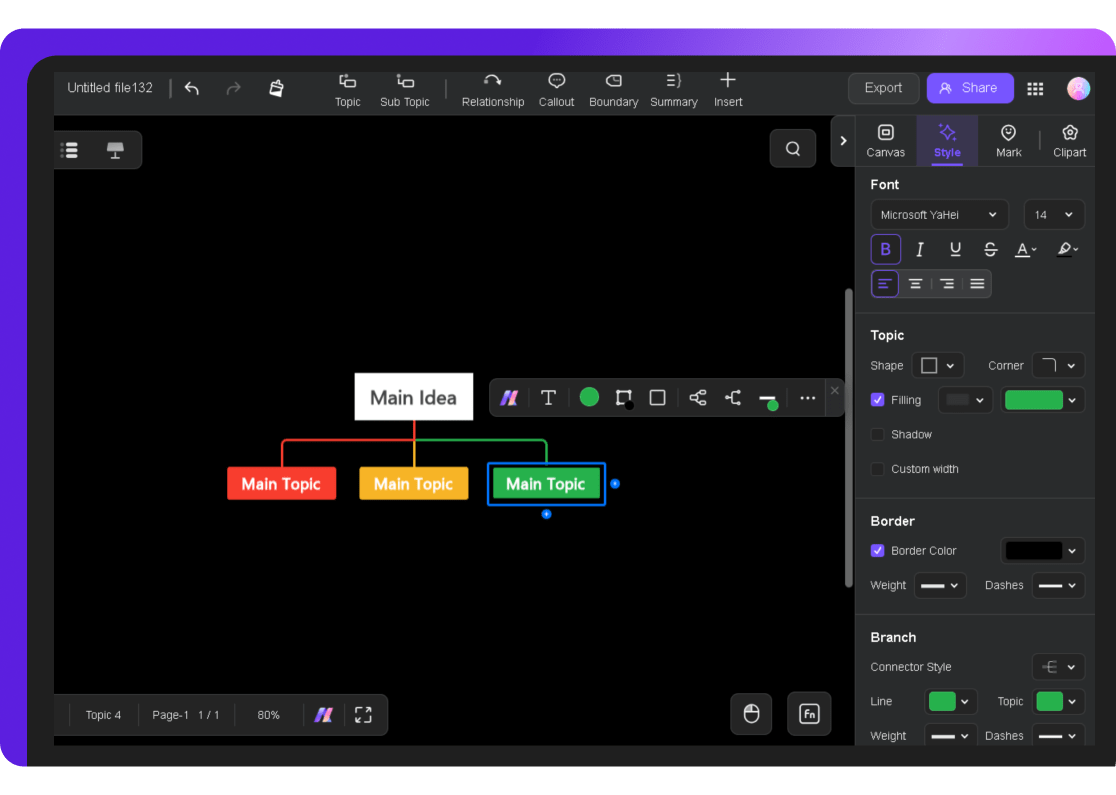
To delete any shape, simply select it and hit the Delete button.
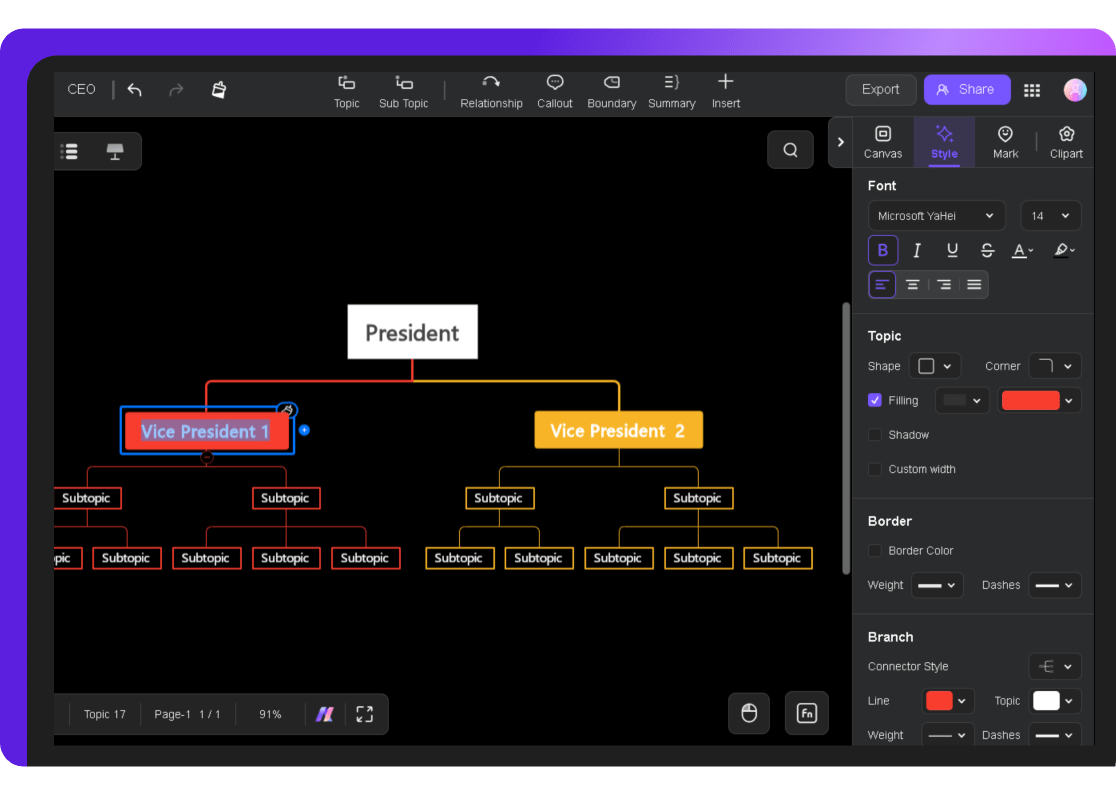
Click each shape to add your text, job titles, names, or department details.
You can customize shape colors, fonts, borders, and lines from the Style menu.
If required, resize the shape using corners.
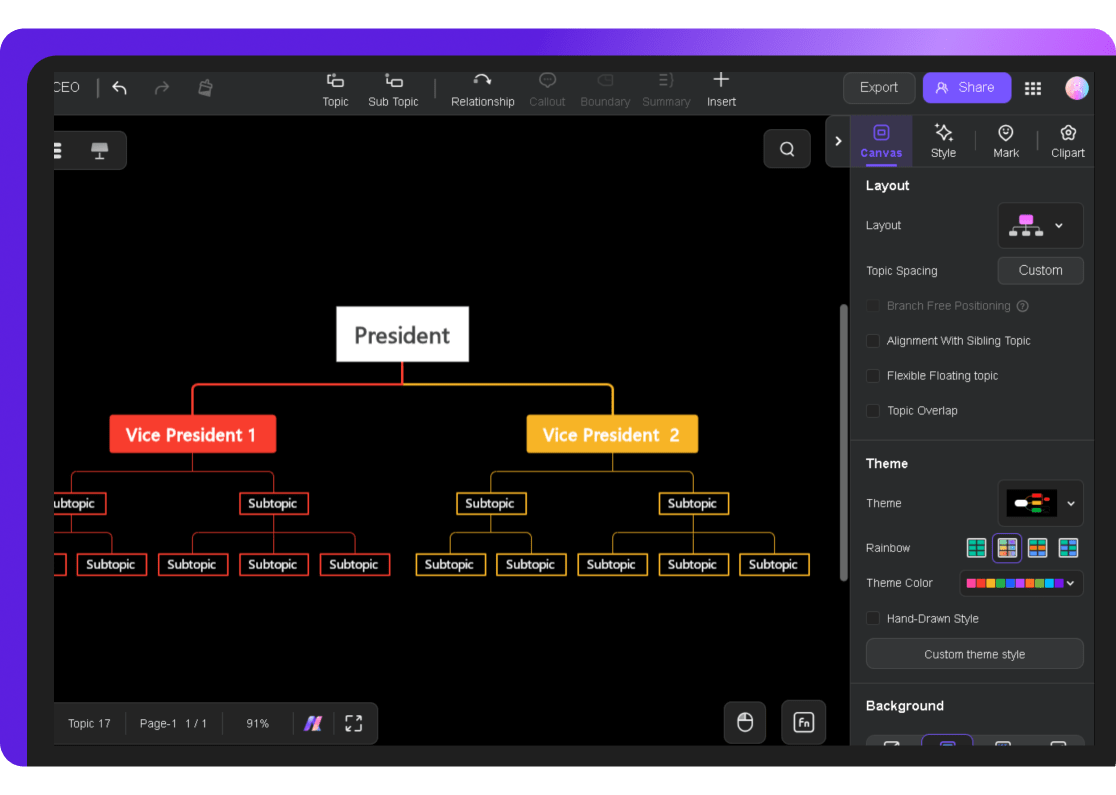
Customize its Layout, Theme, and Background from the Canvas tab on the right.
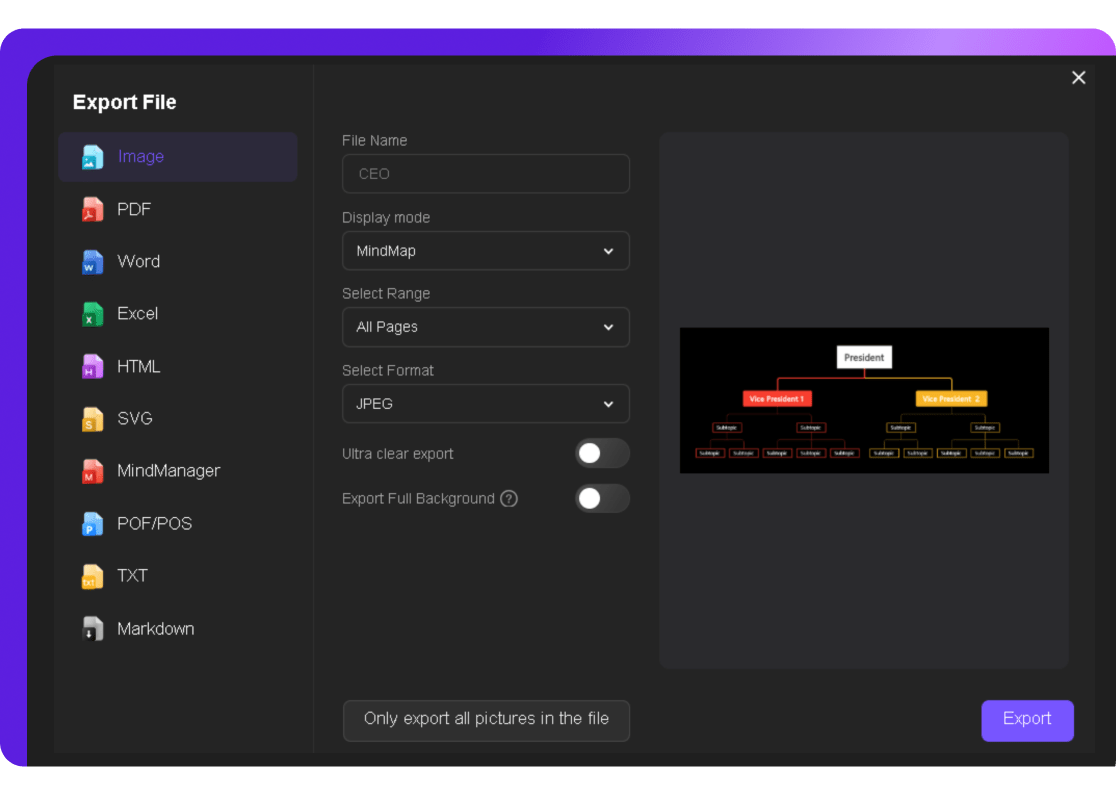
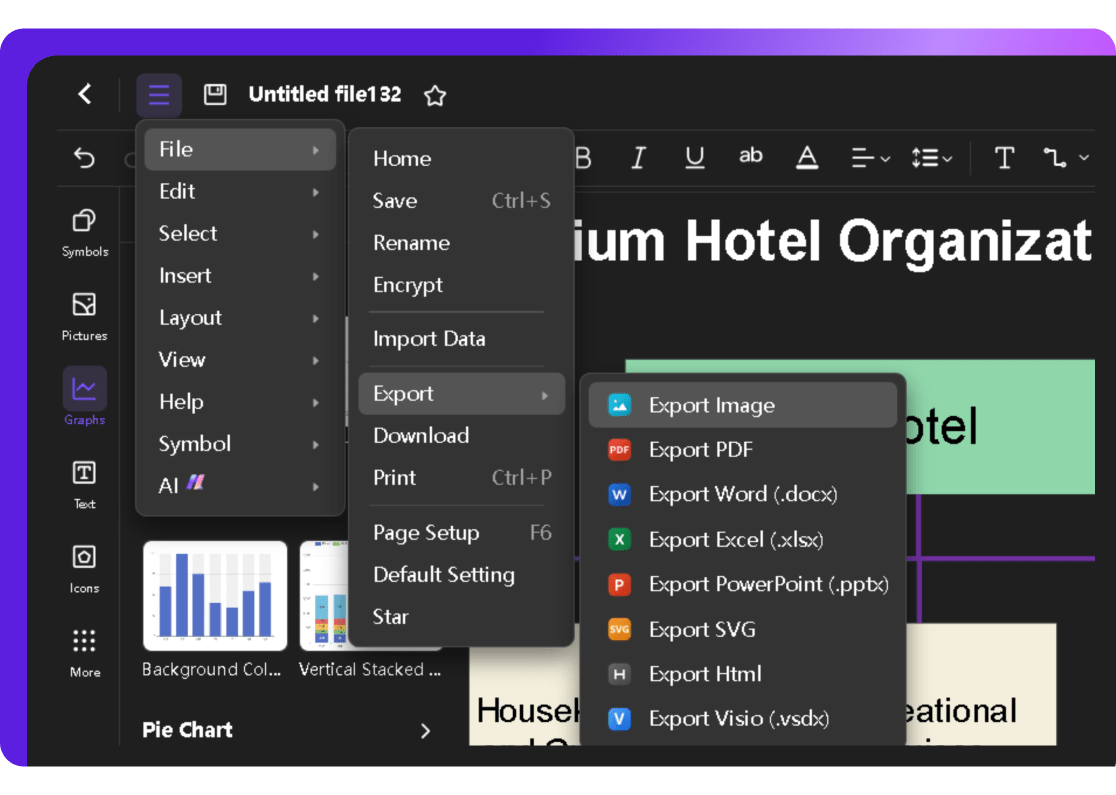
Step 3 Export the Final Organizational Chart
When happy with the result, go to File>Export and pick your desired format and settings to export the chart.
Method 2: Use an Org Chart Template
Step 1 Get Started with a Template
Navigate to the Templates section in Edraw.AI. Search for the “organizational chart” to explore a variety of pre-designed options.
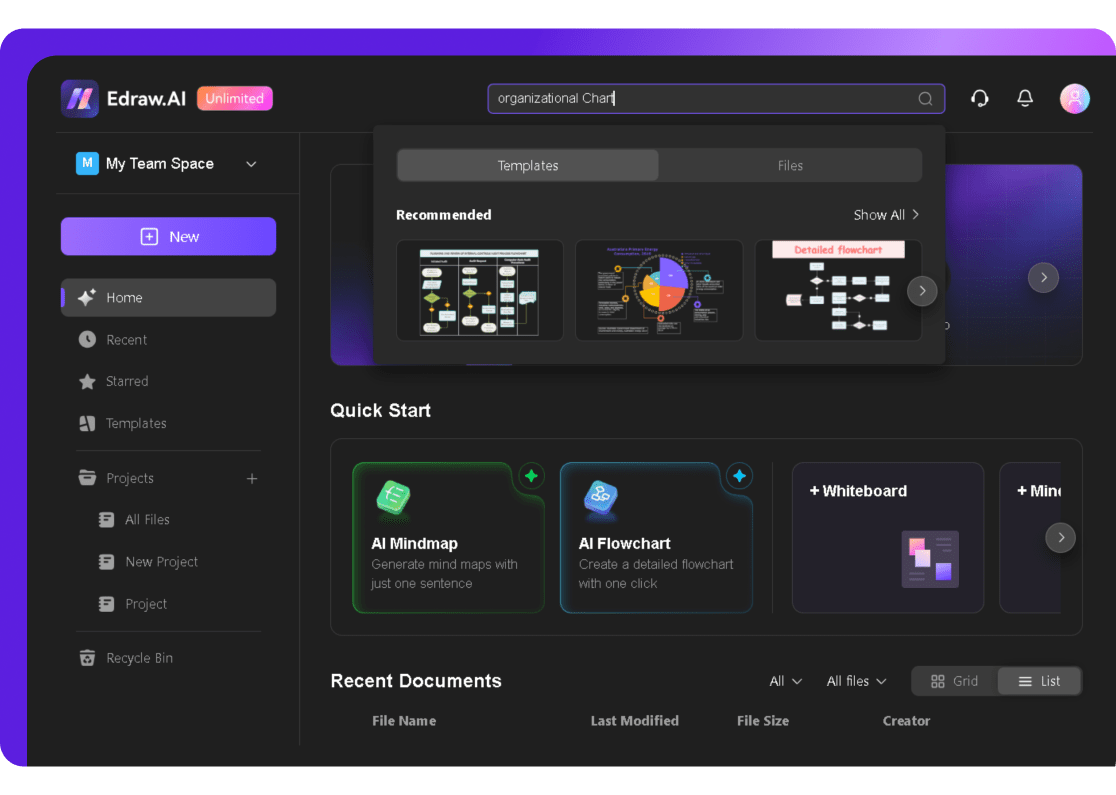
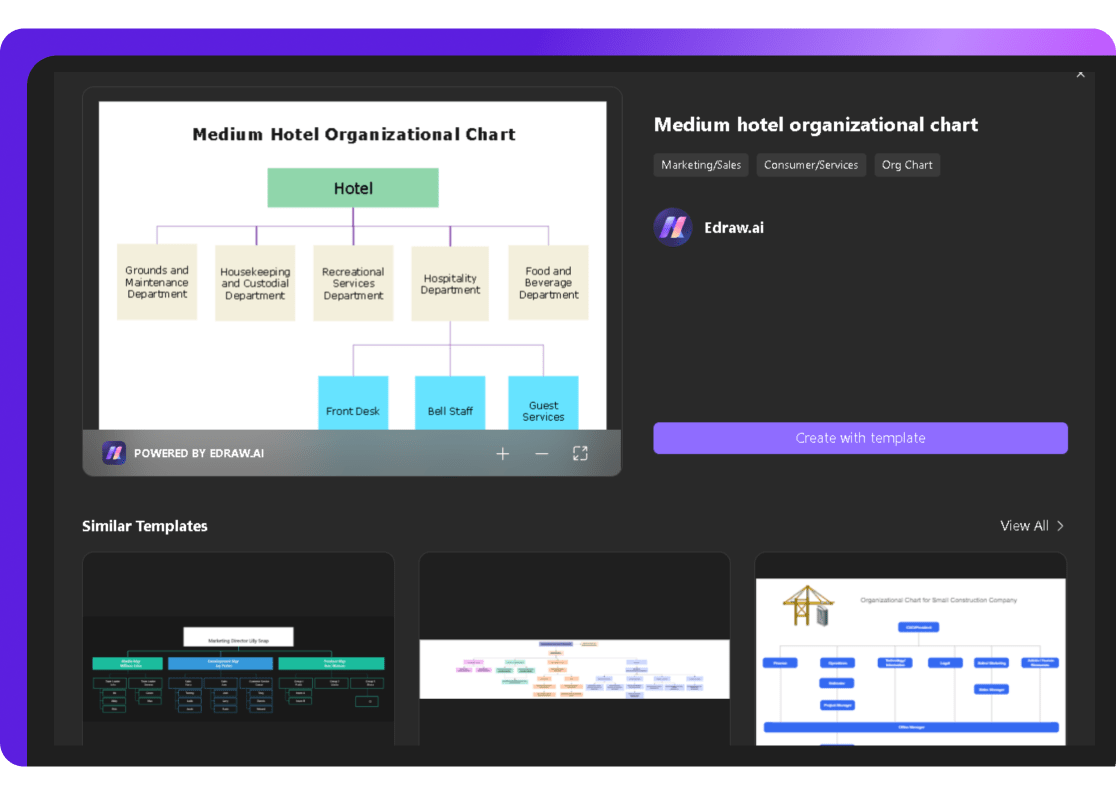
Preview the available templates and select one that fits your organization.

Click Create with template to open it in the editor.
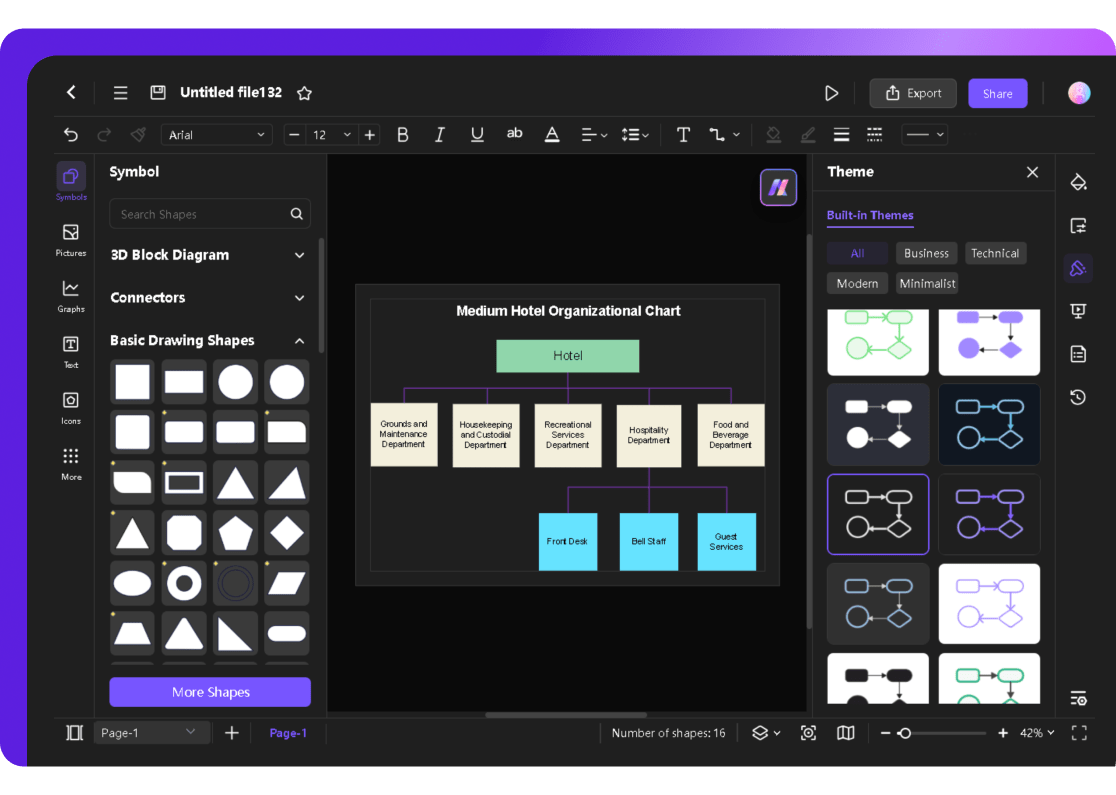
Step 2 Personalize the Template
Choose a suitable theme style from the right tab.
Double-click on any shape or text to customize it. Replace placeholder information with actual names, titles, and department details relevant to your team.
Add shapes from the left side library if required or delete existing ones to tailor the chart.
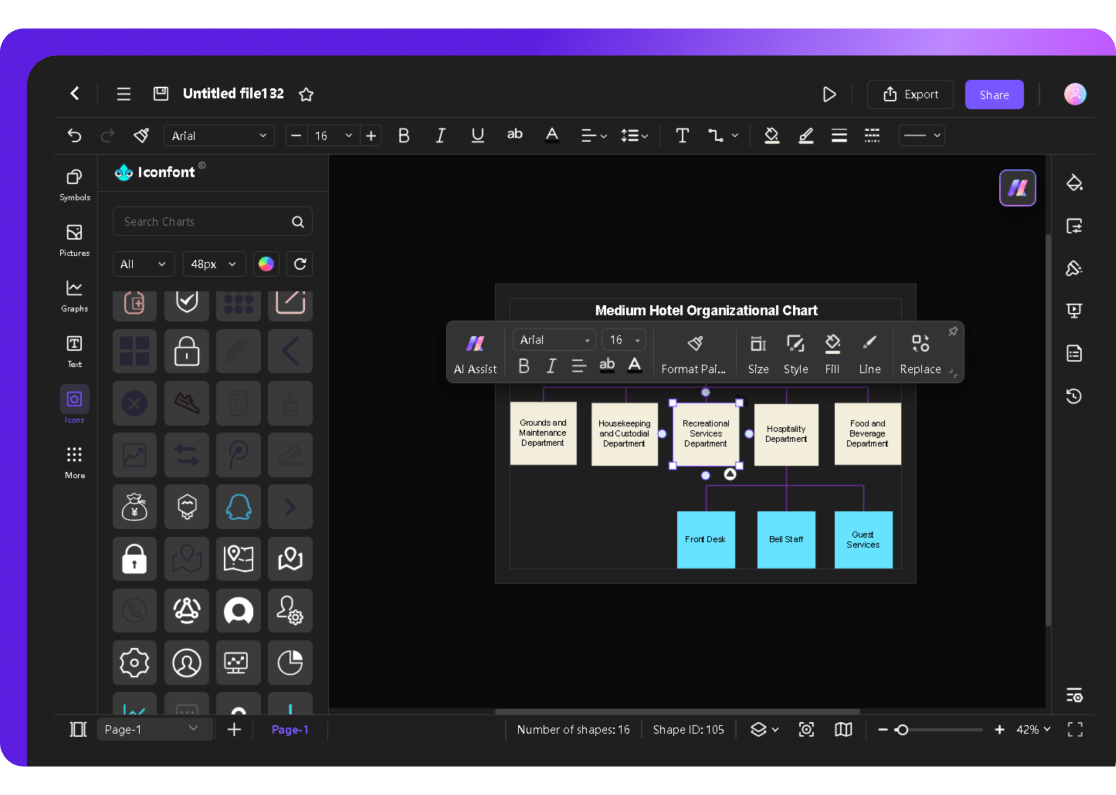
Use the toolbar to ensure everything aligns properly.
If needed, add icons for enhanced visuals.
Select a shape to modify it; change size, style, color, and more from the pop-up menu.
Step 3 Save or Export the Final Chart
Use CTRL+S to save your org chart to the cloud for future updates.
Alternatively, from the File menu, choose Export to download it in any available format, including PNG, PDF, SVG, etc.
Tips for Making Org Charts in Google Slides
Start with a Clear Layout
Before diving in, map out the hierarchy. Sketch it on paper or use an org chart example as a reference. This planning step prevents confusion and ensures a logical flow.
Adjust the Slide Layout for Better Visibility
Begin by switching to a blank layout for a clutter-free workspace. Click Slide > Apply Layout > Blank to maximize the space available for your chart.
Use Text Boxes for Additional Details
If a node needs extra information, add a text box to keep it organized. Go to Insert > Text Box, place it beneath the shape, and type in the details. This helps explain roles or responsibilities without overloading the main chart.
Maintain Proportions
Ensure shapes remain uniform by resizing them carefully. Select the shape, hold Shift, and drag a corner handle to adjust size proportionally. This keeps the chart visually balanced.
Utilize Connectors for Clear Links
Use connectors instead of lines to link shapes, ensuring clarity even when repositioning elements. Click Insert > Line > Elbow Connector and attach it to the relevant nodes. This avoids misaligned or tangled connections.
Conclusion
Both of these org chart makers can help you build clear and effective charts.
Creating an org chart in Google Slides is simple and flexible but often requires manual adjustments, especially for larger or more complex teams. While effective for basic needs, achieving a polished look can be time-consuming.
For a faster, more efficient option, Edraw.AI is a solid Google Slides alternative. Its AI-powered tools let you create professional org charts in minutes, with customizable templates and seamless collaboration features.
So, explore Edraw.AI’s free trial to see how its advanced features can simplify your planning.

Try Our Products
Now for Free

Make 210 types of diagrams: flowcharts, blueprints, UML, etc
AI Mind Map, AI PPT, real-time
collaborative brainstorming